Chiral Metabolomics — Why Enantiomer-Resolved Data Matters
Mirror-image metabolites are chemically identical but biologically distinct — D-2-hydroxyglutarate drives
IDH-mutant tumors while L-2HG does not, and D-serine, not L-serine, activates the NMDA receptor. Standard
metabolomics sums both isomers into one number, hiding the biologically active species behind its inactive
counterpart. Researchers are left unable to distinguish oncometabolite from background, D-serine from
L-serine, or microbial D-lactate from host lactate.
Chiral metabolite analysis by LC-MS/MS resolves this by quantifying each enantiomer separately:
- Enantiomer-resolved panels: D/L-amino acids, D-2HG, and D/L-lactate reported as
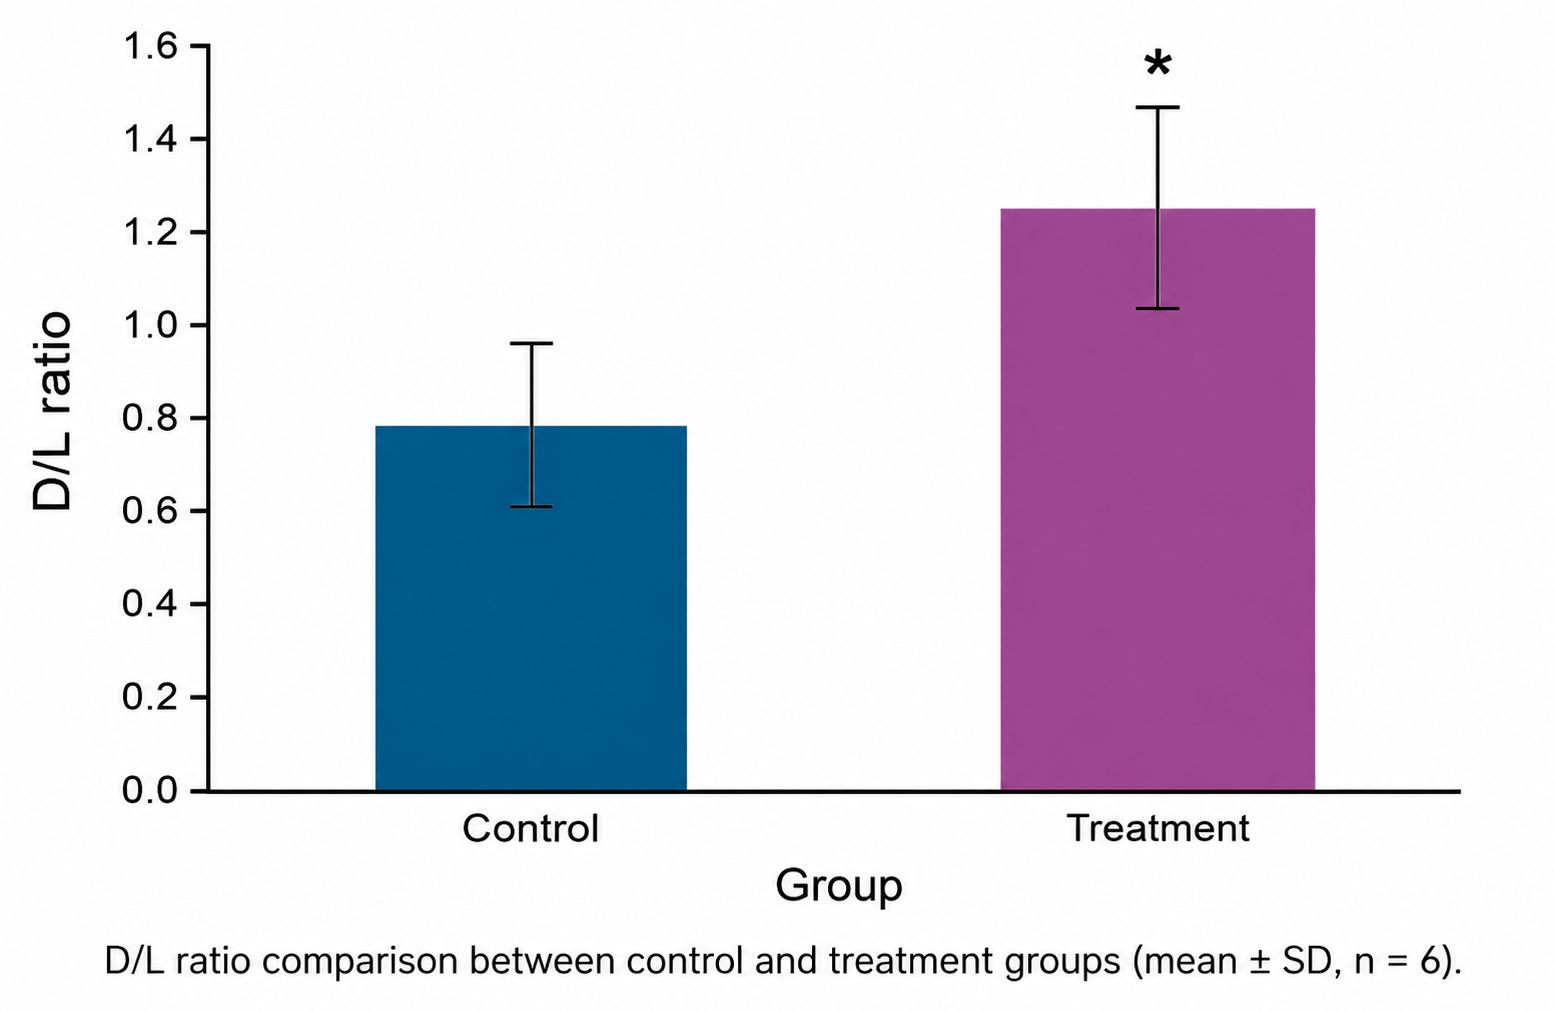
separate D and L concentrations plus the D/L ratio — the active isomer is never averaged away.
- Dual separation strategy: Chiral stationary phase columns and chemical derivatization
are selected per analyte class, giving robust resolution for both abundant and trace D-isomers.
- Oncometabolite-ready: The D/L-2-hydroxyglutarate panel separates D-2HG from L-2HG with
sub-ng/mL LLOQ — the resolution required for IDH-mutant tumor studies.
- Racemization-controlled QC: Enantiopure spike controls in every batch verify that
measured D/L ratios reflect your sample, not preparation artifacts.
Chiral Metabolite Detection Panels and Customization
Three complementary chiral panels cover the enantiomeric metabolites researchers ask about most, plus a
customization path for additional chiral targets. Each panel reports per-isomer concentrations with the D/L
ratio, using class-matched isotopically labeled internal standards and per-analyte multi-point calibration.
Chiral Amino Acid Panel (D/L-Enantiomers)
| Analyte Class |
Representative D/L Pairs |
Biological Context |
| D-Serine and D-Aspartate |
D/L-Serine, D/L-Aspartate |
D-Serine: NMDA receptor co-agonist in schizophrenia, Alzheimer disease, and pain research;
D-Aspartate: endocrine and neurodevelopmental signaling |
| Bacterial Cell Wall D-Amino Acids |
D/L-Alanine, D/L-Glutamate, D/L-Proline |
D-Ala and D-Glu are peptidoglycan components; gut microbiome D-amino acids modulate host immunity
and satiety signaling |
| Aromatic and Branched-Chain D-Amino Acids |
D/L-Phenylalanine, D/L-Tyrosine, D/L-Tryptophan, D/L-Valine, D/L-Leucine, D/L-Isoleucine |
Dietary and microbial D-amino acids; racemization markers of protein aging and food processing
|
| Additional Chiral Amino Acids |
D/L-Methionine, D/L-Threonine (incl. allo-Thr), D/L-Arginine, D/L-Histidine, D/L-Lysine, D/L-Asn,
D/L-Gln |
Complete stereochemical coverage of proteinogenic amino acids for aging, kidney function, and
metabolic studies |
D/L-2-Hydroxyglutarate Panel (Oncometabolite)
| Analyte |
Isomer Pair |
Biological Context |
| 2-Hydroxyglutarate |
D-2HG and L-2HG quantified separately |
D-2HG is the IDH1/IDH2-mutant oncometabolite in glioma, AML, and cholangiocarcinoma; L-2HG arises
from hydroxyacid-oxoacid transhydrogenase and hypoxic conditions. Enantiomer-resolved measurement
distinguishes true oncometabolite accumulation from background |
| Related TCA Intermediates |
Alpha-ketoglutarate, cis-aconitate, citrate (achiral, for pathway context) |
IDH mutation shifts the TCA pool; contextual achiral intermediates support interpretation of the
D/L-2HG readout |
Chiral Organic Acid and Hydroxy Acid Panel
| Analyte Class |
Enantiomer Pair |
Biological Context |
| Lactate |
D/L-Lactate |
D-Lactate is a bacterial fermentation product and marker of gut microbial metabolism and sepsis;
L-lactate reflects host glycolysis. The D/L ratio distinguishes microbial from host origin |
| Hydroxybutyrate |
D/L-3-Hydroxybutyrate |
D-3-HB is the physiological ketone body; L-3-HB is a minor enantiomer. Chiral separation avoids
overestimation of ketone bodies in metabolic studies |
| Additional Chiral Organic Acids |
2-Hydroxyisovalerate, 2-Hydroxybutyrate, glycerate (D/L) |
Branched-chain and glycolytic side products with enantiomer-specific metabolic origins |
Customization and Add-ons
Additional chiral targets — including enantiomers of carnitine, amino acid derivatives, and drug
metabolites — can be added to any panel on request. For the achiral breadth of amino acid and organic acid
coverage, our amino acid analysis and organic acids analysis services quantify the full panel of
non-chiral and summed analytes on the same sample types.
Why Choose Our Chiral Metabolite Analysis Service?
- Enantiomer-Resolved, Not Summed
Every analyte is reported as separate D and L concentrations plus the D/L ratio. You never have to infer the active isomer from a total.
- Dual Separation Strategy
Chiral column and derivatization approaches are selected per analyte class, giving robust resolution for both abundant and trace D-isomers.
- Trace D-Isomer Sensitivity
Derivatization enrichment and optimized MRM reach low ng/mL per-isomer LLOQs, resolving D-isomers that are 2 to 3 orders of magnitude less abundant than their L-forms.
- Oncometabolite-Ready D-2HG Panel
D-2HG and L-2HG are quantified separately with sub-ng/mL sensitivity — the resolution required for IDH-mutant tumor studies.
- Racemization-Controlled QC
Enantiopure spike controls in every batch verify that measured D/L ratios reflect your sample, not preparation artifacts.
- Collaborator-Ready Deliverables
Annotated enantiomer chromatograms, D/L ratio tables, and a methods appendix support clear communication to collaborators and reviewers.
Chiral LC-MS/MS Technology and Method Performance
Enantiomer separation is achieved by two complementary strategies selected per analyte class, both coupled
to triple-quadrupole MS/MS for absolute quantification.
| Parameter |
Specification |
| Chiral column separation (CSP-LC) |
Polysaccharide and macrocyclic antibiotic chiral stationary phases (e.g., Chiralpak, Chirobiotic)
for underivatized D/L separation of organic acids and hydroxy acids; mobile phase optimized per
analyte pair |
| Derivatization-based separation |
Marfey's-type and chiral labeling reagents (e.g., dansyl chloride, o-phthaldialdehyde with chiral
thiol) convert enantiomers to diastereomers resolvable on reversed-phase columns; used for amino
acids and low-abundance D-isomers |
| Mass spectrometry |
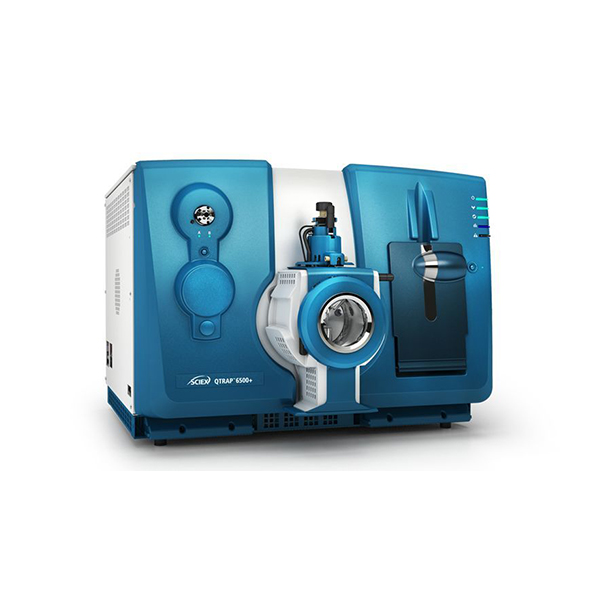
Scheduled MRM on SCIEX QTRAP 6500+ with ≥2 transitions per isomer and qualifier-ratio
confirmation; retention time locked against enantiopure reference standards |
| Sensitivity |
Per-isomer LLOQ in the low ng/mL range (amino acids, lactate); D-2HG LLOQ below 0.5 ng/mL in
plasma to resolve oncometabolite accumulation from background |
| Quantification performance |
R² ≥ 0.995 per enantiomer calibration; accuracy and precision within ±15 percent (±20 percent at
LLOQ); D/L ratio precision documented per batch |
| QC and racemization control |
Racemization monitored with enantiopure spike controls during extraction and derivatization;
pooled QC every 8 injections; isotope-labeled internal standards added at extraction |
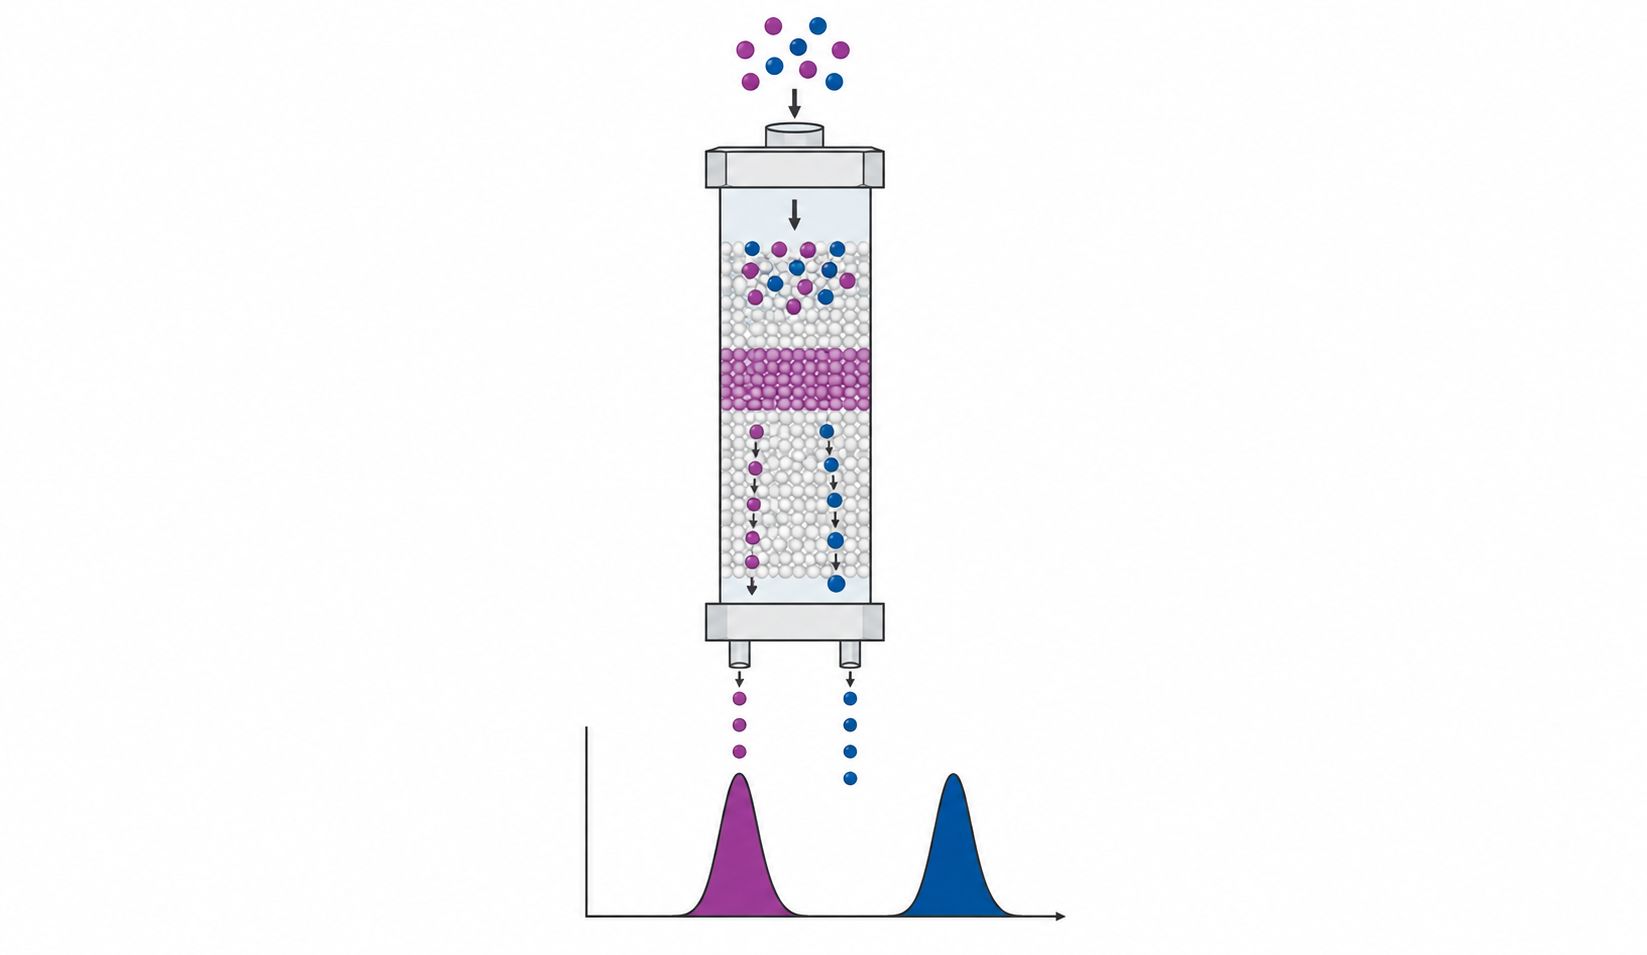
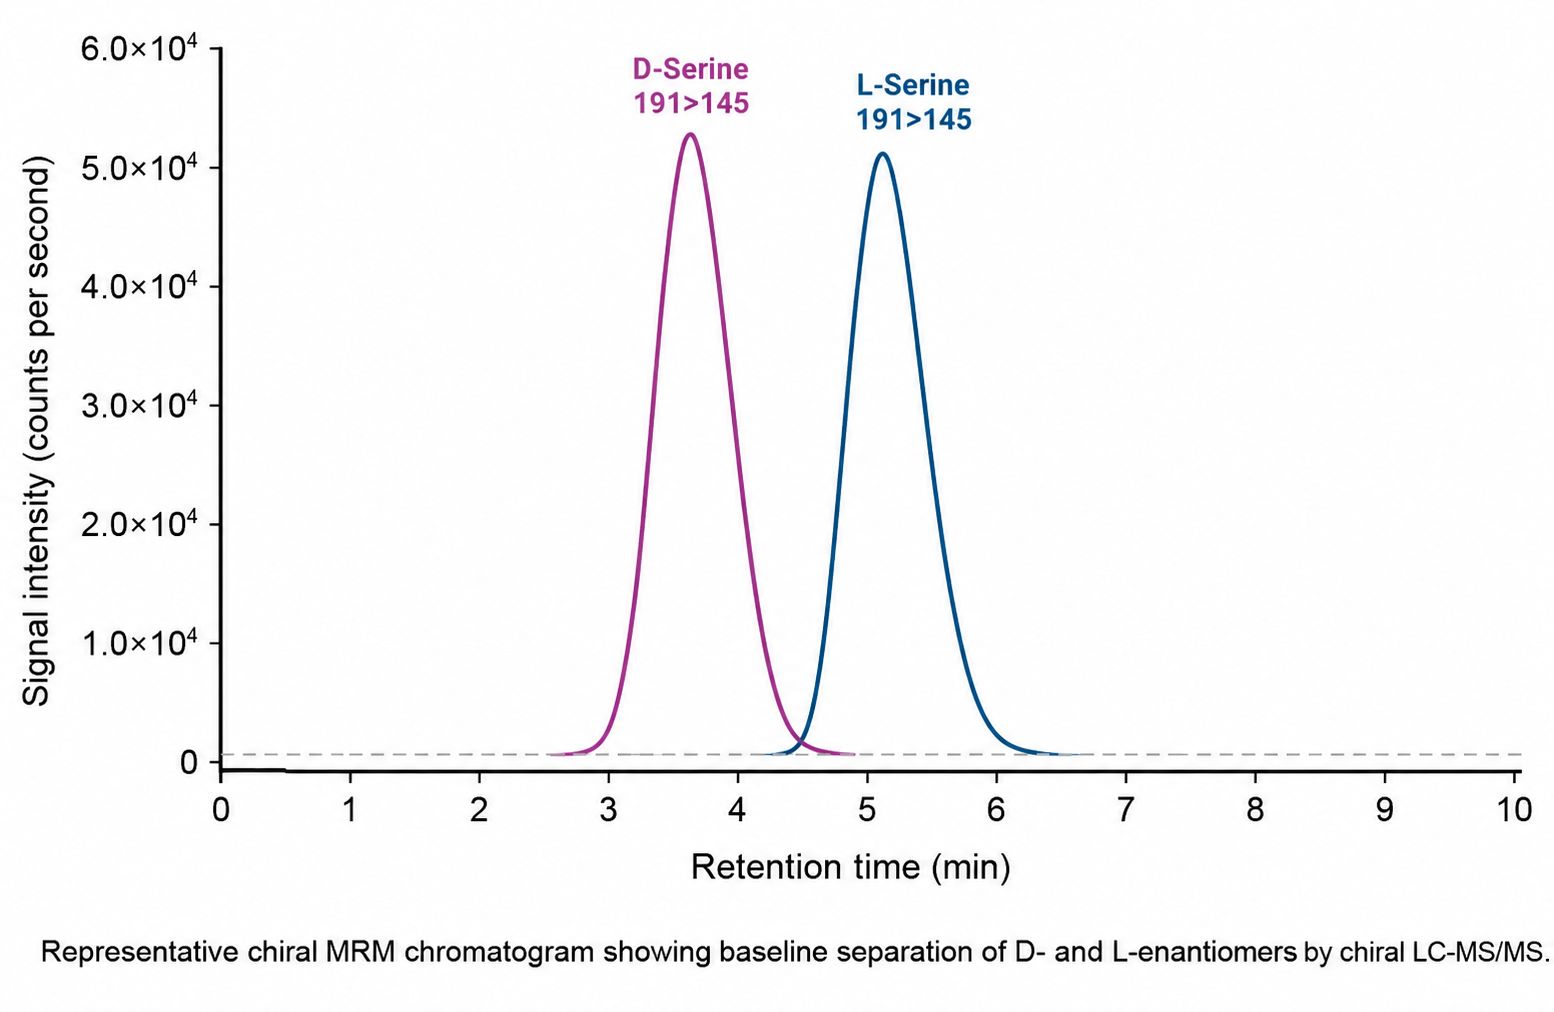
Chiral column separation principle: D and L enantiomers resolved on the chiral stationary
phase with baseline-separated peaks.
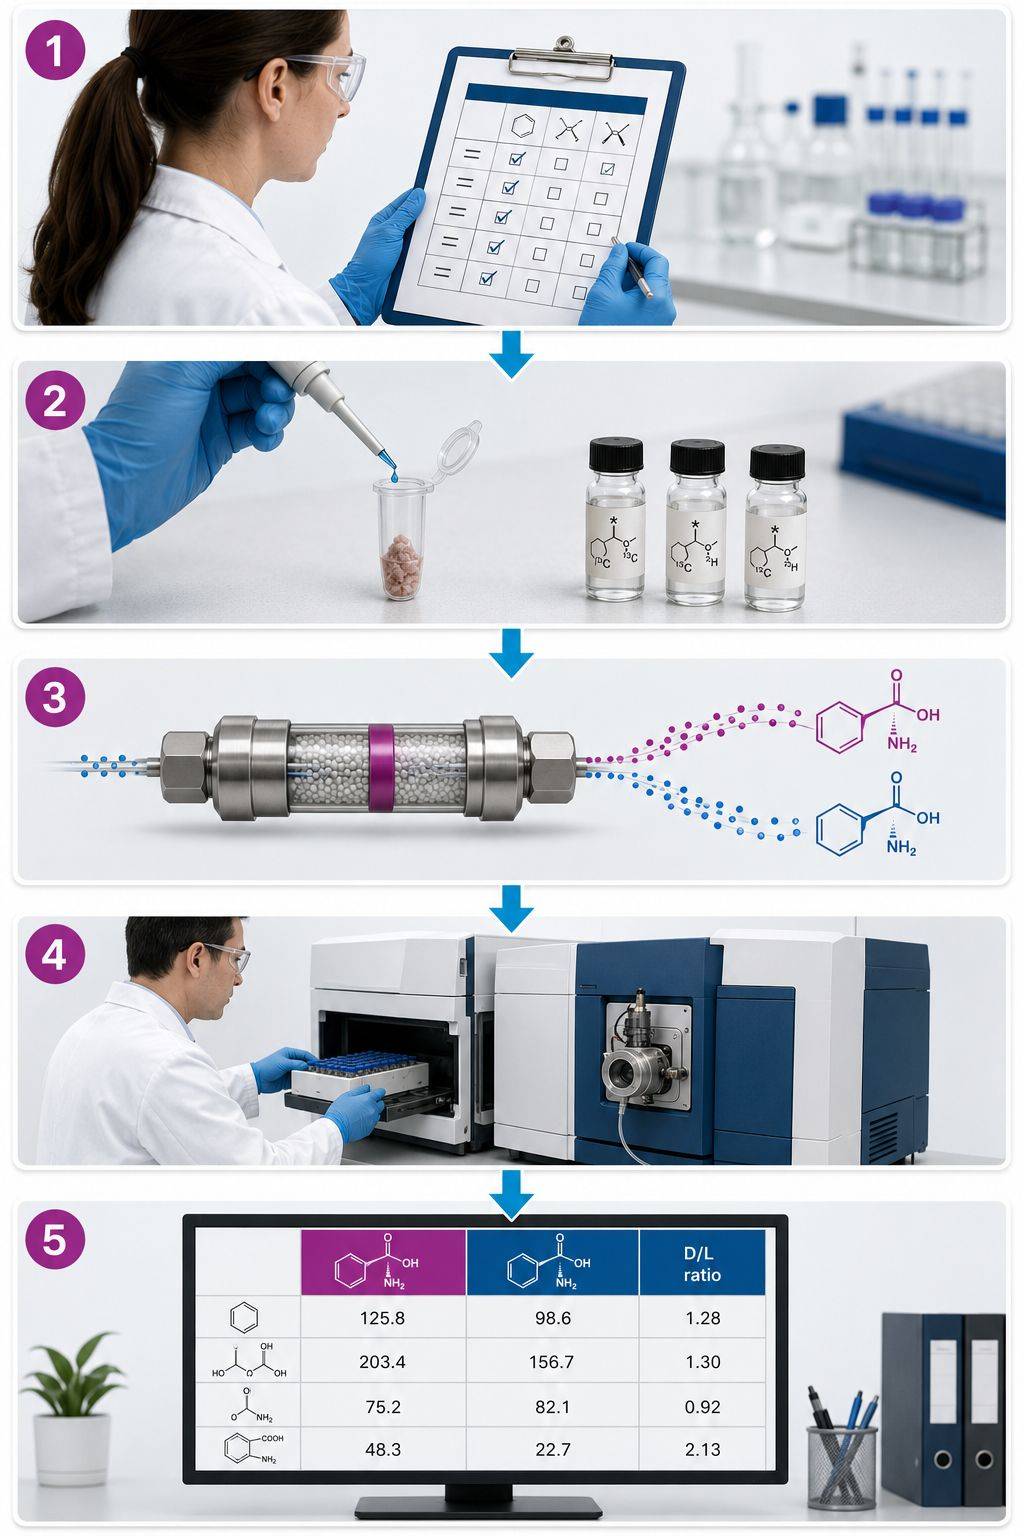
Chiral Metabolite Analysis Workflow — A Step-by-Step Guide
How to Prepare and Submit Samples for Chiral Metabolomics
| Sample Type |
Minimum Amount |
Preparation |
Storage and Shipping |
| Plasma / Serum |
≥ 50 µL per panel |
Collect in EDTA tube, centrifuge at 4°C within 30 min, aliquot, avoid hemolysis. Fasting samples
recommended for lactate and amino acid panels |
−80°C; ship on dry ice |
| CSF |
≥ 100 µL |
Aliquot immediately after collection; minimize freeze-thaw cycles — D-serine and D-aspartate are
stable but concentrations are low |
−80°C; ship on dry ice |
| Tissue (brain, liver, tumor) |
≥ 20 mg wet weight |
Snap-freeze in liquid nitrogen immediately; record wet weight. For 2-HG analysis, avoid prolonged
ischemia time which alters TCA intermediates |
−80°C; ship on dry ice |
| Cell Pellets |
≥ 1 × 10⁶ cells |
Wash twice with cold PBS, centrifuge at 4°C, aspirate supernatant completely, snap-freeze pellet.
Include medium blank for secreted D-amino acids |
−80°C; ship on dry ice |
| Fermentation Broth / Food |
≥ 200 µL (broth); ≥ 200 mg (solid) |
Centrifuge broth to remove cells; homogenize solids. Record processing history — D/L-lactate and
D-amino acid ratios shift with fermentation time |
−20°C or −80°C; ship on dry ice |
Critical Notes:
- Chiral integrity is the top priority — racemization during extraction or storage creates false D-isomer
signal. We apply enantiopure spike controls in every batch and flag any sample where racemization controls
exceed threshold.
- Amino acid racemization accelerates with heat and alkaline pH. Samples must be kept cold and neutral
during preparation; do not use acidic protein precipitation for D/L-amino acid panels unless discussed
during study design.
- D-2HG is stable in frozen plasma but is altered by delayed processing of tumor tissue. Snap-freeze
tissue within minutes of resection for oncometabolite quantification.
Deliverables: What You Receive from Chiral Metabolomics Analysis
Every project returns a data package built for decision-making: per-isomer absolute concentrations, D/L
ratios, and full QC documentation.
Quantitative Data Tables (.xlsx/.csv)
Per-isomer concentrations (µM or ng/mL), D/L ratio per analyte per sample, QC flags, and calculated metabolic indices where applicable.
QA/QC Report
Calibration linearity per enantiomer, internal standard recovery, pooled QC RSD, racemization control results, batch trend plots.
Annotated Enantiomer Chromatograms
MRM chromatograms showing baseline-separated D and L peaks with retention time markers and transition assignments.
Raw Data Files
Vendor-native files (.wiff) and open formats (.mzML, .csv) upon request.
Methods Appendix
Chiral column and derivatization conditions, MRM transitions, calibration strategy — formatted for direct inclusion in your manuscript methods section.
Applications of Chiral Metabolomics
Enantiomer-resolved metabolomics supports researchers across disciplines where the D and L forms carry
different biological meaning:
- Tumor Metabolism and Oncometabolite Research — Quantify D-2HG versus L-2HG in
IDH1/IDH2-mutant glioma, AML, and cholangiocarcinoma; track oncometabolite accumulation as a mechanistic
and biomarker readout
- Neuroscience and Neurodegeneration — Measure D-serine and D-aspartate in CSF, brain
tissue, and plasma for NMDA receptor, schizophrenia, Alzheimer disease, and pain research
- Microbiome-Host Signaling — Profile gut microbial D-amino acids and D/L-lactate in
plasma and stool to study bacterial contributions to host metabolism and immunity
- Food Science and Fermentation — Monitor D/L-lactate and D/L-amino acid ratios as
quality markers of fermentation, spoilage, and food adulteration
- Aging and Kidney Function — Track amino acid racemization and D-amino acid accumulation
as markers of protein aging and renal dysfunction
For discovery-scale screening before targeted chiral quantification, our untargeted metabolomics service identifies candidate
metabolite shifts that the chiral panels then resolve at the enantiomer level.
Case Study: Amino Acid and Neurotransmitter Metabolomics in DNAJC12-Associated
Parkinson Disease
Central biogenic amine deficiency with concomitant exploratory behavioral deficits in Dnajc12 knock-out mice
Deng, I. B., Follett, J., Fox, J. D., Wall, S., and Farrer, M. J. |
npj Parkinson's Disease, 2025, 11, 143
DOI: 10.1038/s41531-025-00991-4
Background
Pathogenic variants in DNAJC12, a co-chaperone of the aromatic amino acid hydroxylases, cause young-onset
Parkinson disease and a spectrum of neurological phenotypes. Because DNAJC12 supports the enzymes that
synthesize dopamine and serotonin, researchers needed a quantitative readout of amino acid precursors and
neurotransmitter metabolism in a knock-out mouse model — the same analytical family our chiral amino acid
panels extend to the enantiomer level.
Challenge: Quantify plasma free amino acids and striatal biogenic amines in Dnajc12
knock-out versus wild-type mice to define the metabolic consequences of DNAJC12 loss and its link to
biogenic amine deficiency.
Analytical Approach
Plasma samples from knock-out and wild-type mice were analyzed for free amino acids and related metabolites
by UPLC-MRM/MS at Creative Proteomics, using 41 isotope-labeled internal standards with dansyl chloride
derivatization. Striatal biogenic amines (dopamine, serotonin, and their metabolites) were quantified by
HPLC.
Key Findings
| Metric |
Finding |
| Plasma phenylalanine (Phe) |
Markedly increased in knock-out mice: 71.51 versus 45.15 µM in wild-type |
| Plasma tyrosine and tryptophan |
Unchanged — Phe elevation is selective, consistent with mild hyperphenylalaninemia |
| Striatal dopamine (DA) |
Reduced: 43.70 versus 58.86 ng/mg in wild-type |
| Striatal DA metabolites |
DOPAC 3.20 versus 5.62 ng/mg; HVA 4.05 versus 6.82 ng/mg |
| Striatal serotonin (5-HT) |
Reduced: 5.71 versus 9.38 ng/mg; 5-HIAA 0.83 versus 3.49 ng/mg |
| Behavioral phenotype |
Exploratory behavioral deficits in knock-out mice, consistent with biogenic amine deficiency |
What This Means for Your Chiral Metabolite Research
- Quantitative amino acid panels define metabolic consequences of genetic loss. The
plasma Phe elevation identified the biochemical signature of DNAJC12 deficiency with 41 internal standards
and per-analyte quantification. Our chiral amino acid panel delivers the same quantitative rigor, with the
added ability to resolve D and L forms where isomer identity matters.
- Precursor-product relationships connect amino acids to neuroactive amines. Phe feeds
the tyrosine/dopamine and tryptophan/serotonin axes; measuring the precursor pool alongside the amine
product is what made the mechanism visible. Enantiomer-resolved analysis adds the D-serine/D-aspartate
dimension to the same neurotransmitter biology.
- Isotope-dilution quantification is the foundation. 41 isotope-labeled internal
standards gave unambiguous, matrix-corrected concentrations — the same strategy underpins our chiral
panels, extended to each enantiomer.
Conclusion
This study demonstrates how quantitative amino acid and neurotransmitter metabolomics — the analytical
family our chiral panels extend — reveals the metabolic signature of a genetic disorder with clinical
relevance to Parkinson disease. Our chiral metabolite analysis service provides the same isotope-dilution
rigor with enantiomer resolution, for studies where the D and L forms of a metabolite carry different
biology.
Central biogenic amine deficiency with concomitant exploratory behavioral deficits in Dnajc12 knock-out mice
Deng, I. B., Follett, J., Fox, J. D., Wall, S., and Farrer, M. J.
Journal: npj Parkinson's Disease, 2025, 11, 143
Plasma free amino acids analyzed by UPLC-MRM/MS with 41 isotope-labeled internal standards. Dnajc12
knock-out mice showed markedly increased plasma phenylalanine with striatal dopamine and serotonin
depletion, defining the metabolic signature of DNAJC12-associated Parkinson disease.
Cancer SLC43A2 alters T cell methionine metabolism and histone methylation
Bian, Y., Li, W., Kremer, D. M., et al.
Journal: Nature, 2020, 585, 277–282
Amino acid metabolism study in which tumor cells outcompete T cells for methionine via SLC43A2, impairing
histone methylation and T cell immunity. Demonstrates quantitative amino acid analysis as a mechanistic
readout in cancer immunology.
Reducing branched-chain amino acids improves cardiac stress response in mice by decreasing histone H3K23 propionylation
Yang, Z., He, M., Austin, J., Sayed, D., and Abdellatif, M.
Journal: Journal of Clinical Investigation, 2023, 133(22), e169399
Branched-chain amino acid metabolism linked to cardiac stress response through histone propionylation.
Targeted amino acid quantification revealed BCAA-driven epigenetic remodeling in the failing heart.
Untargeted metabolomics reveal sex-specific and non-specific redox-modulating metabolites in kidneys following binge drinking
Rafferty, D., Martins De Carvalho, L., Sutter, M., et al.
Journal: Redox Experimental Medicine, 2023, 2023(1), e230005
Untargeted UPLC-ESI-TOF-MS metabolomics of kidney tissue in a binge-drinking mouse model, identifying
sex-specific metabolic alterations including tryptophan and kynurenine pathway changes. Demonstrates
discovery-to-targeted workflows around amino acid metabolism.


 Contact Us



