TCA Cycle & Krebs Cycle Metabolic Flux Analysis — Resolving Mitochondrial Velocities
The tricarboxylic acid (TCA) cycle is the central hub of mitochondrial aerobic respiration, generating reducing equivalents (NADH, FADH2) and supplying biosynthetic carbon skeletons. However, measuring static concentrations of citrate, succinate, or malate cannot reveal whether intermediate accumulation is driven by accelerated anaplerotic influx or downstream enzymatic bottlenecks (e.g. SDH or FH loss of function).
As an essential pathway Spoke within our central carbon metabolic flux analysis and broader metabolic flux analysis service, TCA Cycle MFA tracks 13C isotopes through mitochondrial and cytosolic compartments to resolve key metabolic decision nodes:
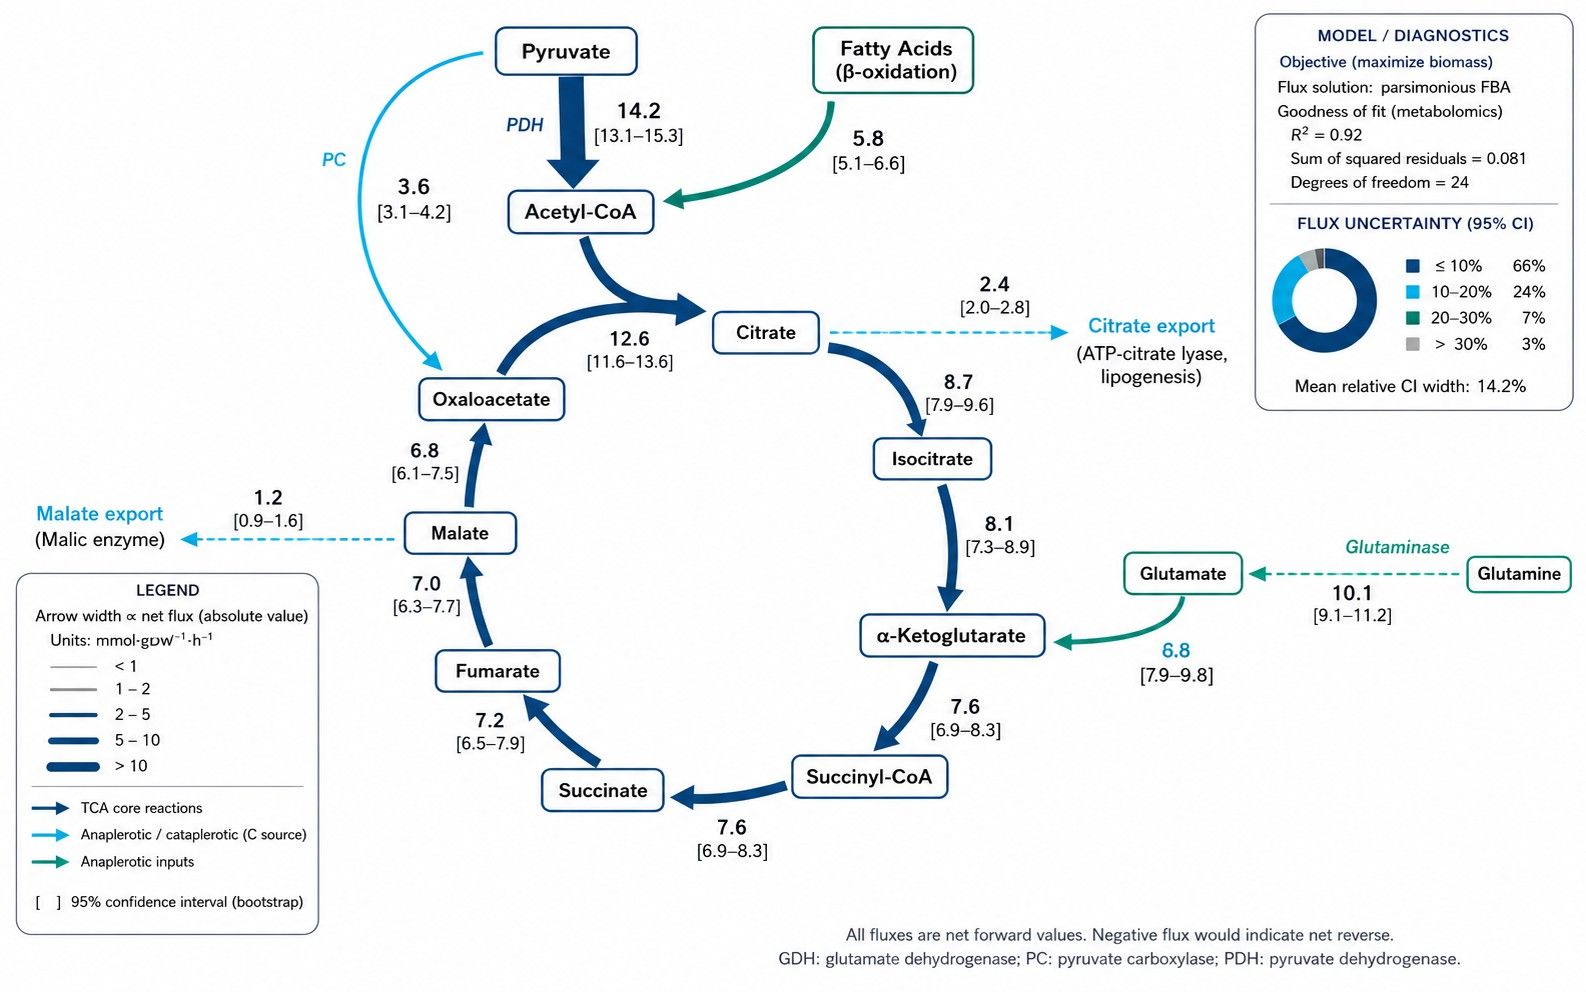
(i) Pyruvate Entry Routing: The stoichiometric split between oxidative decarboxylation via pyruvate dehydrogenase (PDH, yielding M+2 acetyl-CoA) and carboxylation via pyruvate carboxylase (PC, generating M+3 oxaloacetate), linked to our glycolytic pathway metabolic flux analysis.
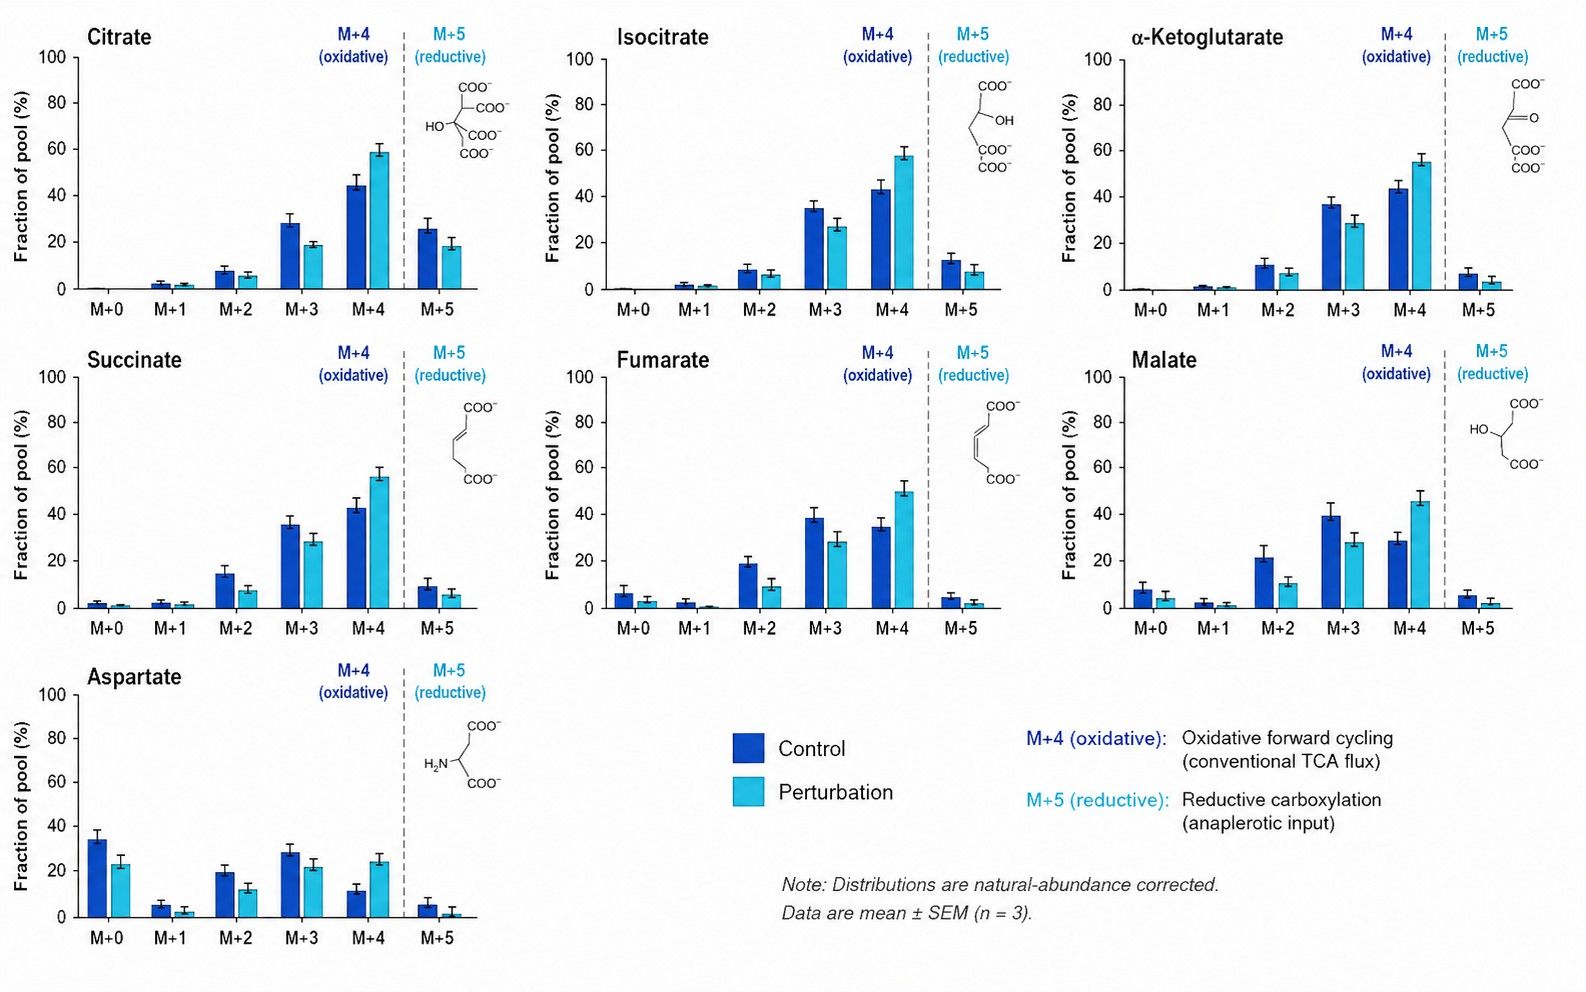
(ii) Oxidative vs. Reductive IDH Flux: Forward oxidative TCA cycling (M+4 intermediates from [U-13C5]glutamine) versus reverse reductive carboxylation (IDH1/2 reduction of α-KG to M+5 citrate) supporting lipogenesis under hypoxia or mitochondrial stress.
(iii) Anaplerotic Capacity & Substrate Choice: Fractional contributions of glutaminolysis (GLS/GDH), branched-chain amino acid catabolism, and fatty acid oxidation fueling the cycle.
(iv) Cataplerotic Efflux & Shunt Pathways: Mitochondrial citrate export via the citrate carrier (CIC/SLC25A1) for ACLY cleavage, malate-aspartate shuttling, and GABA shunt bypasses.
Looking for metabolite concentration measurements? If your research objective is quantifying absolute or relative pool sizes of citric acid cycle intermediates (μmol/g or ng/mL) without stable isotope tracing, please visit our Citrate Cycle Metabolism Service.
Analytical Considerations in Mitochondrial & TCA Cycle Fluxomics
TCA cycle fluxomics requires high analytical fidelity to baseline-separate isobaric isomers and account for mitochondrial compartmentation:
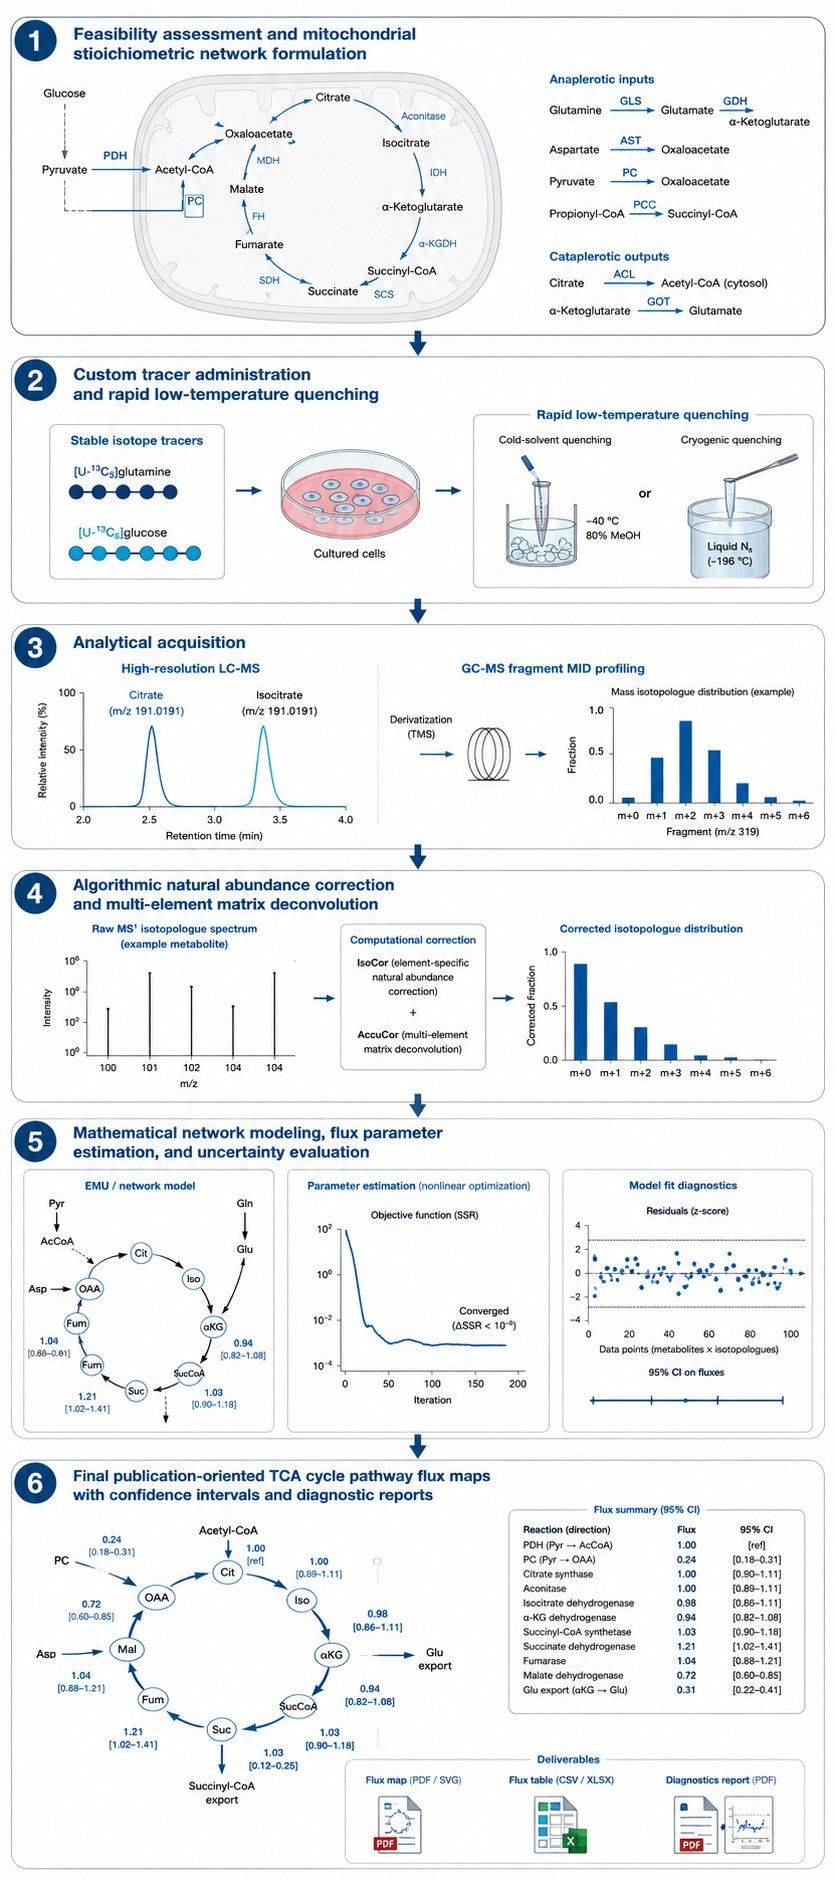
- Baseline Chromatographic Separation of Isomers: Citrate and isocitrate share identical molecular formulas (C6H8O7, m/z 191.0197) and identical mass isotopologue envelopes. Our optimized LC-MS methods achieve baseline chromatographic resolution, preventing spectral overlap.
- Quenching Protocols for Labile Keto Acids: Labile α-keto acids (α-ketoglutarate, oxaloacetate, pyruvate) are prone to non-enzymatic degradation. Rapid low-temperature organic solvent quenching arrests enzymatic interconversion.
- Dual LC-MS & GC-MS Orthogonal Profiling: Non-derivatized LC-MS profiles intact dicarboxylic and tricarboxylic acids, while GC-MS-based metabolic flux analysis using silylation derivatization supplies fragment-specific carbon constraints (e.g. malate [M-57]+ vs. [M-159]+).
- Multi-Element Background Deconvolution: Algorithmic matrix deconvolution (IsoCor / AccuCor) strips natural 13C, 15N, 18O, and silicon isotope background across all target fragment envelopes.
13C & 15N Tracer Selection Matrix for TCA Cycle & Anaplerotic Networks
The choice of isotope tracer dictates which mitochondrial branch points and anaplerotic inputs are mathematically identifiable:
| Tracer Substrate |
Target TCA Cycle Reaction |
Diagnostic MID Readout & Value |
| [U-13C5]Glutamine |
Forward Oxidative TCA Cycling vs. Reductive Carboxylation |
Deaminates to [U-13C5]α-KG (M+5). Forward oxidative cycling produces M+4 succinate, fumarate, malate, and citrate. Reverse reductive carboxylation produces M+5 isocitrate/citrate and M+3 malate/fumarate/aspartate. The M+5/M+4 citrate ratio directly reflects the reductive-to-oxidative flux fraction. |
| [U-13C6]Glucose |
PDH vs. PC anaplerotic entry & Krebs cycle throughput |
Pyruvate (M+3) processed by PDH yields M+2 acetyl-CoA → M+2 citrate, α-KG, and glutamate. Pyruvate processed by PC yields M+3 oxaloacetate → M+3 malate, aspartate, and M+3/M+5 citrate. Quantifies the stoichiometric PDH:PC split ratio. |
| [1-13C]Glutamine |
α-Ketoglutarate dehydrogenase (α-KGDH) net flux |
Labels the C1 carboxyl position of glutamine. Forward oxidation through α-KGDH releases C1 as 13CO2, leaving succinate and downstream intermediates unlabeled (M+0). Reductive carboxylation retains C1 in [1-13C]citrate (M+1). |
| Parallel [U-13C6]Glc + [U-13C5]Gln |
Global mitochondrial carbon economy & substrate fuel choice |
Parallel tracer experiments and joint model fitting resolve the relative fractional contributions of glucose vs. glutamine vs. fatty acids into mitochondrial respiration. |
Technical Capabilities for High-Resolution TCA Cycle Flux Analysis
- Orthogonal Analytical Platforms: Targeted high-resolution LC-MS and GC-MS data acquisition matched to the polarity and fragmentation needs of organic acids and amino acids.
- Isotopic Steady-State and Dynamic Options: Supports isotopic steady-state flux mapping as well as rapid time-course dynamic and INST metabolic flux analysis for evaluating acute mitochondrial perturbations or hypoxia transitions.
- Statistical Identifiability and Uncertainty Analysis: Fitted fluxes are evaluated with goodness-of-fit testing and confidence interval assessments to verify parameter identifiability.
- Complementary Positional Validation: Where stereospecific carbon atom routing requires orthogonal physical verification, studies can incorporate high-field NMR-based metabolic flux analysis.
End-to-End TCA Cycle Pathway MFA Workflow
Sample Preparation & Quenching Guidelines for Mitochondrial TCA MFA
Sample amounts and quenching procedures are finalized during feasibility review based on mitochondrial density and matrix type:
| Sample Type |
Typical Input Guidelines |
Harvesting & Quenching Principles |
Storage & Transport |
| Adherent Cultured Cells |
Typically 1–5 × 10⁶ cells (60 mm dish), confirmed by pilot assessment |
Aspirate tracer medium rapidly, add pre-cooled organic extraction solvent, cell detachment on dry ice/ice. Avoid prolonged washes. |
Store at −80 °C; ship on dry ice |
| Suspension Cultured Cells |
Typically 2–10 × 106 cells, adjusted to cell density |
Short, pre-cooled centrifugation or direct cold solvent quenching, aspirate supernatant, extract pellet immediately in cold solvent. |
Store at −80 °C; ship on dry ice |
| Microbial / Fermentation Pellets |
Biomass volume determined by pilot extraction and target coverage |
Fast filtration or direct quenching into pre-chilled solvent to arrest fast-turnover pools. Retain spent broth for extracellular rates. |
Store at −80 °C; ship on dry ice |
| Plant & Animal Tissue Specimens |
20–50 mg wet weight, depending on metabolic activity |
Instant freeze-clamping or flash freezing in liquid nitrogen upon excision; cryogenic pulverization without intermediate thawing. |
Store at −80 °C; ship on dry ice |
| Conditioned Culture Medium |
≥ 200 μL matched supernatant |
Sample matched culture supernatant across labeling time points; clarify by centrifugation (4 °C) to remove debris. |
Store at −80 °C; ship on dry ice |
Deliverables & Quantitative Datasets from TCA Cycle MFA
- Deconvoluted TCA Cycle MID Matrix: Natural-abundance-corrected fractional labeling (M+0 to M+n) for citrate, isocitrate, cis-aconitate, α-KG, succinate, fumarate, malate, glutamate, and aspartate.
- Extracellular Boundary Fluxes: Quantitative glucose, glutamine, and byproduct secretion rates providing stoichiometric boundaries for flux calculation.
- Mathematical Model Specifications: Reaction network definitions, carbon atom transition mappings, and project configuration files.
- Calculated Reaction Rates & Split Ratios: Net (vnet) and exchange (vxch) fluxes with accompanying sensitivity analysis and confidence intervals.
- Statistical Fit Diagnostics: Sum of squared residuals (SSR), Chi-square goodness-of-fit evaluation, and residual diagnostic plots.
- Publication-Ready Pathway Maps: Vector graphics (PDF/SVG) illustrating TCA cycle carbon routing with flux-scaled arrow widths.
Research Applications of TCA Cycle Pathway Flux Analysis & Anaplerosis
- Oncology & Reductive Carboxylation: Quantify glutamine dependence, IDH1/2 mutational neomorphic activity, and reverse TCA flux supporting lipid synthesis in hypoxic tumors.
- Mitochondrial Dysfunction & Complex II Defects: Measure flux consequences of SDH or FH alterations, succinate/fumarate accumulation, and oncometabolite signaling.
- Immunometabolism & Macrophage Phenotypes: Characterize TCA cycle breaks at isocitrate dehydrogenase and succinate dehydrogenase during immune cell activation.
- Cellular Energetics & Nutrient Adaptation: Track carbon redistribution between glucose and glutamine under nutrient limitation or pharmacological interventions.


 Contact Us



