

Hemolysis in Plasma and Serum Metabolomics: Detection, Metabolite Bias, and Sample Exclusion Rules
Submit Your InquiryHemolysis can make a plasma or serum metabolomics dataset look biologically compelling for the wrong reason. Ruptured erythrocytes release a concentrated intracellular metabolome, enzymes, hemoglobin, membrane lipids, and redox-active components into the extracellular fraction. If hemolysis frequency differs between study groups, principal components, differential metabolites, and pathway enrichment may reflect sample collection rather than disease, treatment, or exposure.
A pink appearance alone is not a sufficient exclusion rule. Hemolysis needs to be measured, classified, and interpreted in relation to the study objective. Ex vivo hemolysis is usually a pre-analytical defect; in vivo hemolysis may be part of the phenotype in sickle cell disease, sepsis, transfusion, mechanical circulatory support, or other conditions. The protocol must separate these mechanisms and establish assay-relevant handling rules before group identities and outcomes are reviewed.
Mechanisms of Hemolysis-Induced Metabolome Distortion
Red blood cells are metabolically active. They depend heavily on glycolysis and the pentose phosphate pathway, maintain glutathione-based redox defenses, exchange amino acids, carry adenine nucleotides, and contain a membrane enriched in specific phospholipid and sphingolipid species. The concentration ratio between erythrocytes and plasma is not constant across metabolites. Even a small erythrocyte contribution can therefore change selected extracellular measurements disproportionately.
Hemolysis affects metabolomics through several mechanisms:
- Direct leakage: intracellular metabolites enter plasma or serum and raise the measured pool.
- Membrane contribution: erythrocyte phospholipids and their breakdown products alter lipid and lysophospholipid profiles.
- Enzymatic conversion: released enzymes continue to consume or produce metabolites after collection until activity is stopped.
- Redox chemistry: free hemoglobin, heme, iron, and altered antioxidant systems can promote oxidation or change redox-sensitive compounds.
- Matrix and ionization effects: the additional protein, heme, and membrane material can alter extraction recovery, chromatography, or electrospray response.
- Spectral interference: free hemoglobin interferes strongly with optical assays used to characterize samples, although LC–MS bias is primarily compositional and matrix driven rather than a simple absorbance artifact.
The direction of bias is metabolite- and workflow-specific. A hemolyzed sample is not merely a uniformly concentrated plasma sample. Some compounds rise through cellular release; others fall through enzymatic consumption, altered binding, or extraction effects. Published human-plasma experiments found that the number of significantly affected metabolites increased with hemolysis severity, while other studies identified amino acids, energy metabolites, purines, lipids, and lysophosphatidylcholines among sensitive readouts. The affected set depends on anticoagulant, serum versus plasma, processing delay, platform, extraction chemistry, and the imposed hemolysis model.
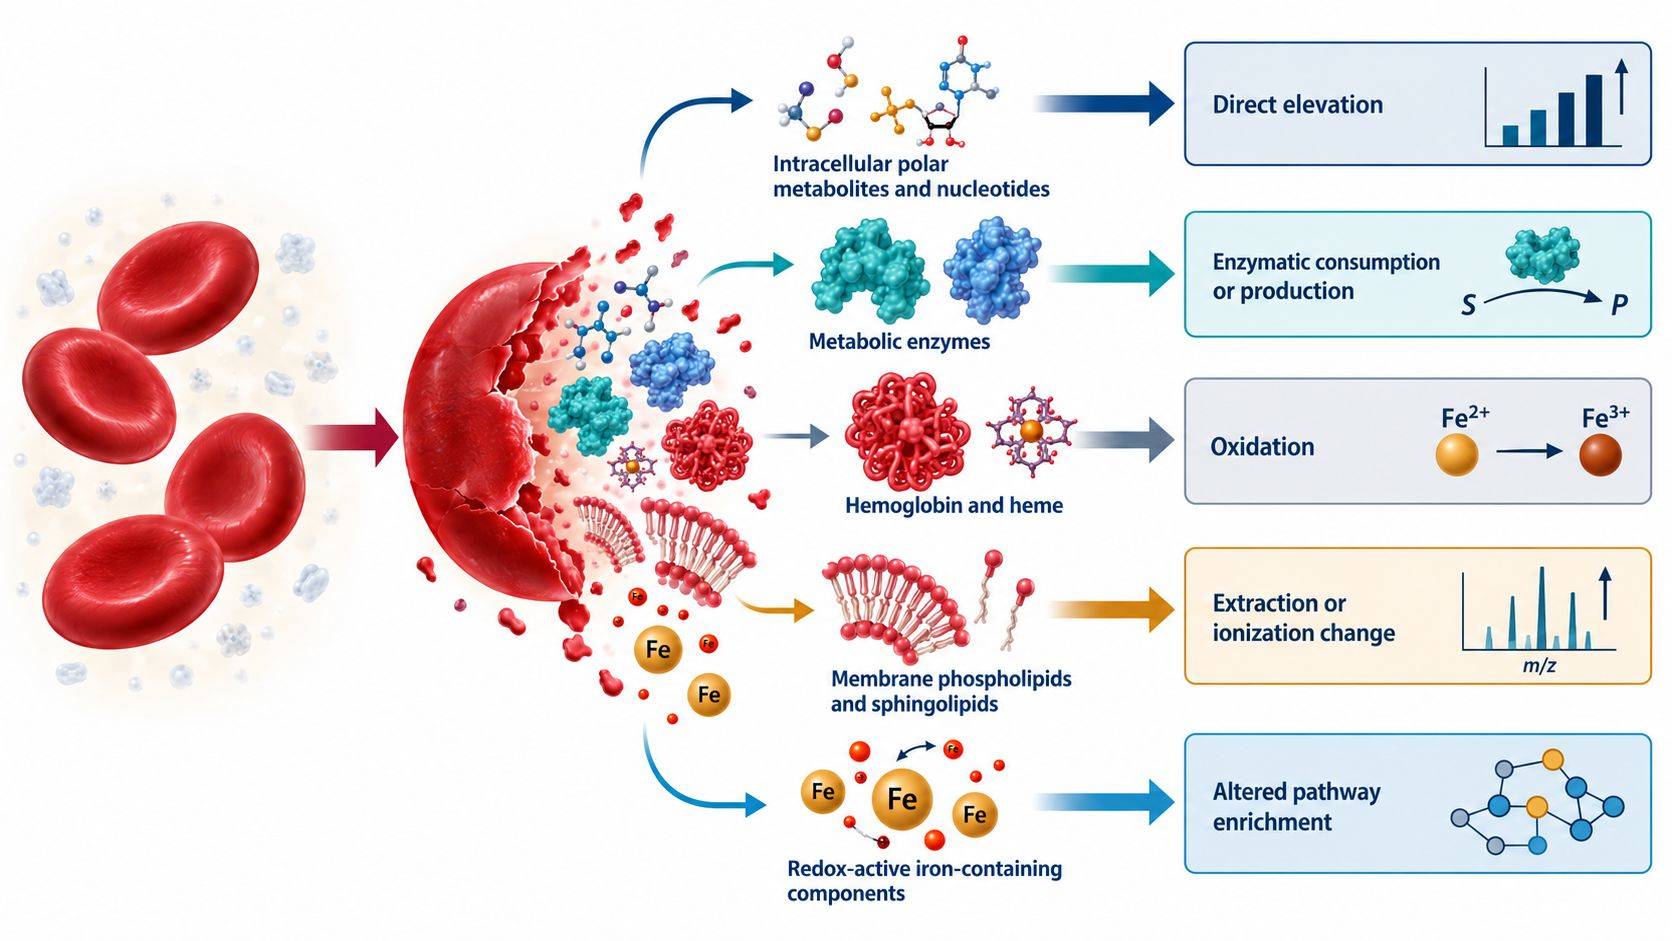 Figure 1. Hemolysis changes plasma and serum metabolomics through direct cellular leakage, membrane-lipid release, ongoing enzymatic conversion, redox chemistry, and matrix effects. The result is analyte-specific rather than a uniform shift in sample concentration.
Ex Vivo and In Vivo Hemolysis Classification
Ex vivo and in vivo hemolysis can produce overlapping analytical signals but require different decisions.
Ex Vivo Hemolysis
Ex vivo hemolysis occurs during or after collection. Common causes include traumatic venipuncture, a needle bore that is too small for the collection procedure, strong aspiration through a syringe, prolonged tourniquet use, incomplete drying of an alcohol-cleaned site, vigorous tube shaking, transport vibration, inappropriate temperature, delayed separation, and contact with hypotonic solutions. It is a sample-quality problem because it introduces variation unrelated to the intended biology.
If a replacement sample can be collected under the same study conditions, recollection is generally preferable to mathematical correction. Corrective formulas derived from spiking or population averages assume a stable relationship between free hemoglobin and each analyte, yet that relationship can vary with baseline concentration, storage, matrix, and platform.
In Vivo Hemolysis
Intravascular hemolysis occurs within the participant and may be biologically central. Excluding all samples with elevated cell-free hemoglobin can selectively remove patients with more severe disease or a treatment-related response. In these settings, hemolysis is not only interference; it may be an exposure, mediator, phenotype, or clinical covariate.
Distinguishing the mechanisms may require collection records, repeat specimens, clinical chemistry, blood counts, haptoglobin, lactate dehydrogenase, bilirubin, reticulocytes, or disease-specific evidence. The hemolysis index alone measures cell-free hemoglobin in the specimen; it does not establish when or why erythrocytes ruptured.
Matrix-Specific Effects in Serum and Plasma
Serum formation includes clotting, platelet activation, and cellular contact before separation. Plasma contains anticoagulant and can generally be separated without waiting for clot formation. These matrices have systematically different metabolite concentrations even when collected from the same participant. A hemolysis rule developed in EDTA plasma should not be transferred automatically to serum, lithium-heparin plasma, or citrate plasma.
The study should use one matrix and collection-tube type wherever possible. If legacy samples require multiple matrices, matrix must be represented across biological groups and included in the analysis; a conversion factor cannot reliably harmonize the entire metabolome.
Objective Hemolysis Detection and Severity Grading
Visual inspection is useful for recognizing gross hemolysis, but it is observer-dependent, insensitive at low cell-free hemoglobin concentrations, and compromised by icterus or lipemia. A sample can contain biologically important erythrocyte contamination before it appears red. Objective measurement should accompany visual assessment when hemolysis could affect study conclusions.
Hemolysis Index and Cell-Free Hemoglobin
Automated clinical chemistry analyzers estimate a hemolysis index from spectrophotometric absorbance associated with free hemoglobin. Direct cell-free hemoglobin measurement can also be used. Hemolysis-index scales are instrument dependent; the same numerical label does not necessarily represent the same concentration across analyzers. The protocol should retain the raw or converted cell-free hemoglobin value, analyzer, wavelength method, units, and time of measurement.
There is no universal metabolomics rejection threshold. Clinical chemistry cutoffs are analyte-specific and designed around allowable error for individual clinical tests. Untargeted metabolomics measures many compounds with different susceptibility, so a threshold suitable for potassium or lactate dehydrogenase reporting cannot define the quality of an entire LC–MS feature matrix. Current evidence remains insufficient to recommend one free-hemoglobin standard for all blood metabolomics studies.
Metabolomic Hemolysis Signatures
The metabolomics data can provide complementary evidence. Candidate indicators include compounds abundant in erythrocytes, coordinated shifts in erythrocyte-associated lipids, and correlation of features with measured cell-free hemoglobin. These signals should be validated in the relevant matrix and method rather than treated as universally specific.
Useful evaluation steps include:
- measure hemolysis before metabolomics analysis where sufficient sample is available;
- inspect sample color under standardized conditions and record the assessment;
- examine whether hemolysis severity is balanced across study groups, sites, collectors, and processing batches;
- model feature abundance against the continuous hemolysis measure while accounting for group and other covariates;
- compare observed feature directions with a matrix-matched experimental hemolysis series where possible;
- flag features strongly associated with hemolysis for restricted interpretation or targeted confirmation.
An experimental series can be created by adding graded amounts of matched erythrocyte lysate to non-hemolyzed plasma or serum. This defines method-specific response curves but does not reproduce every aspect of natural hemolysis, including time-dependent enzymatic conversion or in vivo pathology. It should inform, not replace, real-sample QC.
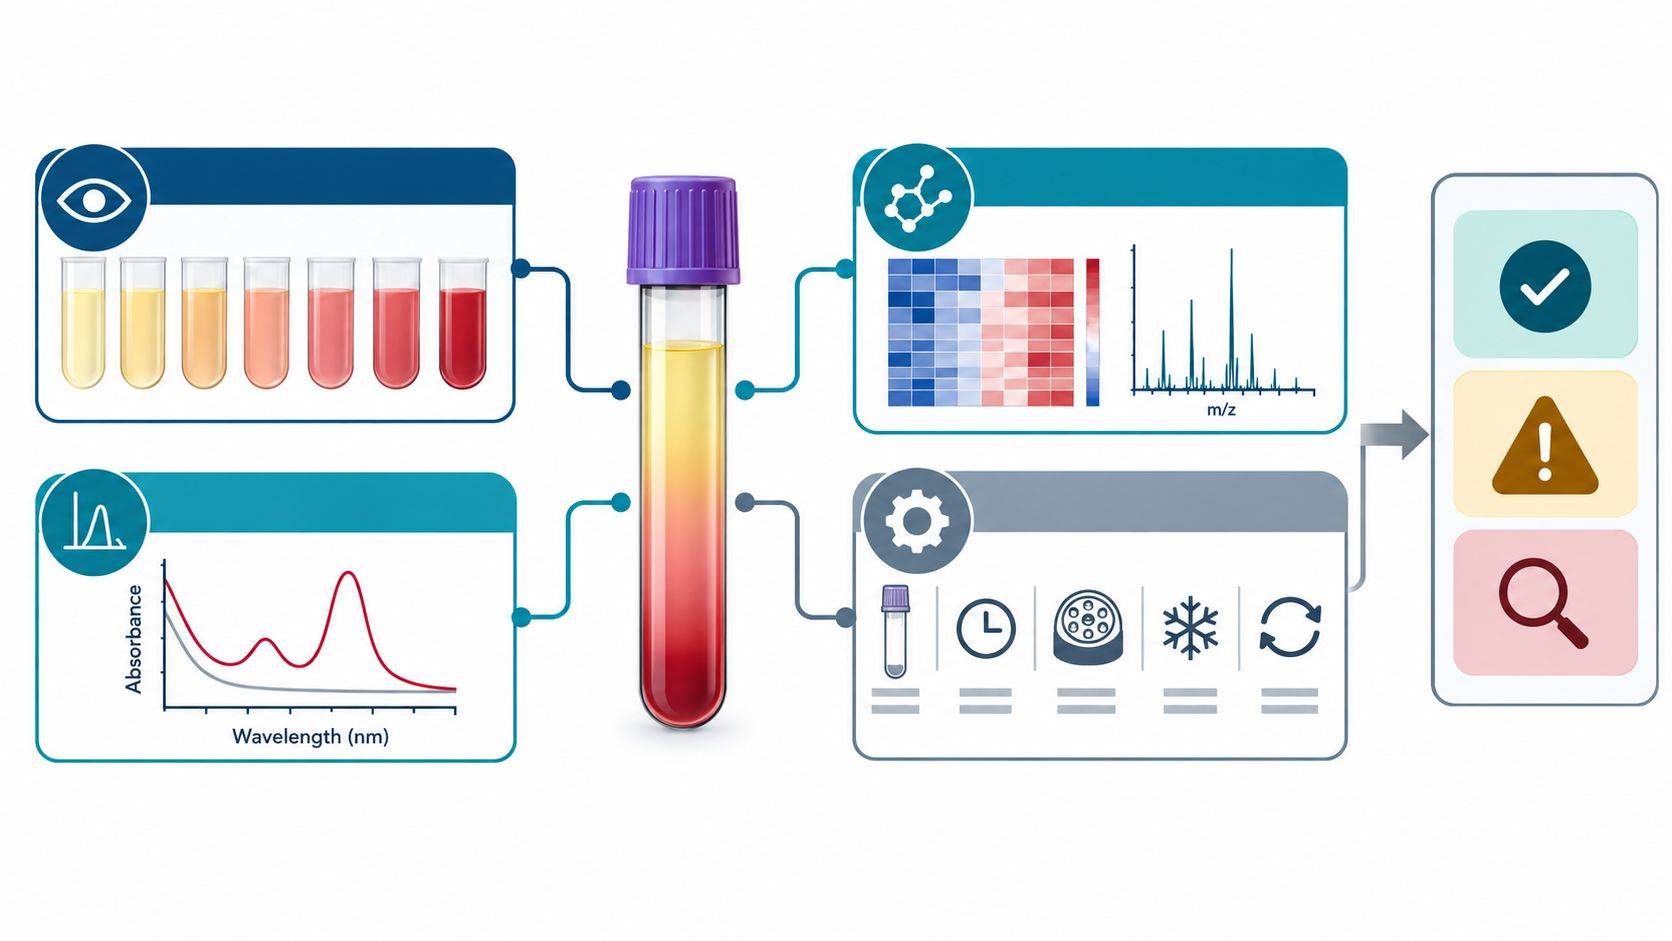 Figure 2. Hemolysis assessment should combine objective specimen measurements with metabolomics patterns and collection metadata. No single visual grade, surrogate metabolite, or instrument-specific index is sufficient for all matrices and analytical methods.
Global, Feature-Level, and Pathway-Level Bias
Hemolysis can become a dominant latent variable. Before interpreting group separation, evaluate its relationship with global data structure and individual features.
Global Effects
Plot measured hemolysis against principal-component scores, total detected features, missingness, total signal, and internal-standard behavior. Strong alignment of a principal component with hemolysis suggests that sample quality contributes materially to the dataset. This is especially concerning when the affected component also separates cases and controls.
Clustering by hemolysis does not prove that all group differences are artifacts. Conversely, the absence of visible PCA separation does not prove that every metabolite is unaffected. PCA emphasizes directions of largest variance; clinically important bias in a smaller metabolite subset can remain hidden.
Feature-Level Effects
For each analyte or feature, estimate the association with a continuous hemolysis measure and examine nonlinearity. The metabolomics data analysis model should retain the primary biological group and relevant collection variables rather than screening hemolysis in isolation. Features may be classified as:
- insensitive within the observed hemolysis range;
- monotonically associated with hemolysis;
- affected only above a severity range;
- matrix- or batch-dependent;
- uncertain because hemolysis and phenotype are strongly confounded.
The classification should consider analytical precision and the effect magnitude, not only statistical significance. In a large cohort, a small hemolysis-associated change can reach a low p-value without being materially important. In a small cohort, a large bias may remain statistically uncertain.
Pathway-Level Distortion
Erythrocyte release can create coherent signals in glycolysis, purine metabolism, amino acid metabolism, glutathione and redox pathways, and membrane-lipid remodeling. Pathway enrichment can therefore amplify a pre-analytical pattern into a persuasive mechanistic narrative. Hemolysis-sensitive features should be marked before enrichment, and pathway results should be recomputed after their removal or adjustment.
Sample Disposition and Sensitivity-Analysis Criteria
Sample handling should be determined by study purpose and evidence, not by whether removal improves the result. A practical framework uses several actions rather than one threshold.
| Sample situation | Primary action | Analysis consequence | Rationale |
|---|---|---|---|
| Gross ex vivo hemolysis with recollection possible | Recollect before analysis | Replace specimen under matched conditions | Prevents avoidable contamination without post hoc correction |
| Gross ex vivo hemolysis with no replacement | Exclude from primary analysis if prespecified; retain in audit trail | Report number, group distribution, and reason | Severe contamination can affect many analytes and matrix properties |
| Mild or moderate hemolysis balanced across groups | Retain with flag and continuous hemolysis value | Run primary model plus exclusion or adjustment sensitivity analysis | Preserves sample size while testing robustness |
| Hemolysis severity differs by group or site | Investigate collection process and confounding | Do not rely on simple covariate adjustment alone | Biological group may be inseparable from sample quality |
| In vivo hemolysis is part of disease biology | Retain and characterize | Treat hemolysis as phenotype, mediator, or covariate according to the causal question | Blanket exclusion can bias the cohort toward milder disease |
| Candidate biomarker correlates with hemolysis | Restrict claim pending confirmation | Test in low-hemolysis samples and an independent cohort; consider a targeted assay | Candidate may be an erythrocyte contamination marker rather than disease marker |
Primary Analysis Population
The protocol should specify the primary analysis set before outcome review. For example, the discovery analysis may exclude gross ex vivo hemolysis but retain mild cases with a measured hemolysis covariate. A confirmatory targeted metabolomics analysis can apply stricter, analyte-specific acceptance limits supported by method validation or a study-specific contamination series.
Robustness and Sensitivity Analyses
The analysis plan needs more than one treatment of the affected samples. At minimum, compare:
- the prespecified primary dataset;
- a restricted dataset excluding samples above a lower hemolysis grade;
- a model including continuous hemolysis and relevant collection covariates;
- a feature set excluding analytes strongly associated with hemolysis;
- subgroup analyses for matrix, site, or disease states when justified.
A conclusion is more credible when effect direction and interpretation persist across reasonable analyses. If a pathway disappears only after hemolysis-sensitive features are removed, the appropriate conclusion is uncertainty, not proof that statistical correction has isolated the true biology.
Limitations of Imputation and Mathematical Correction
Replacing hemolysis-sensitive values with cohort medians, subtracting a universal erythrocyte contribution, or applying an unvalidated correction formula can distort covariance and underestimate uncertainty. Imputation addresses missingness; it does not reverse sample contamination. When an affected analyte cannot support interpretation, flagging or censoring the analyte may be more defensible than generating a corrected concentration.
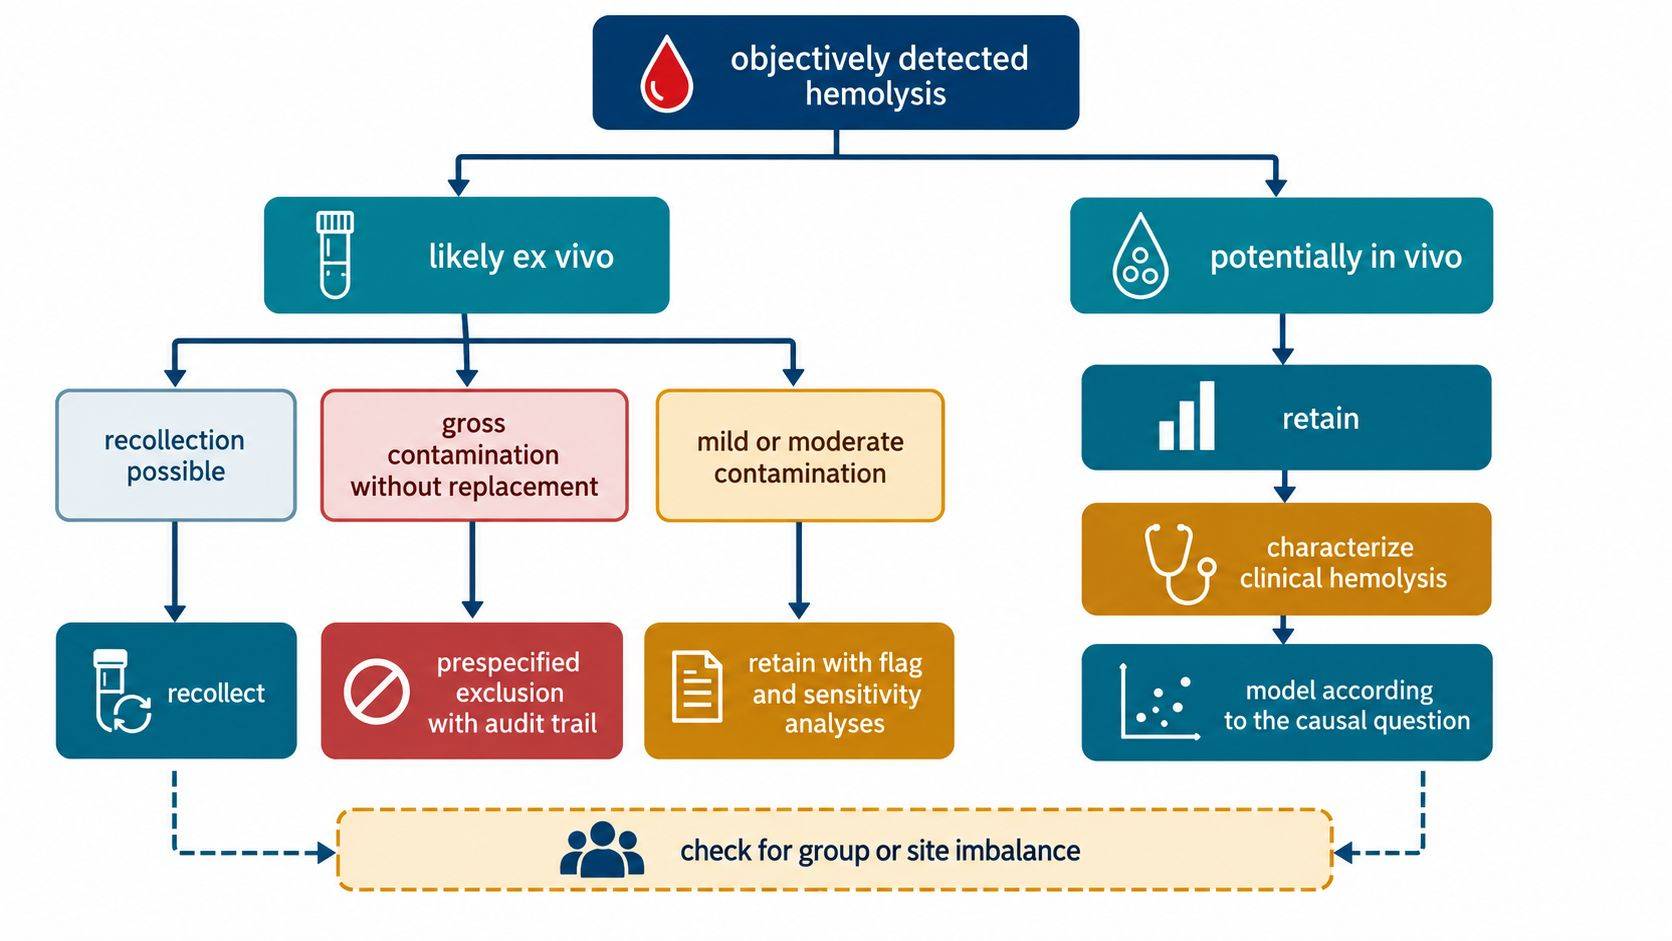 Figure 3. Hemolysis management depends on mechanism, severity, replacement feasibility, group balance, and study purpose. Ex vivo defects favor recollection or prespecified exclusion, whereas biologically relevant in vivo hemolysis requires characterization rather than automatic removal.
Pre-analytical Prevention and Specimen Traceability
Prevention begins with a harmonized collection protocol and trained personnel. Recommended controls include an appropriate needle and collection system, gentle inversion rather than shaking, complete tube filling where anticoagulant ratio matters, controlled transport, prompt processing, and defined centrifugation and aliquoting procedures. Samples should not be frozen before cellular separation unless the protocol explicitly requires whole blood.
For each specimen, retain:
- tube type, lot if relevant, collector, site, and collection time;
- needle or line collection information where available;
- tourniquet and difficult-draw indicators;
- time and temperature to centrifugation;
- centrifugation conditions and whether a second spin was used;
- visible hemolysis, lipemia, and icterus assessment;
- hemolysis index or cell-free hemoglobin result with units and platform;
- aliquot and freeze–thaw history;
- final disposition: accepted, flagged, excluded, or recollected.
Group-level reporting should include the distribution of hemolysis measurements and exclusions, not merely a statement that “hemolyzed samples were removed.” This permits reviewers to assess whether exclusion introduced differential attrition. Raw sample-quality variables should remain linked to the metabolomics data so later biomarker validation can test susceptibility directly.
Frequently Asked Questions (FAQs)
Can a slightly pink plasma sample still be used for metabolomics?
Possibly, but color alone is not a sufficient decision rule. Measure or estimate cell-free hemoglobin, examine whether hemolysis is balanced across groups, and apply the prespecified study-specific rule. Mild hemolysis may be retained with flags and sensitivity analyses when the primary metabolites are insensitive within the observed range.
What metabolite can be used as a universal hemolysis marker?
No single metabolite is universally specific across serum, plasma types, platforms, and diseases. Erythrocyte-enriched metabolites and lipid patterns can support QC, but they may also change biologically. An objective hemolysis index or cell-free hemoglobin measurement combined with a validated multi-feature signature is more defensible.
Should all hemolyzed samples be excluded from a biomarker-discovery study?
Not automatically. Gross ex vivo hemolysis may justify exclusion, particularly when recollection is impossible and broad contamination is evident. Mild cases should be evaluated for balance and influence. If hemolysis is part of the disease phenotype, blanket exclusion may remove the most relevant patients and bias the discovery cohort.
Can hemolysis be corrected statistically by adding the hemolysis index as a covariate?
Covariate adjustment can reduce some linear association, but it cannot guarantee recovery of the uncontaminated concentration. It is inadequate when hemolysis is strongly confounded with group, has nonlinear or analyte-specific effects, or changes matrix behavior. Adjustment should be accompanied by sample- and feature-restriction sensitivity analyses.
Is serum more susceptible to hemolysis than plasma?
Both matrices can be hemolyzed. Serum additionally undergoes clotting and delayed separation, which changes cellular and platelet contributions. The practical susceptibility depends on collection and processing. Serum and plasma should be treated as distinct matrices, and quality rules should be validated for the selected tube and workflow.
Does normal internal-standard performance prove that hemolysis had no effect?
No. Internal standards primarily monitor extraction, injection, and ionization for compounds with similar chemistry. They do not detect every biological contribution from erythrocyte contents or ongoing enzyme activity. Acceptable internal-standard response can coexist with substantial analyte-specific hemolysis bias.
References
- Kamlage, B., et al. (2014). Quality markers addressing preanalytical variations of blood and plasma processing identified by broad and targeted metabolite profiling. Clinical Chemistry, 60(2), 399–412. doi:10.1373/clinchem.2013.211979
- Stevens, V. L., et al. (2019). Pre-analytical factors that affect metabolite stability in human urine, plasma, and serum: a review. Metabolites, 9(8), 156. doi:10.3390/metabo9080156
- Lehmann, R. (2021). From bedside to bench—practical considerations to avoid pre-analytical pitfalls and assess sample quality for high-resolution metabolomics and lipidomics analyses of body fluids. Analytical and Bioanalytical Chemistry, 413, 5567–5585. doi:10.1007/s00216-021-03450-0
- Stringer, K. A., et al. (2015). Whole blood reveals more metabolic detail of the human metabolome than serum as measured by 1H-NMR spectroscopy: implications for sepsis metabolomics. Shock, 44(3), 200–208. doi:10.1097/SHK.0000000000000406
- Theil, P. K., Pedersen, L. J., Jensen, M. B., Yde, C. C., & Bach Knudsen, K. E. (2012). Blood sampling and hemolysis affect concentration of plasma metabolites. Journal of Animal Science, 90(Suppl 4), 412–414. doi:10.2527/jas.53968
- Geyer, P. E., et al. (2019). Plasma proteome profiling to assess human health and disease. Cell Systems, 8(6), 491–504.e8. doi:10.1016/j.cels.2019.04.015
- Lippi, G., et al. (2018). Practical recommendations for managing hemolyzed samples in clinical chemistry testing. Clinical Chemistry and Laboratory Medicine, 56(5), 718–727. doi:10.1515/cclm-2017-1104
- Bervoets, L., et al. (2015). Influence of preanalytical sampling conditions on the 1H NMR metabolic profile of human blood plasma and introduction of the Standard PREanalytical Code used in biobanking. Metabolomics, 11, 1197–1207. doi:10.1007/s11306-015-0776-2
- Searfoss, R., Shah, P., Ofori-Mensa, K., et al. (2022). Impact of hemolysis on multi-OMIC pancreatic biomarker discovery to derisk biomarker development in precision medicine studies. Scientific Reports, 12, 1186. doi:10.1038/s41598-022-05152-8
- Thachil, A., Wang, L., Mandal, R., Wishart, D., & Blydt-Hansen, T. (2024). An overview of pre-analytical factors impacting metabolomics analyses of blood samples. Metabolites, 14(9), 474. doi:10.3390/metabo14090474

 Contact Us


