Fatty Acid Metabolic Flux Analysis — Resolving Dynamic Lipid Remodeling
Fatty acid metabolism balances energy generation via mitochondrial β-oxidation with membrane biogenesis and signaling through de novo lipogenesis (DNL), chain elongation, and desaturation. However, measuring static concentrations of free fatty acids (FFAs), triglycerides, or acyl-carnitines cannot distinguish whether lipid accumulation stems from accelerated synthesis, elevated uptake, or impaired mitochondrial oxidation.
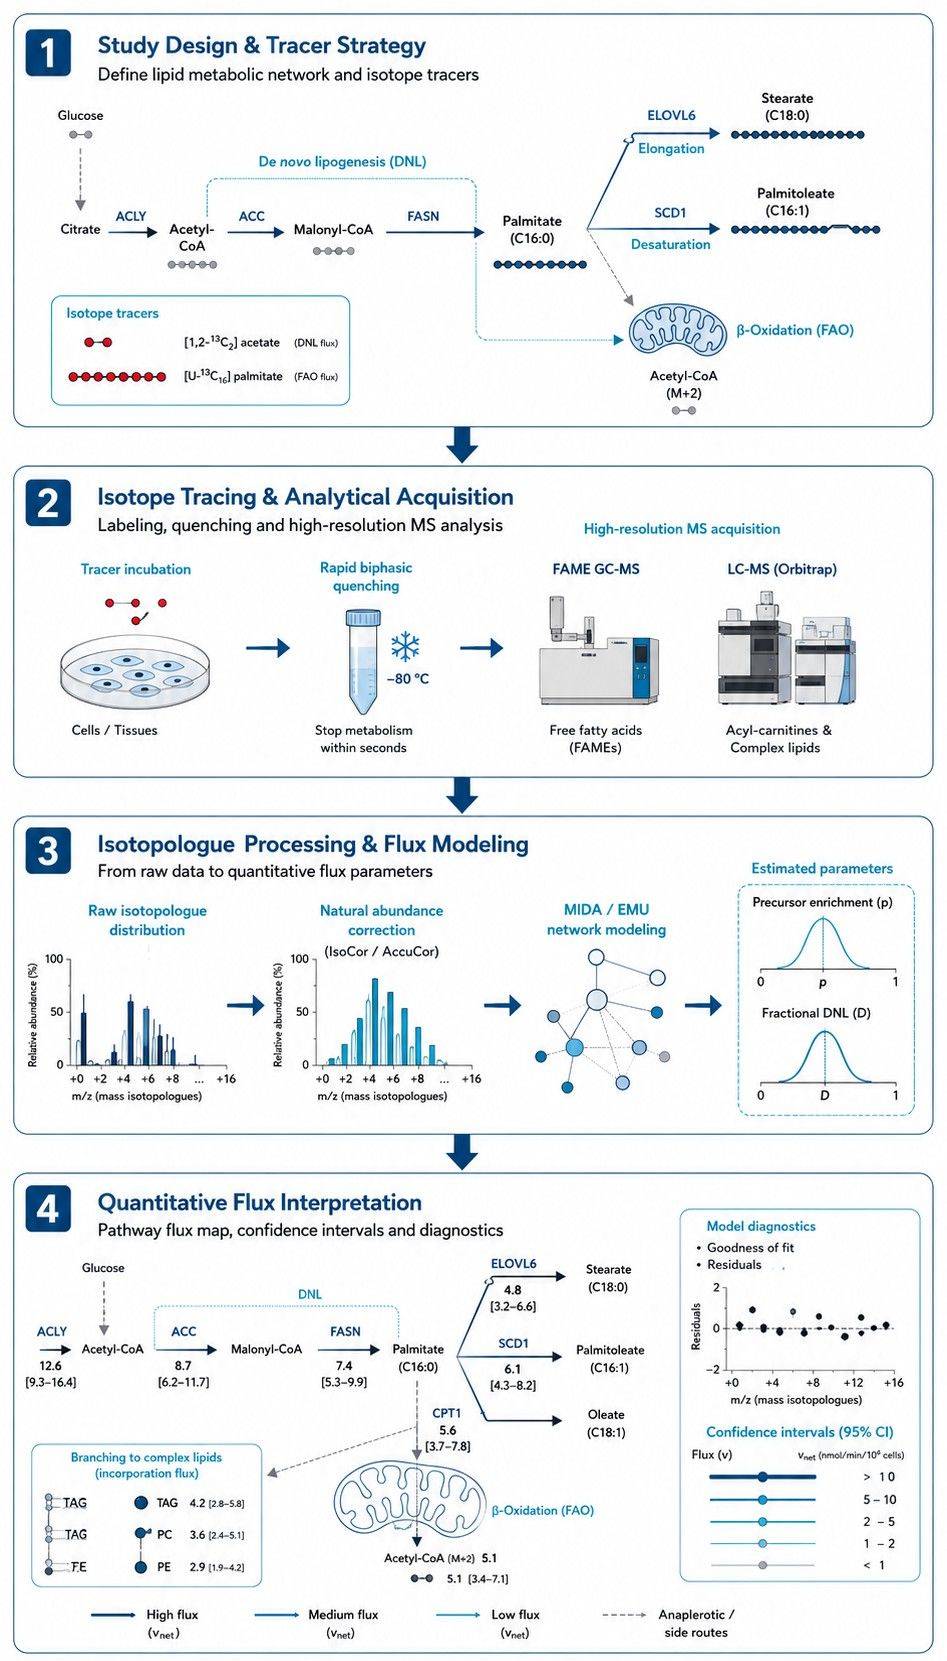
As a specialized pathway Spoke within our central carbon metabolic flux analysis and broader metabolic flux analysis service, Fatty Acid MFA tracks stable carbon isotopes (13C) to model reaction velocities across critical lipid decision nodes:
(i) De Novo Lipogenesis (DNL): Palmitate (C16:0) synthesis from cytosolic acetyl-CoA derived from glucose (ACLY) or acetate (ACSS2), utilizing Mass Isotopomer Distribution Analysis (MIDA) to determine precursor enrichment (p) and fractional synthesis (D).
(ii) Elongation & Desaturation Cascade: Sequential flux partitioning into palmitoleate (C16:1 via SCD1), stearate (C18:0 via ELOVL6), and oleate (C18:1 via SCD1), distinguishing de novo elongated fatty acids from direct uptake.
(iii) Mitochondrial β-Oxidation (FAO): Absolute rates of fatty acid entry through carnitine palmitoyltransferase 1 (CPT1) and cyclic cleavage yielding [1,2-13C2]acetyl-CoA feeding the TCA cycle or ketogenesis.
(iv) Substrate Competition & Fuel Switching: The dynamic balance between glucose and fatty acid oxidation (the Randle cycle) under nutritional or pharmacological modulation.
Looking for fatty acid concentration measurements? If your research focuses on quantifying absolute or relative pool sizes (μmol/g, μg/mL, or chain-length percentages) of free fatty acids or lipid classes without stable isotope tracing, please explore our Fatty Acids Analysis Service.
Analytical Considerations in Fatty Acid & Complex Lipid Fluxomics
Lipid fluxomics requires rigorous separation of chain-length isomers, esterified lipid classes, and polar acyl intermediates:
- Fraction-Specific Lipid Extraction: Quantitative recovery of total lipids using optimized biphasic solvent systems (e.g. Folch or Matyash methods), followed by solid-phase extraction (SPE) separation of neutral lipids, phospholipids, and free fatty acids.
- High-Resolution FAME GC-MS Profiling: Transesterification to fatty acid methyl esters (FAME) coupled with electron ionization (EI) GC-MS provides baseline chromatographic separation across C12:0 to C24:1 species and precise mass isotopologue envelope acquisition.
- Intact Acyl-CoA & Acyl-Carnitine LC-MS: Targeted reversed-phase and HILIC liquid chromatography-mass spectrometry captures intact polar lipid intermediates (acetyl-CoA, malonyl-CoA, palmitoyl-carnitine) to evaluate transport and activation bottlenecks.
- Multi-Element Background Correction: Algorithmic matrix deconvolution (IsoCor / AccuCor) mathematically corrects raw isotopologue spectra for natural 13C, 2H, 18O, and derivatization reagent backgrounds.
13C Tracer Selection Matrix for De Novo Lipogenesis (DNL) & Beta-Oxidation
The choice of isotope tracer dictates which lipid metabolic pathways and turnover nodes can be mathematically resolved:
| Tracer Substrate |
Target Lipid Pathway Node |
Diagnostic Labeling Information & Readout |
| [U-13C6]Glucose |
Glucose-driven De Novo Lipogenesis (DNL) & Glycerol Backbone Labeling |
Glycolysis produces [U-13C3]pyruvate, which enters the TCA cycle to form citrate and is exported for ACLY cleavage into [1,2-13C2]acetyl-CoA. Generates M+2, M+4, M+6 ... M+16 palmitate isotopologues, while [U-13C3]DHAP simultaneously labels the glycerol backbone (M+3) of triacylglycerols. |
| [1,2-13C2]Acetate |
Direct Cytosolic Acetyl-CoA Pool Labeling & MIDA Synthesis |
Directly activated by ACSS2 into [1,2-13C2]acetyl-CoA, bypassing glycolysis and mitochondrial citrate export. Serves as the gold-standard tracer for Mass Isotopomer Distribution Analysis (MIDA) to determine fractional synthesis rates (FSR) with high sensitivity. |
| [U-13C16]Palmitate |
Mitochondrial & Peroxisomal β-Oxidation (FAO) Velocity |
Exogenous [U-13C16]palmitate undergoes successive 2-carbon spiral cleavage, releasing [1,2-13C2]acetyl-CoA. Entry into the TCA cycle generates M+2 citrate, α-ketoglutarate, and malate, directly quantifying absolute β-oxidation throughput. |
| [1-13C]Palmitate |
First-Cycle β-Oxidation & Rate-Limiting Decarboxylation |
Specifically labels the carboxyl-1 position. The initial cycle of β-oxidation releases C1 as 13CO2, enabling sensitive distinction between the first oxidation round and complete chain degradation. |
| Parallel Tracer Regimes |
Integrated Synthesis vs. Oxidation Balance (Lipid Flux Balance) |
Parallel incubation with [1,2-13C2]acetate (measuring DNL) and [U-13C16]palmitate (measuring FAO) in matching cohorts resolves net lipid accumulation or clearance dynamics under dietary or drug interventions. |
Technical Capabilities for MIDA-Based Fatty Acid Flux Analysis
- MIDA Precursor Enrichment Modeling: Mathematical Mass Isotopomer Distribution Analysis deconvolutes repeating 2-carbon subunit condensation, calculating true precursor pool enrichment (p) independent of unlabeled intracellular dilution.
- Sub-Cellular Compartmental Distinction: Resolves cytosolic de novo synthesis from mitochondrial chain elongation and peroxisomal shortening via position-specific isotopologue signature deconvolution.
- Isotopic Steady-State and Dynamic Kinetic Sampling: Supports steady-state fractional contribution studies as well as time-course dynamic and INST metabolic flux analysis to evaluate acute pharmacological CPT1 inhibition or FASN modulation.
- Complementary High-Field NMR Verification: Orthogonal verification of positional carbon enrichment in complex lipid extracts via NMR-based metabolic flux analysis.
End-to-End Fatty Acid MFA Workflow & Analytical Pipeline
Sample Preparation & Extraction Guidelines for Fatty Acid MFA
Sample amounts and extraction protocols are finalized during feasibility review based on target lipid abundance and matrix type:
| Sample Type |
Typical Input Guidelines |
Harvesting & Quenching Principles |
Storage & Transport |
| Adherent Cultured Cells |
Typically 2–10 × 106 cells (100 mm dish or two 60 mm dishes) |
Rapidly aspirate tracer medium, rinse with cold saline, add pre-chilled organic extraction solvent, scrape on ice. Avoid warm PBS washes. |
Store at −80 °C; ship on dry ice |
| Suspension Cultured Cells |
Typically 5–15 × 106 cells, adjusted to lipid density |
Short, pre-cooled centrifugation (4 °C), aspirate supernatant, extract cell pellet immediately in cold organic solvent. |
Store at −80 °C; ship on dry ice |
| Animal Liver & Adipose Tissues |
20–50 mg wet weight (liver/muscle) or 10–30 mg (adipose) |
Instant freeze-clamping or flash freezing in liquid nitrogen immediately upon collection; cryo-pulverize without intermediate thawing. |
Store at −80 °C; ship on dry ice |
| Blood Plasma / Serum |
≥ 100 μL matched plasma or serum |
Collect blood into EDTA/heparin tubes, centrifuge immediately (4 °C, 2,000 × g, 10 min), aliquot and freeze immediately. |
Store at −80 °C; ship on dry ice |
| Conditioned Culture Medium |
≥ 500 μL matched supernatant |
Sample matched medium across labeling time points to quantify extracellular fatty acid consumption and ketone body secretion. |
Store at −80 °C; ship on dry ice |
Deliverables & Quantitative Reporting from Fatty Acid MFA
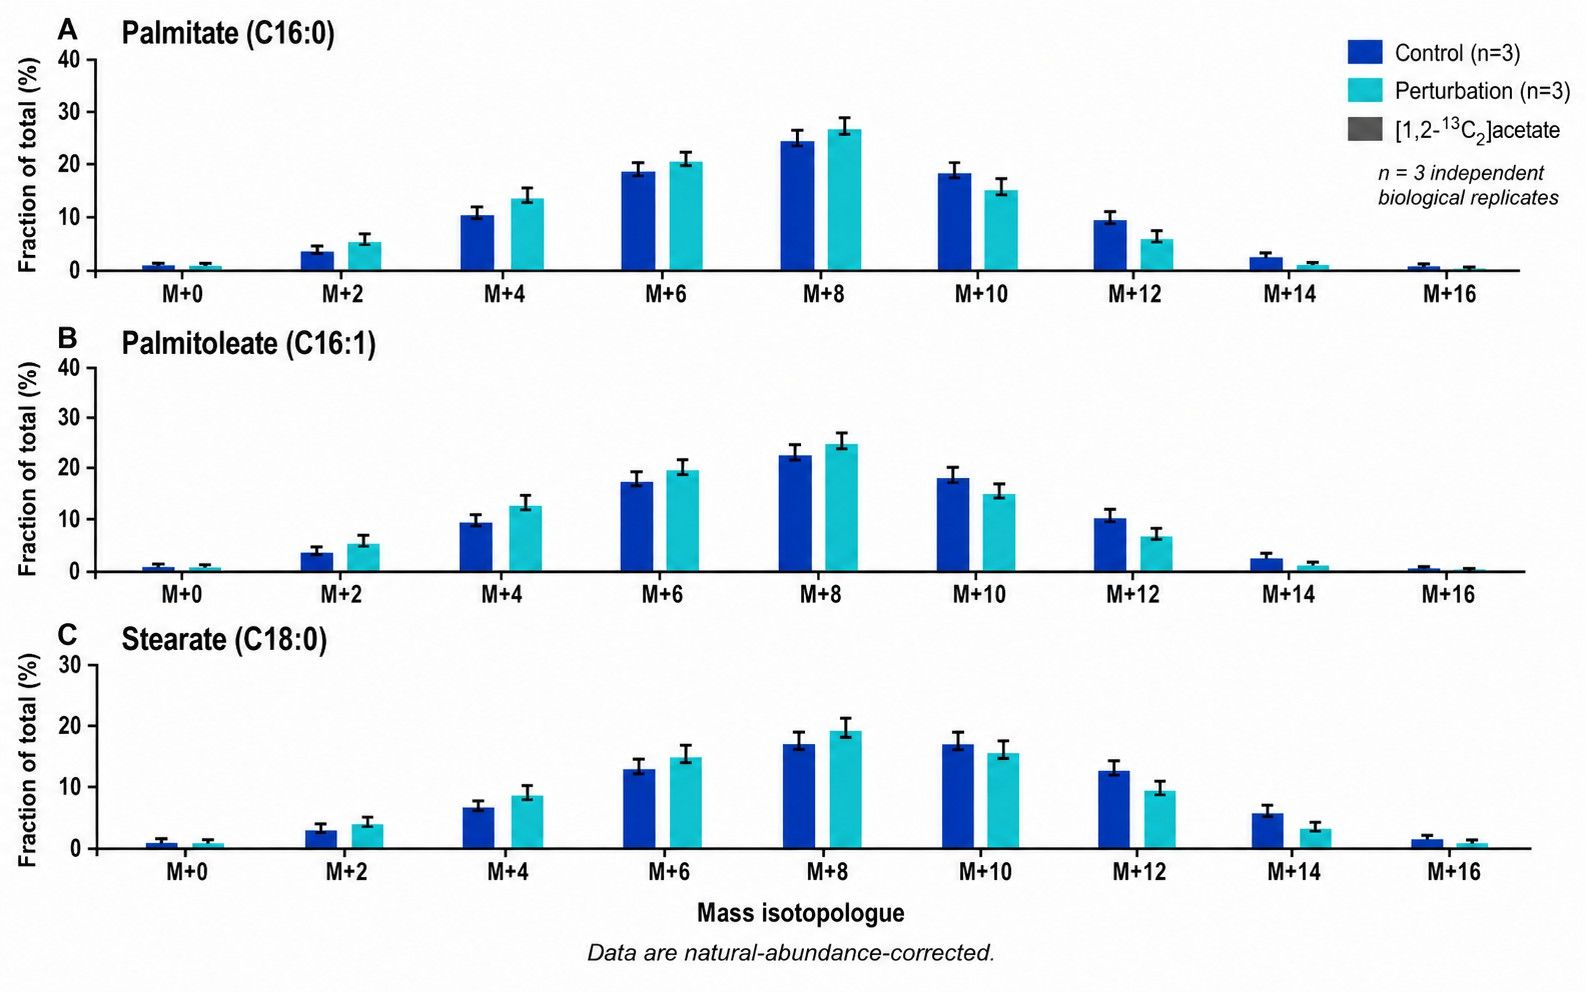
- Deconvoluted Fatty Acid MID Matrix: Natural-abundance-corrected fractional labeling (M+0 to M+n) across free and esterified fatty acids (C14:0, C16:0, C16:1, C18:0, C18:1, C18:2, C20:4, etc.).
- Precursor Pool Enrichment (p) & Fractional DNL (D): MIDA-calculated cytosolic acetyl-CoA enrichment and percentage of newly synthesized lipid pools.
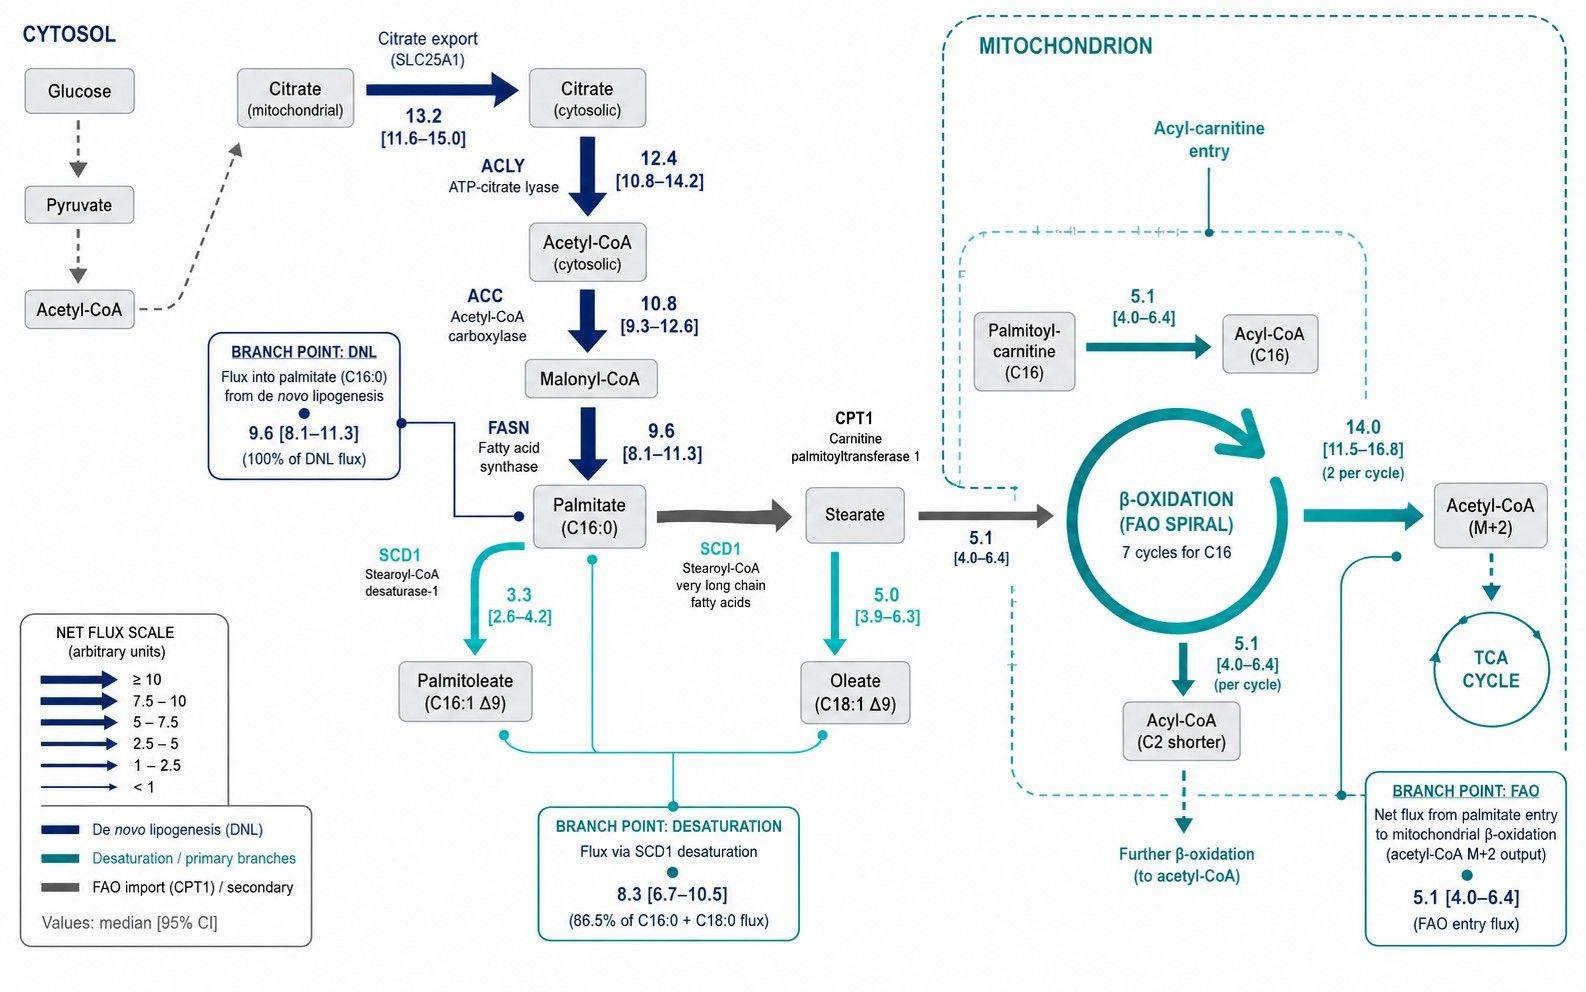
- Elongation & Desaturation Flux Indices: Calculated flux rates for ELOVL and SCD1/FADS desaturases relative to basal uptake.
- Quantitative β-Oxidation Rates: Rate of fatty acid-derived acetyl-CoA entry into the TCA cycle and rate of ketone body generation.
- Model Specifications & Statistical Diagnostics: Mathematical equations, parameter sensitivity analysis, and residual goodness-of-fit statistics.
- Publication-Ready Pathway Flux Maps: High-resolution vector diagrams (PDF/SVG) illustrating lipid metabolic flux partitioning.
Research Applications of Fatty Acid Pathway Flux Analysis & DNL Profiling
- Metabolic Liver Diseases (NAFLD/NASH): Quantify hepatic de novo lipogenesis (DNL), evaluate ACC/FASN inhibitor efficacy, and measure impaired β-oxidation.
- Oncology & Tumor Lipid Reprogramming: Characterize lipogenic switch in cancer cells, dependence on exogenous lipid scavenging vs. endogenous synthesis, and SCD1 desaturation indices.
- Cardiometabolic & Heart Failure Studies: Map substrate preference switching between fatty acids and glucose in ischemic or hypertrophic myocardium.
- Obesity & Adipocyte Physiology: Track lipid turnover, lipolysis flux, and triglyceride remodeling in white and brown adipose tissues.
- Microbial Bioprocess & Biofuels: Optimize microbial fatty acid synthesis, chain-length specificity, and lipid accumulation in engineered microbial cell factories.


 Contact Us



