One-Carbon Metabolic Flux Analysis — Beyond Static Intermediate Quantification
One-carbon (1C) metabolism coordinates nucleotide synthesis, epigenetic methylation, and redox homeostasis across compartmentalized mitochondrial and cytosolic networks. While conventional metabolomics measures static pool sizes of folates, amino acids, and S-adenosylmethionine (SAM), concentration measurements cannot reveal whether altered pool sizes stem from accelerated de novo synthesis, impaired utilization, or redirected compartmental shuttling.
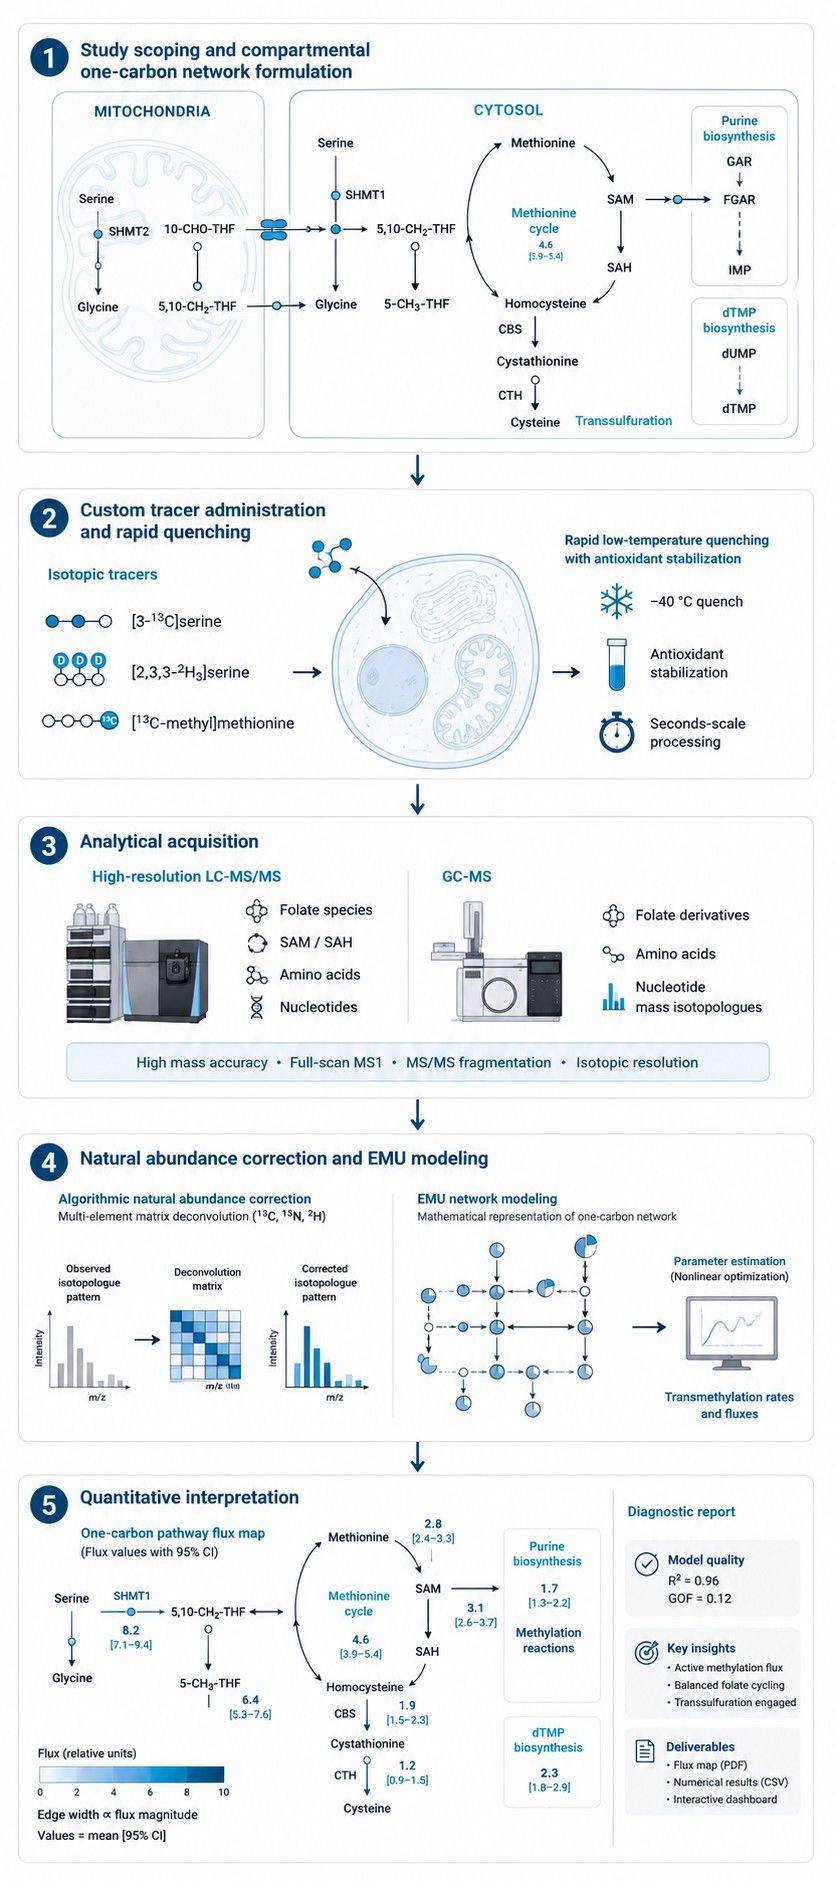
As a specialized pathway Spoke within our central carbon metabolic flux analysis and broader metabolic flux analysis service, One-Carbon MFA utilizes stable isotopes (13C, 15N, 2H) to model reaction velocities across key 1C decision nodes:
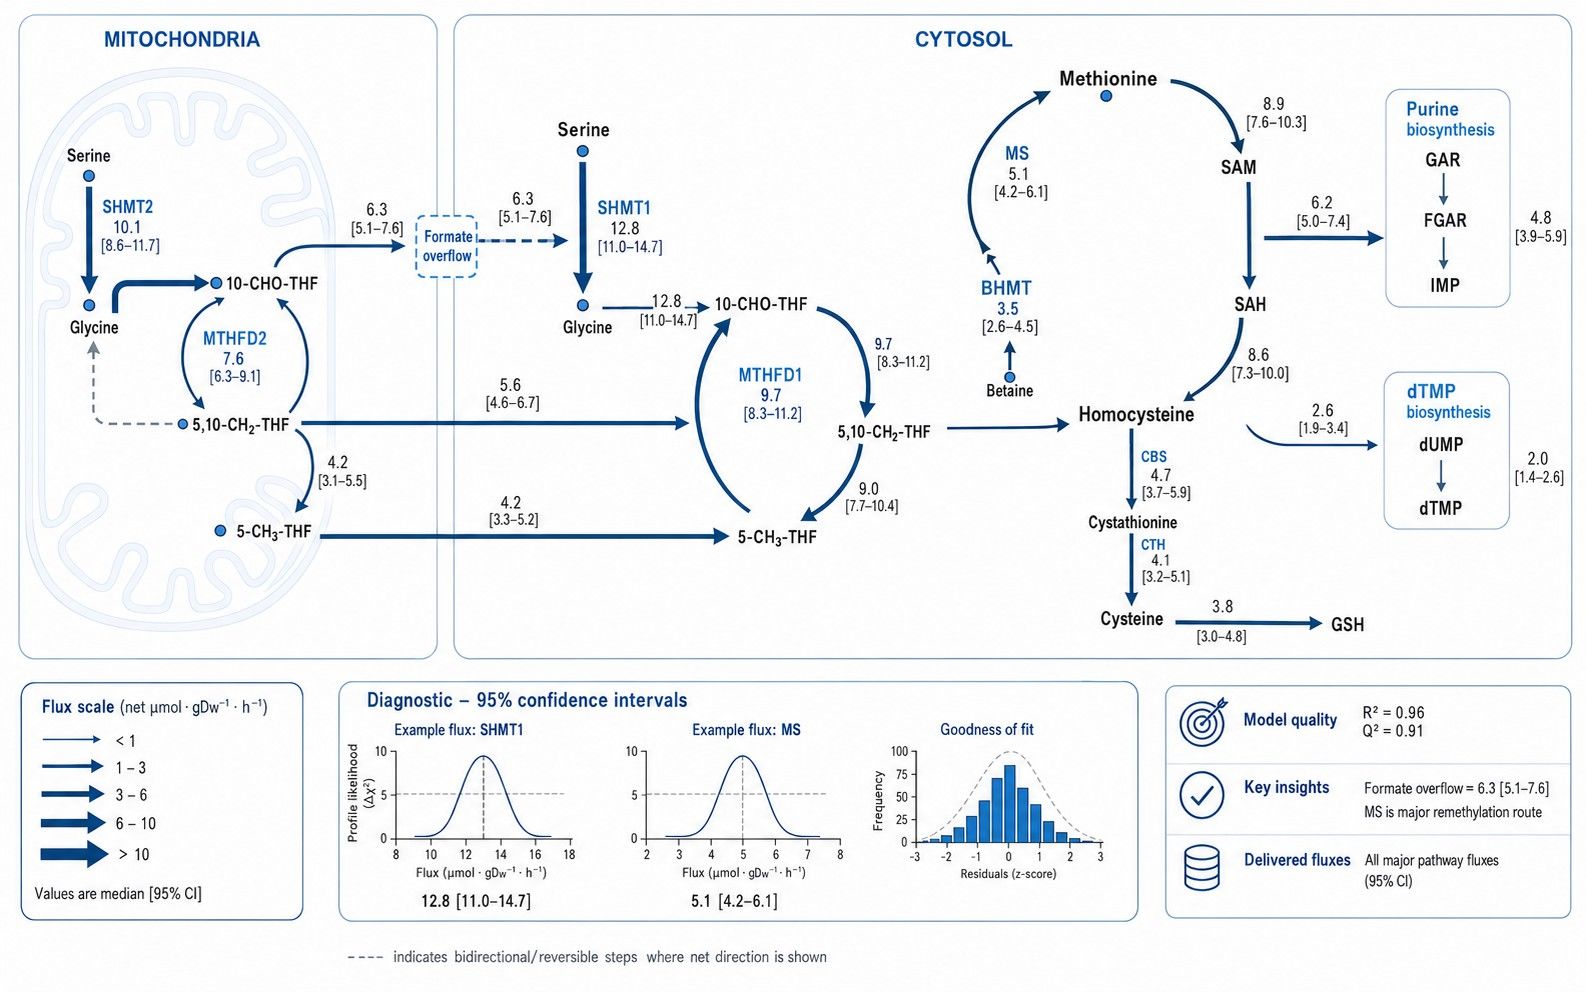
(i) Mitochondrial vs. Cytosolic Folate Shuttling: Quantifying mitochondrial 1C production (SHMT2, MTHFD2, and MTHFD1L formate release) versus cytosolic 1C utilization (MTHFD1, SHMT1), linked to our amino acid metabolic flux analysis.
(ii) Methionine Cycle & Transmethylation: Measuring homocysteine remethylation via methionine synthase (MS/MTR, utilizing 5-methyl-THF) and absolute SAM-dependent transmethylation rates generating SAH.
(iii) Transsulfuration Partitioning: Quantifying homocysteine flux diversion through cystathionine β-synthase (CBS) into cysteine and glutathione (GSH) synthesis versus methionine cycle retention.
(iv) De Novo Purine & dTMP Biosynthesis: Tracking formyl-carbon incorporation into purine C2/C8 positions (GART, ATIC) and methylene incorporation into thymidylate (TYMS) for DNA replication.
Looking for metabolite concentration measurements? If your study focuses on quantifying absolute or relative pool sizes (μmol/g or ng/mL) of one-carbon intermediates, folates, or SAM/SAH without stable isotope tracing, please explore our One-Carbon Metabolism Analysis service.
Analytical Considerations in Folate & One-Carbon Fluxomics
One-carbon fluxomics requires targeted analytical workflows to stabilize labile folate polyglutamates and resolve low-abundance nucleotides:
- Redox & Light Protection for Labile Folates: Reduced folates (THF, 5-CH3-THF, 5,10-CH2-THF, 10-CHO-THF) are extracted in pre-cooled organic solvents containing antioxidants (ascorbic acid, β-mercaptoethanol) to prevent oxidative degradation.
- High-Resolution LC-MS/MS for SAM, SAH & Nucleotides: Targeted liquid chromatography-tandem mass spectrometry resolves intact methyl donors (SAM, SAH, methionine, homocysteine) and phosphorylated nucleotides (AMP, GMP, dTMP).
- Orthogonal GC-MS Profiling: Complementary GC-MS-based metabolic flux analysis with silylation or chloroformate derivatization provides fragment-resolved mass isotopologues for serine, glycine, and methionine.
- Multi-Element Background Deconvolution: Algorithmic matrix deconvolution (IsoCor / AccuCor) mathematically corrects raw spectra for natural 13C, 15N, 2H, 18O, and silyl backgrounds.
Stable-Isotope Tracer Strategies for One-Carbon & Folate Networks
Tracer selection determines which one-carbon compartments, methylation pathways, and biosynthetic branch points are mathematically identifiable:
| Tracer Strategy |
Target One-Carbon Node |
Diagnostic MID Readout & Value |
| [3-13C]Serine |
One-Carbon Entry into Folate Pool, Purine & SAM Synthesis |
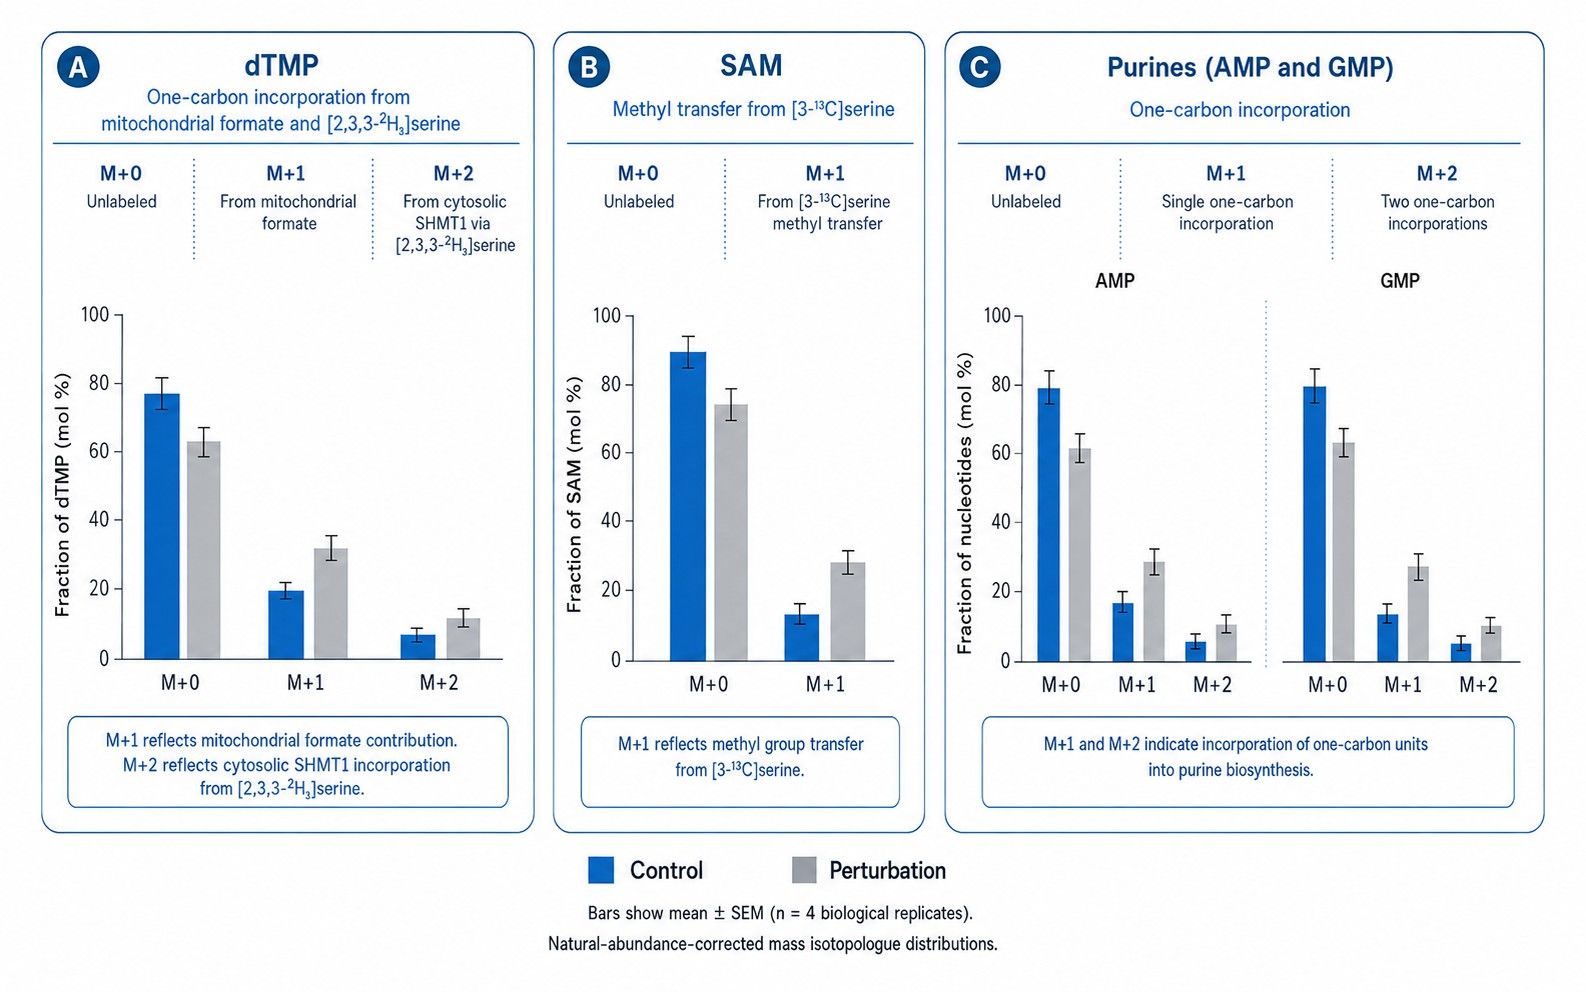
Specifically labels the β-carbon of serine. SHMT-mediated cleavage transfers 13C into the folate pool ([13C]5,10-CH2-THF), leaving glycine unlabelled (M+0). Yields M+1/M+2 purines (C2/C8), M+1 dTMP, and M+1 methionine/SAM via MTR remethylation. |
| [2,3,3-2H3]Serine |
Mitochondrial vs. Cytosolic SHMT Directionality |
Mitochondrial oxidation of [2,3,3-2H3]serine to formate loses one deuterium, releasing [2H]formate to yield M+1 dTMP in the cytosol. Cytosolic SHMT1 directly yields [2H2]5,10-CH2-THF and M+2 dTMP. The M+1/M+2 dTMP ratio directly quantifies mitochondrial vs. cytosolic 1C contribution. |
| [U-13C3, 15N]Serine |
Dual Carbon Backbone & Amino Nitrogen Partitioning |
Simultaneously tracks carbon backbone cleavage to [U-13C2, 15N]glycine (M+3) and 1C donation ([13C]formate/folate), validating direct enzyme coupling and transamination recycling. |
| [13C-methyl]Methionine |
Methionine Cycle Flux & Transmethylation Rate |
Directly enters the methionine cycle to form [13C-methyl]SAM (M+1). Transmethylation transfers the labeled methyl group to DNA/RNA/proteins, regenerating SAH (M+0) and homocysteine to measure cellular transmethylation velocity. |
| [13C]Formate |
Cytosolic Folate Utilization & Mitochondrial Bypass |
Supplies labeled formate directly to cytosolic MTHFD1, evaluating purine synthesis capacity in models with mitochondrial folate or respiratory chain defects. |
Technical Capabilities for High-Resolution One-Carbon MFA
- Compartmental Isotopologue Modeling: Mathematical Elementary Metabolite Unit (EMU) modeling resolving mitochondrial matrix versus cytosolic folate compartmentalization and formate shuttle velocity.
- Multi-Isotope Tracing (13C, 15N, 2H): Integrated platform supporting multi-tracer configurations to resolve overlapping transamination, oxidation, and methyl-transfer pathways.
- Isotopic Steady-State and Dynamic Kinetic Sampling: Supports steady-state fractional contribution studies as well as time-course dynamic and INST metabolic flux analysis to evaluate acute antifolate drug inhibition (e.g. methotrexate, SHMT inhibitors).
- Complementary High-Field NMR Verification: Orthogonal verification of position-specific carbon and nitrogen labeling via NMR-based metabolic flux analysis.
End-to-End One-Carbon MFA Workflow & Analytical Pipeline
Sample Preparation & Stabilization Guidelines for One-Carbon MFA
Sample amounts and extraction protocols are finalized during feasibility review based on target folate abundance and matrix type:
| Sample Type |
Typical Input Guidelines |
Harvesting & Quenching Principles |
Storage & Transport |
| Adherent Cultured Cells |
Typically 2–10 × 106 cells (100 mm dish or two 60 mm dishes) |
Rapidly aspirate tracer medium, rinse with ice-cold PBS, add pre-chilled organic extraction solvent with antioxidants on dry ice/ice. |
Store at −80 °C; ship on dry ice |
| Suspension Cultured Cells |
Typically 5–15 × 106 cells, adjusted to cell density |
Short, pre-cooled centrifugation (4 °C), aspirate supernatant, extract cell pellet immediately in cold solvent with stabilizing agents. |
Store at −80 °C; ship on dry ice |
| Animal & Tumor Tissues |
20–50 mg wet weight, depending on metabolic activity |
Instant freeze-clamping or flash freezing in liquid nitrogen immediately upon collection; cryo-pulverize without intermediate thawing. |
Store at −80 °C; ship on dry ice |
| Blood Plasma / Serum |
≥ 100 μL matched plasma or serum |
Collect blood into EDTA tubes, centrifuge immediately (4 °C, 2,000 × g, 10 min), aliquot and freeze immediately. |
Store at −80 °C; ship on dry ice |
| Conditioned Culture Medium |
≥ 200 μL matched supernatant |
Sample matched culture supernatant across labeling time points; clarify by centrifugation (4 °C) to quantify serine/formate exchange. |
Store at −80 °C; ship on dry ice |
Deliverables & Quantitative Reporting from One-Carbon MFA
- Deconvoluted 1C Intermediate MID Matrix: Natural-abundance-corrected fractional labeling (M+0 to M+n) across serine, glycine, methionine, SAM, SAH, cystathionine, AMP, GMP, and dTMP.
- Extracellular Exchange Rates: Quantified serine consumption, glycine exchange, and formate export rates providing stoichiometric boundaries.
- Compartmental Model Specifications: Complete reaction network definitions, carbon/deuterium atom transitions, and project configuration files.
- Calculated Reaction Rates & Split Ratios: Net and exchange fluxes with accompanying sensitivity analysis and confidence intervals.
- Statistical Fit Diagnostics: Sum of squared residuals (SSR), Chi-square goodness-of-fit evaluation, and residual diagnostic plots.
- Publication-Ready Pathway Maps: High-resolution vector diagrams (PDF/SVG) illustrating one-carbon metabolic flux partitioning across compartments.
Research Applications of One-Carbon Pathway Flux Analysis & Epigenetics
- Oncology & Antifolate Drug Screening: Evaluate mechanism-of-action and flux inhibition by small molecules targeting SHMT1/2, MTHFD2, DHFR, or TYMS (e.g. methotrexate, pemetrexed).
- Epigenetic Methylation & SAM Availability: Quantify how dietary methionine restriction, MAT2A inhibition, or NNMT overexpression alters histone and DNA methylation flux.
- Immunometabolism & T-Cell Proliferation: Characterize one-carbon flux remodeling supporting rapid nucleotide synthesis and redox balance during immune cell activation.
- Metabolic Liver & Cardiovascular Diseases: Map homocysteine remethylation vs. transsulfuration flux in hyperhomocysteinemia, NASH, and cardiovascular disorders.
- Neurodevelopment & Inborn Errors of Metabolism: Trace genetic lesions in MTHFR, MTR, or CBS and their downstream metabolic consequences on neurotransmitter and folate pools.


 Contact Us



