Why NMR-Based Metabolic Flux Analysis Adds Position-Specific Evidence
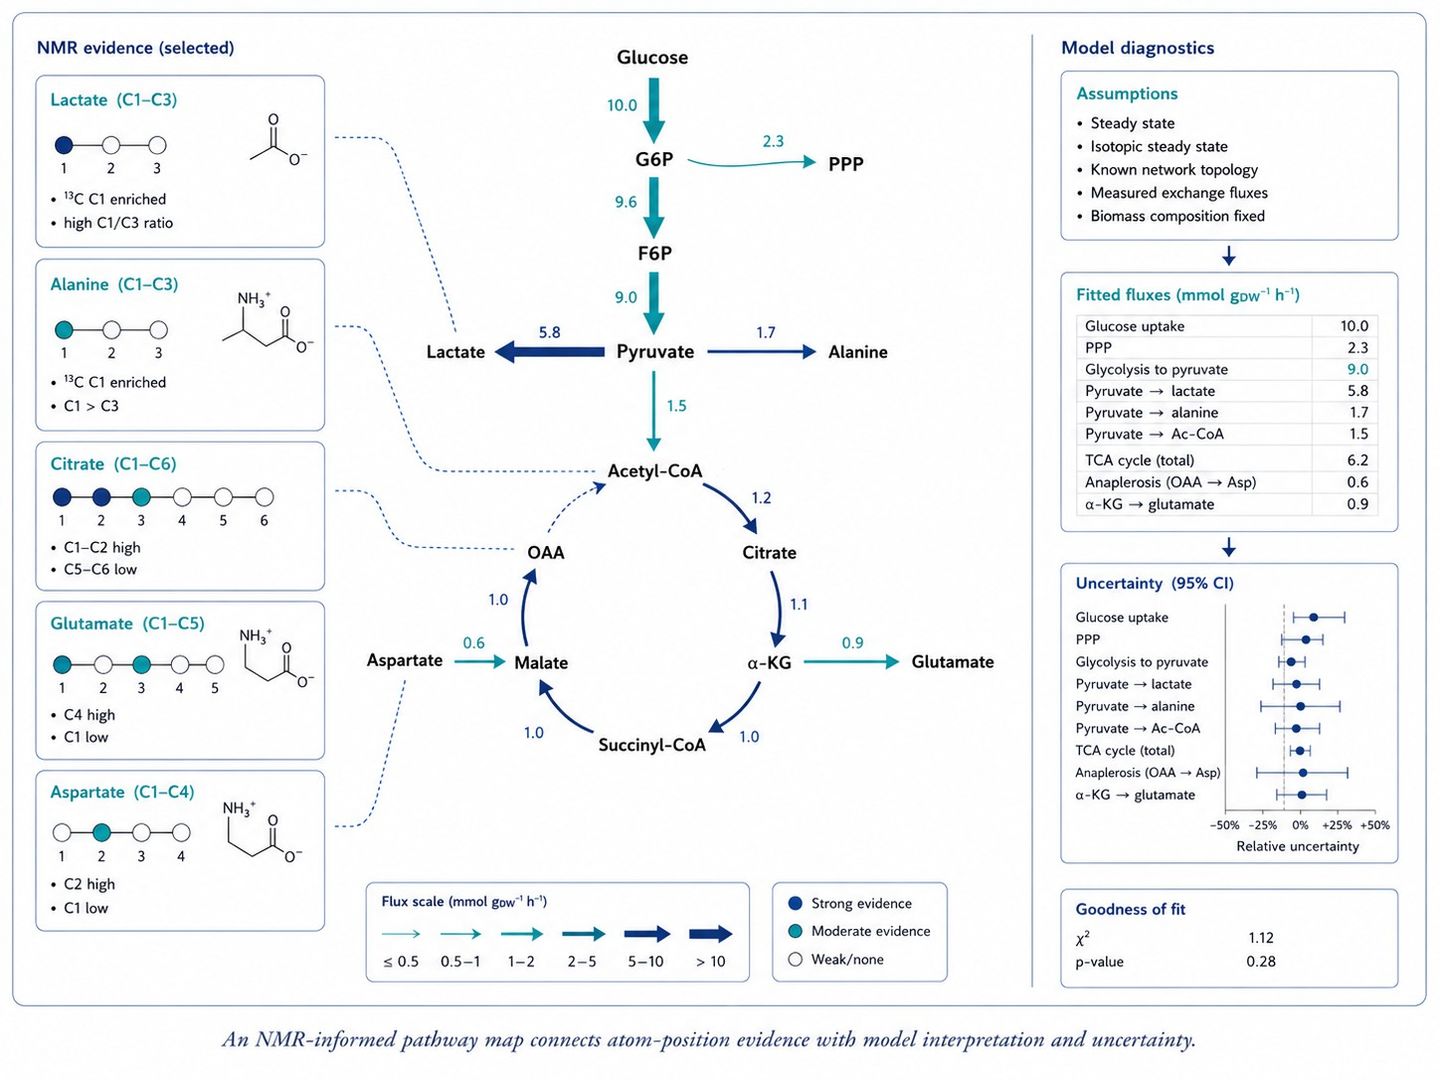
Stable-isotope tracing becomes a true flux study only when the measured labeling pattern can definitively distinguish between alternative pathway routes. Mass spectrometry (MS) excels at measuring whole-molecule mass isotopologue distributions (MIDs), but an NMR spectrum uniquely reveals exactly which carbon position carries the label and, through spin-spin coupling multiplets (13C-13C J-coupling), whether adjacent labeled carbons co-occur within the same intact molecule. This atom-resolved evidence is decisive when carbon scrambling, parallel branch points, or intracellular compartmentation produce identical whole-molecule mass shifts.
As part of our comprehensive metabolic flux analysis service, targeted NMR-MFA is deployed when positional isotopomer information is required to resolve mathematical non-identifiability. We do not present NMR as a universal substitute for mass spectrometry; instead, we leverage NMR's atomic-site resolution alongside MS sensitivity in a complementary workflow tailored to the research question.
NMR Flux Analysis Services: From Isotope Tracing to Network Interpretation
| Study Objective |
NMR Methodological Contribution |
Analytical Project Output |
| Central Carbon Pathway Routing |
Position-specific 13C enrichment and multiplet splitting patterns in glucose, lactate, alanine, glutamate, and citrate. |
Tracer-informed evidence for glycolytic vs. PPP routing, PDH vs. PC entry, and reversible transketolase/transaldolase exchange. |
| Oxidative vs. Reductive TCA Routing |
Atom-position tracking (e.g. C4 vs. C5 labeling in citrate and glutamate) differentiating forward vs. reverse IDH flux. |
Position-resolved enrichment matrices, stated model assumptions, and validated pathway flux boundaries. |
| Cell, Microbial & Plant Tracing |
1D (1H, direct 13C) and 2D heteronuclear correlation experiments (1H-13C HSQC/HMQC) optimized for complex bioextracts. |
Fully processed spectra, resonance assignments, chemical-shift tracking, and quantitative isotopomer fractions. |
| Complementary NMR-MS Workflows |
NMR supplies site-specific multiplet constraints while LC-MS/GC-MS broadens pathway metabolite coverage. |
An integrated multi-platform dataset providing orthogonal constraints for robust mathematical flux fitting. |
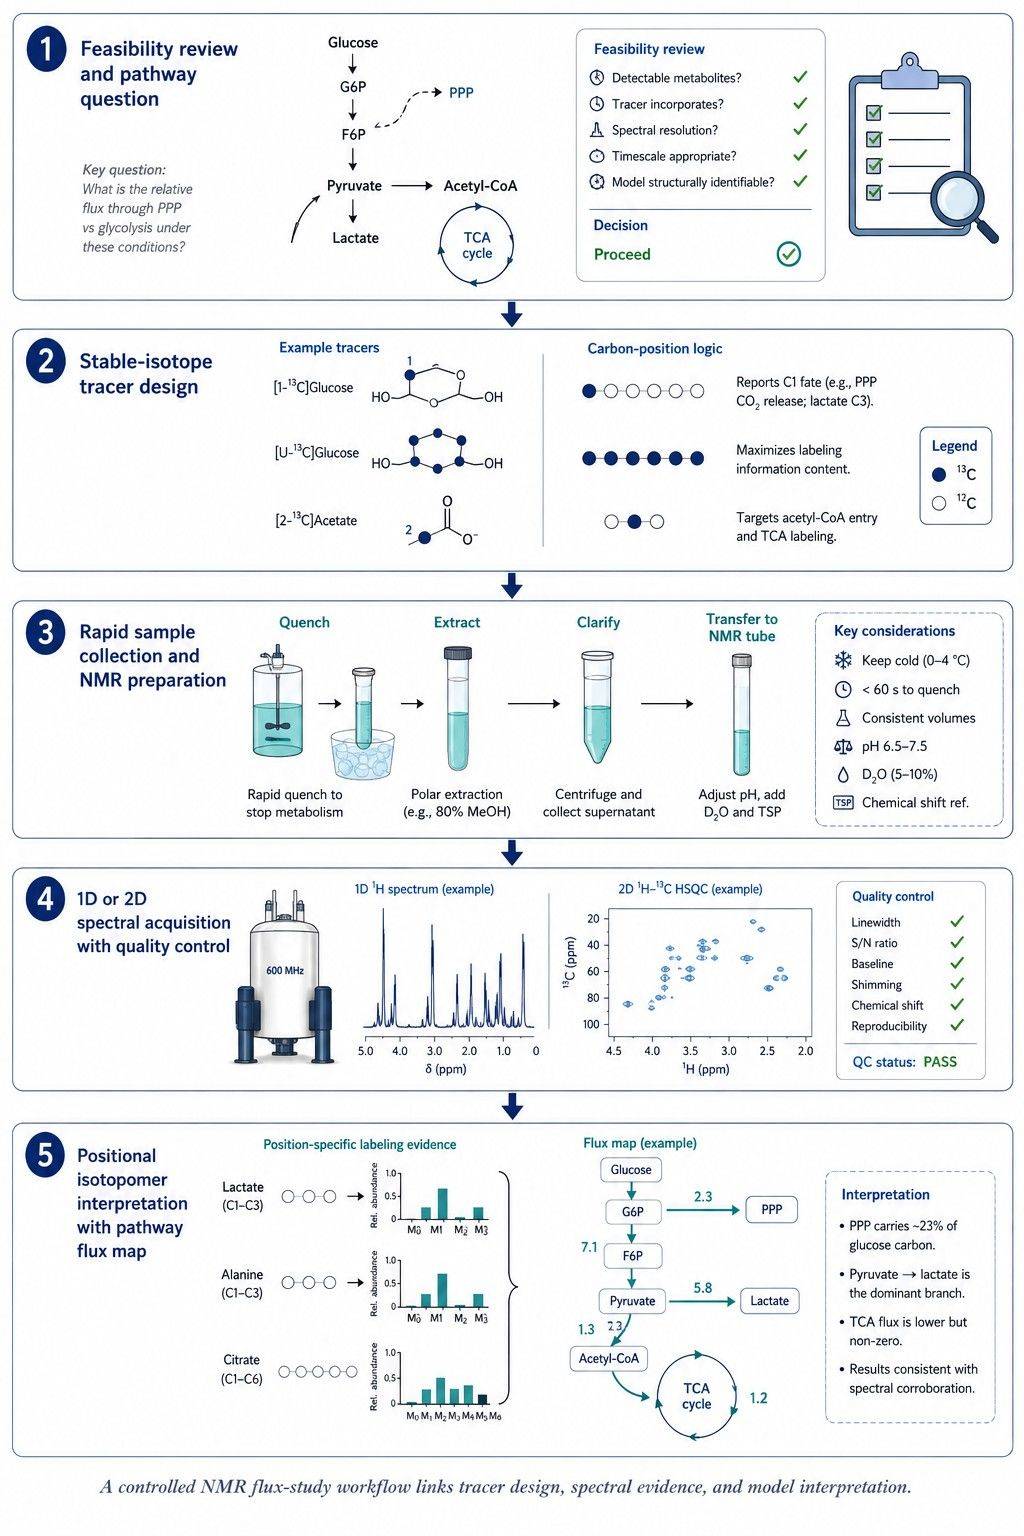
Study planning begins from the specific metabolic node to be discriminated. A project centered on glucose routing may combine position-specific tracers with selected 1H-13C HSQC readouts, while broad central-carbon studies utilize targeted mass spectrometry for coverage and NMR for pivotal branch-point verification. Our central carbon metabolism analysis service provides complementary quantitative concentration data.
Why Choose Creative Proteomics for NMR Flux Studies
- Position-First Experimental Design: We define which atomic positions and 13C-13C coupling multiplets must be observed before selecting the tracer scheme, pulse sequence, and sample biomass requirements.
- Transparent Platform Selection: NMR sensitivity boundaries, spectral overlap, and required analyte concentrations are evaluated upfront. When broader metabolite coverage is required, we recommend a paired NMR-MS design rather than overextending NMR capabilities.
- Spectral Evidence Separated from Model Fitting: Assigned resonances, integration values, baseline corrections, and multiplet deconvolution are documented independently from computational flux estimates.
- Rigorous Mathematical Guardrails: Network stoichiometry, carbon atom transition matrices, and boundary uptake/secretion rates are locked prior to non-linear regression modeling.
Our End-to-End NMR Metabolic Flux Analysis Workflow
NMR Measurement Design: 1D (1H, 13C) and 2D Heteronuclear Correlation Pulse Programs
The NMR acquisition sequence is selected for the specific structural information required by the flux model. One-dimensional 1H NMR offers high sensitivity for proton-associated metabolites. Direct 13C NMR (proton-decoupled) provides site-resolved carbon observations and 13C-13C spin coupling multiplets. Two-dimensional heteronuclear correlation experiments (1H-13C HSQC, 1H-13C HMQC, 13C-13C TOCSY, 2D INADEQUATE) resolve overlapping peaks in complex extracts while preserving positional coupling constraints.
| Measurement Modality |
Pulse Sequence & Parameters Assessed |
Impact on Metabolic Flux Interpretation |
| 1D 1H NMR Profiling |
Standard 1D with water suppression (NOESY-presat, CPMG). Assesses metabolite abundance and 1H-13C satellite peaks (J_CH ≈ 120–140 Hz). |
Quantifies fractional 13C enrichment at protonated carbon sites with high sensitivity. |
| Direct 1D 13C NMR (Decoupled) |
Power-gated 1H-decoupled 13C acquisition. Resolves singlet (S), doublet (D), and triplet (T) carbon multiplet splitting patterns (J_CC ≈ 35–55 Hz). |
Directly discriminates intact 13C-13C carbon skeleton conservation from fragment rearrangement. |
| 2D 1H–13C HSQC / HMQC |
Phase-sensitive 2D heteronuclear single/multiple quantum coherence. Spreads overlapping resonances across 1H and 13C chemical shift dimensions. |
Enables site-specific 13C enrichment quantification in crowded bioextracts without chemical derivatization. |
| 2D 13C–13C TOCSY / INADEQUATE |
Total correlation and double-quantum coherence spectroscopy tracking contiguous 13C-13C spin networks. |
Definitively maps multi-carbon isotopomer connectivity across converging metabolic pathways. |
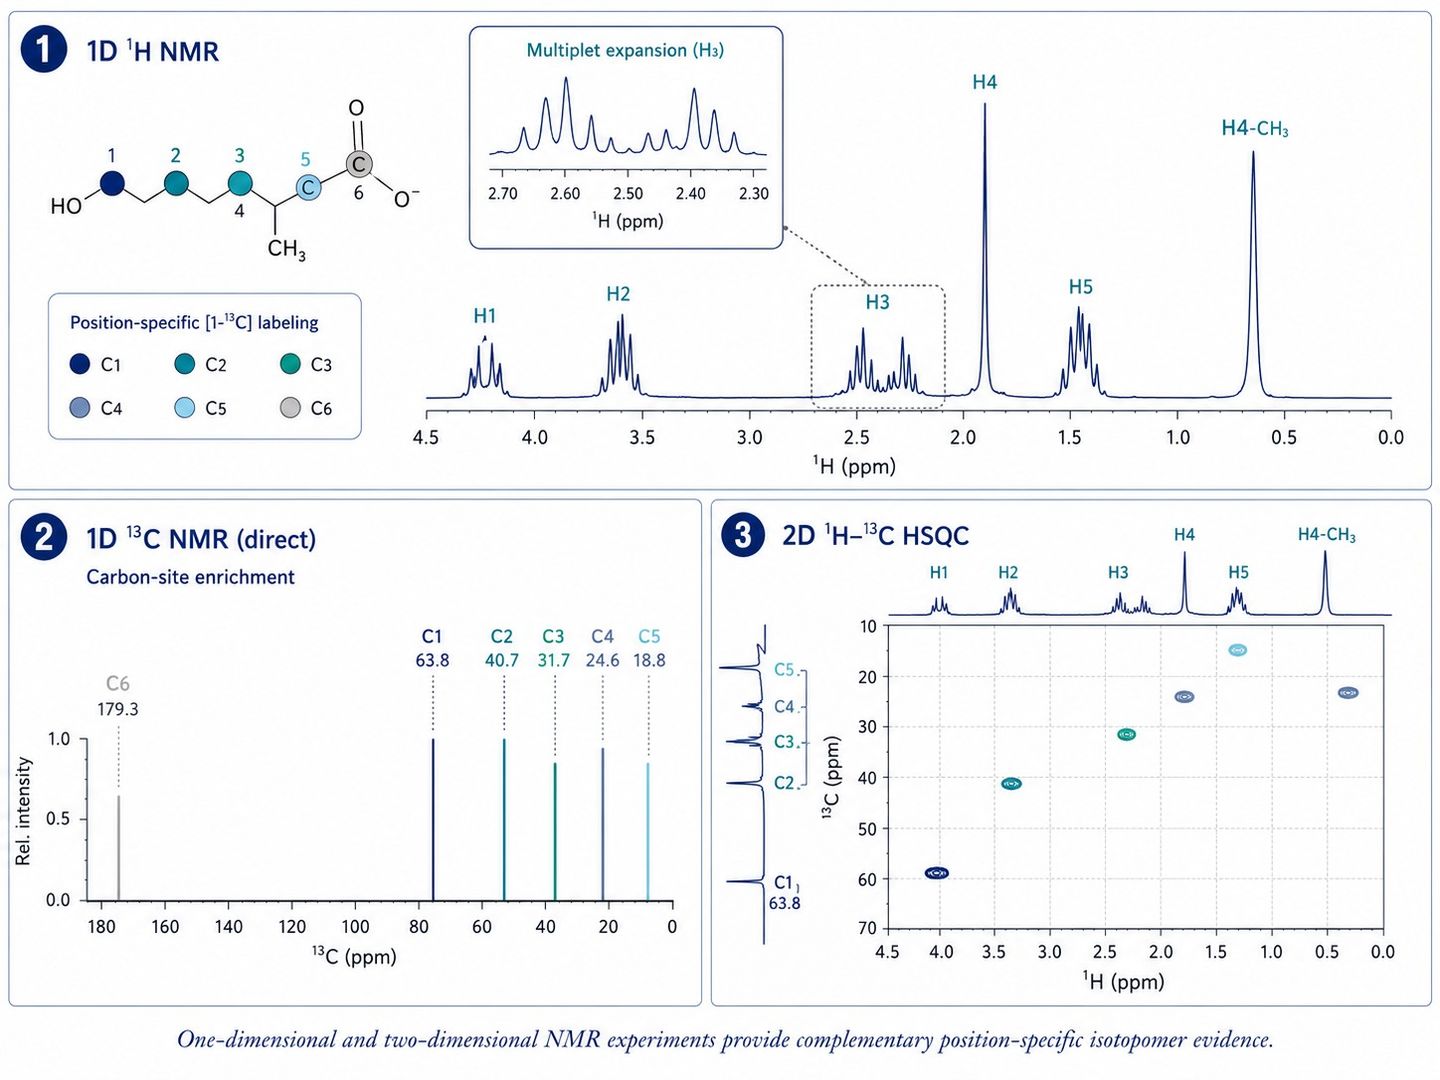
Natural isotope abundance, incomplete isotopic enrichment, rapid exchange reactions, and spectral overlap are accounted for during deconvolution. We report raw spectral integration and model-derived flux estimates as distinct layers.
Choosing NMR, MS, or a Complementary NMR-MS Workflow
NMR and mass spectrometry provide complementary views of isotopic labeling. MS is preferred for broad pathway coverage, low-abundance metabolites, and whole-molecule mass isotopologue distributions (MIDs). NMR is essential when the biological question depends on atomic-site enrichment, stereospecificity, 13C-13C coupling multiplets, or non-destructive measurement. Platform selection is guided by the specific analytical discriminants required.
| Decision Parameter |
NMR is Strongly Indicated When |
MS or Paired NMR-MS is Preferred When |
| Target Measurement |
Specific carbon position, 13C-13C adjacent coupling multiplets, or structural isomer discrimination is required. |
Broad metabolite coverage across dozens of intermediates or whole-molecule mass distributions are needed. |
| Sample Biomass & Abundance |
High sample biomass is available (>10^7 cells, >50 mg tissue, or high-titer fermentation broth). |
Sample material is limited (<10^6 cells, micro-biopsies), where MS sensitivity is mandatory. |
| Model Fitting Strategy |
Focused metabolic network with key branch-point reactions constrained by positional isotopomers. |
Genome-scale or extensive central networks requiring broad intracellular and extracellular rate constraints. |
For a detailed technical comparison, consult our metabolomics platform comparison guide, which details sample volume, dynamic range, and resolution benchmarks.
Sample Preparation and NMR Submission Planning
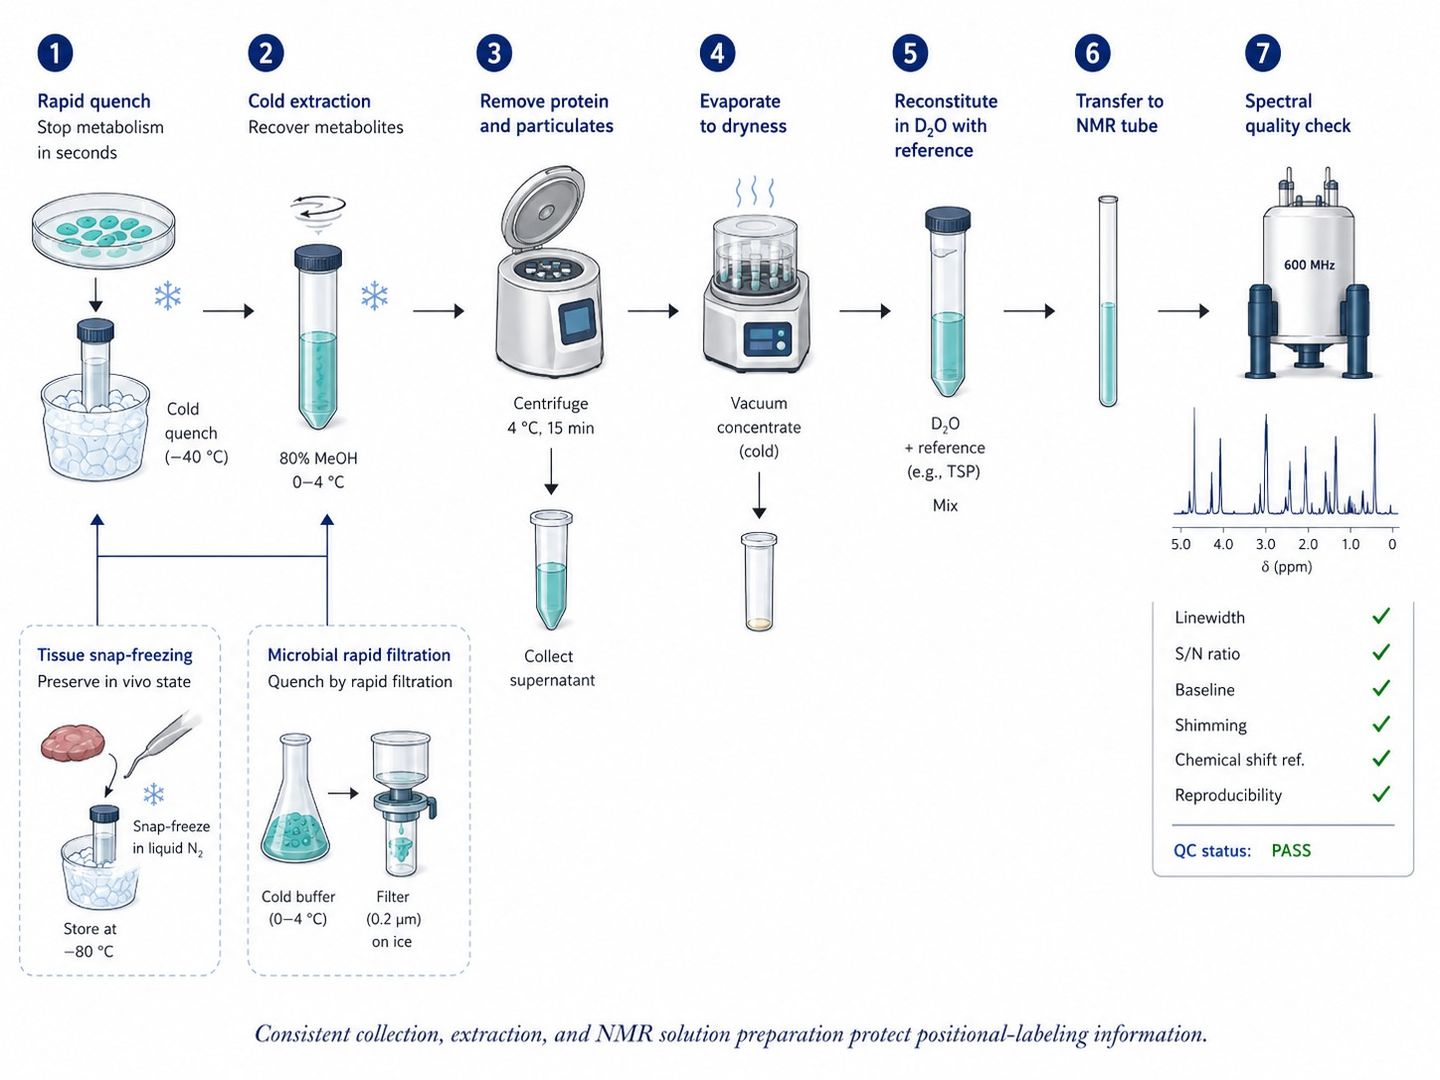
In NMR flux analysis, sample preparation directly impacts spectral quality. Inconsistent extraction, residual protein, variable pH, or particulate matter causes line broadening, chemical shift drift, and loss of coupling resolution. We establish standardized extraction and reconstitution protocols before tracer exposure begins.
| Sample Matrix |
Preparation & Quenching Focus |
Submission Planning Checkpoints |
| Adherent & Suspension Cells |
Sub-second cold-solvent arrest (-80 °C); complete protein/lipid removal; lyophilization; reconstitution in D2O buffer. |
10–50 × 106 cells per replicate; document tracer incubation window and collect parallel plate for normalization. |
| Animal & Plant Tissues |
Immediate liquid nitrogen freeze-clamping; cryogenic bead milling; biphasic (MeOH:CHCl3:H2O) extraction of polar fraction. |
50–200 mg wet weight; preserve anatomical consistency and maintain continuous cold chain (−80 °C). |
| Microbial Fermentation Broth |
Fast filtration (<2 s) with liquid nitrogen freezing; cold solvent extraction; separate analysis of extracellular broth. |
10–50 mg dry cell weight; document growth OD, medium formula, and collect cell-free supernatant. |
| Biofluids (Serum, Plasma, Urine) |
Centrifugal filtration through 3 kDa cutoff filters to remove protein; addition of buffered D2O with DSS/TSP internal standard. |
≥ 300–500 µL; record collection timing, anticoagulant choice, and storage history without freeze-thaw cycles. |
Practical Preparation Controls
- Maintain identical tracer exposure timing, temperature, and collection sequences across all experimental arms.
- Reconstitute all NMR samples in calibrated deuterated phosphate buffer (e.g., 50–100 mM NaH2PO4/Na2HPO4 in D2O, pD 7.0–7.4) containing 0.1–0.5 mM DSS-d6 or TSP-d4 as internal chemical shift and quantification reference.
- Centrifuge extracts at 15,000 × g for 10 min at 4 °C to remove all particulates before transferring into 3 mm or 5 mm high-precision NMR tubes.
NMR Flux Data Package and Publication-Oriented Outputs
We structure NMR flux deliverables so that research teams can distinguish raw spectral observations from computational model estimates. Deliverables are provided in publication-grade vector formats (PDF/SVG) adhering to Nature journal visual design guidelines.
| Deliverable Layer |
Typical Contents |
Interpretive & Scientific Value |
| Processed Spectral Files & QC Record |
Raw and phase/baseline-corrected 1D/2D FID files (Bruker TopSpin format), chemical shift reference alignments, and line-width QC reports. |
Full analytical transparency enabling independent spectral inspection. |
| Positional Enrichment Tables |
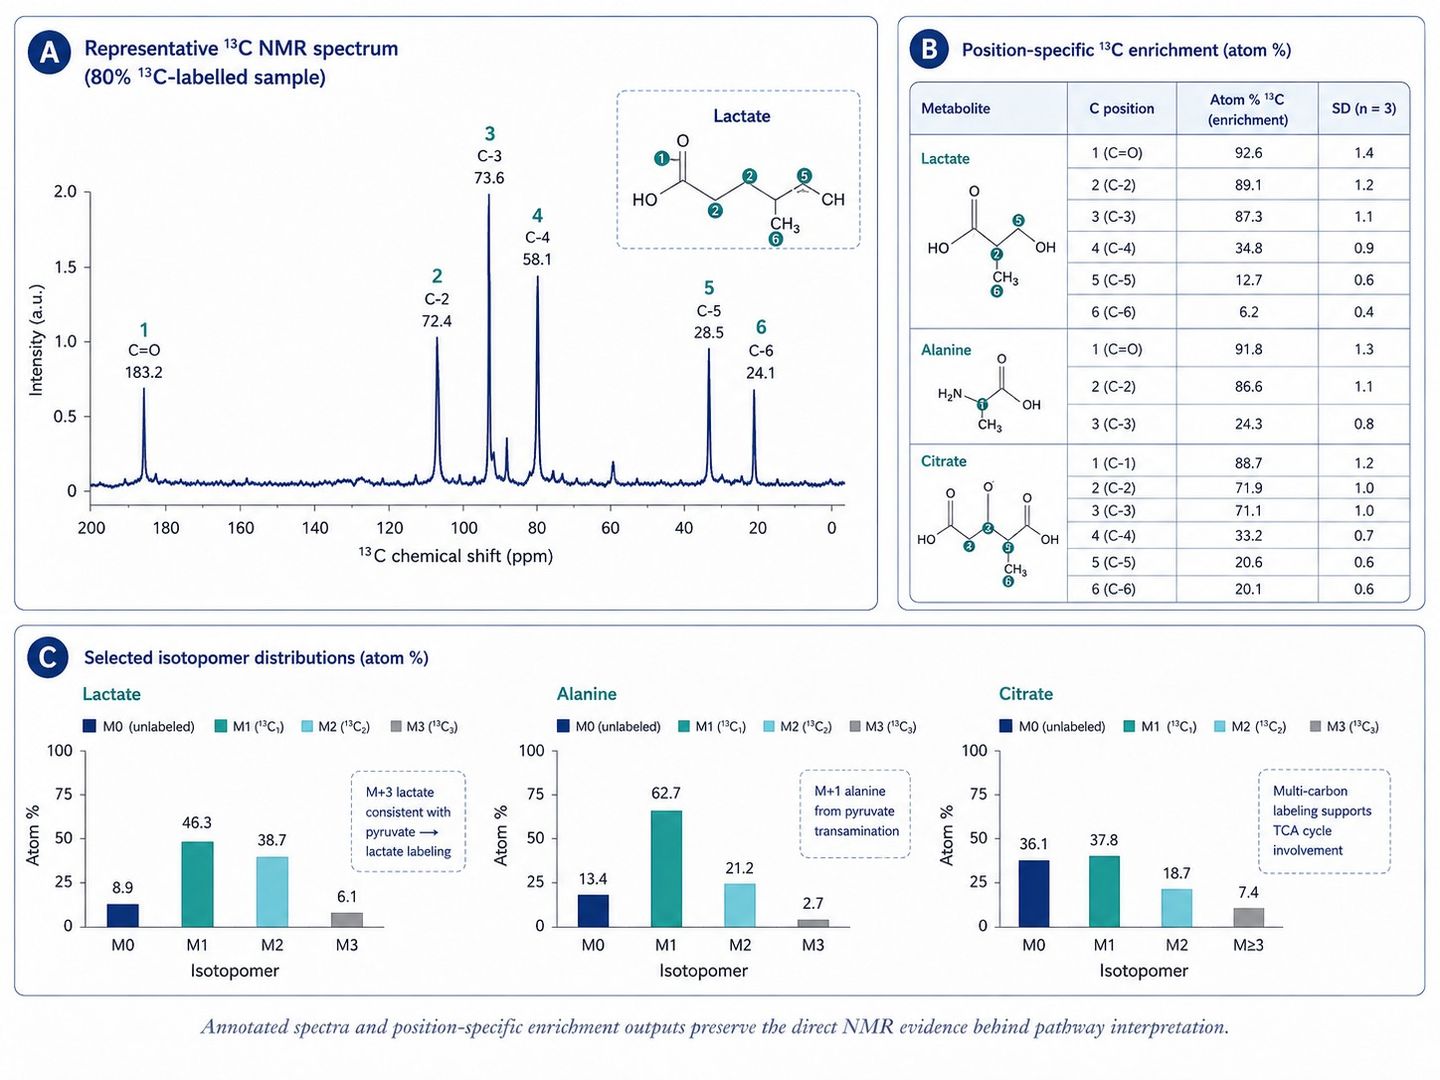
Metabolite peak assignments, atomic site positions, integral values, multiplet deconvolution fractions, and biological replicate statistics (.csv / Excel). |
Separates direct experimental labeling measurements from model-derived inferences. |
| Isotopomer Figures & Spectra |
Publication-ready high-resolution annotated 1D and 2D HSQC/TOCSY spectra, highlighting 13C satellite peaks and coupling multiplets. |
Directly communicates atomic-site tracer incorporation for manuscript preparation. |
| Flux Model Package & Flux Maps |
Stoichiometric model equations, atom mapping matrices, fitted net/exchange fluxes with 95% profile likelihood confidence intervals, and vector flux maps. |
Delivers validated, mathematically sound flux solutions linked to the research hypothesis. |
When the study requires multivariate statistical analysis (PCA, OPLS-DA) or integration with mass spectrometry datasets, our metabolomics data analysis service provides comprehensive bioinformatics support.
Research Applications of NMR-Based Metabolic Flux Analysis
- Central Carbon Pathway Dissection: Resolve position-specific tracer fate through glycolysis, the pentose phosphate pathway, and the TCA cycle where identical mass shifts require atomic-site discrimination.
- Mitochondrial & Nutrient Utilization Kinetics: Differentiate forward oxidative TCA cycling from IDH-mediated reductive carboxylation and quantify substrate contribution from glucose, glutamine, and acetate.
- Metabolic Engineering & Fermentation Optimization: Use atom-resolved multiplet data to identify pathway bottlenecks, carbon loss into byproducts, and metabolic rewiring in engineered cell factories.
- Plant & Photosynthetic Metabolism: Track carbon fixation and nitrogen assimilation dynamics in intact plant tissues, seedlings, and algae under environmental stress.
- Comprehensive Pathway Interpretation: Pair atomic-resolution NMR findings with our metabolic pathways analysis workflow for systems-level biological contextualization.
References
- Fan TWM, Lane AN. Applications of NMR spectroscopy to systems biochemistry. Progress in Nuclear Magnetic Resonance Spectroscopy. 2016;92-93:18-53.
- Ragavan M, Merritt ME. Nuclear Magnetic Resonance Measurement of Metabolic Flux Using 13C and 1H Signals. Methods in Molecular Biology. 2019;1996:29-40.
- Radenkovic S, Vuckovic I, Lanza IR. Metabolic Flux Analysis: Moving beyond Static Metabolomics. Trends in Biochemical Sciences. 2020;45(6):545-546.
- Jang C, Chen L, Rabinowitz JD. Metabolomics and Isotope Tracing. Cell. 2018;173(4):822-837.
- Antoniewicz MR. A guide to metabolic flux analysis in metabolic engineering: Methods, tools and applications. Metabolic Engineering. 2021;63:2-12.


 Contact Us



