3D Organoid Metabolomics — Why the Organoid Metabolome Is Your
Most Direct Readout
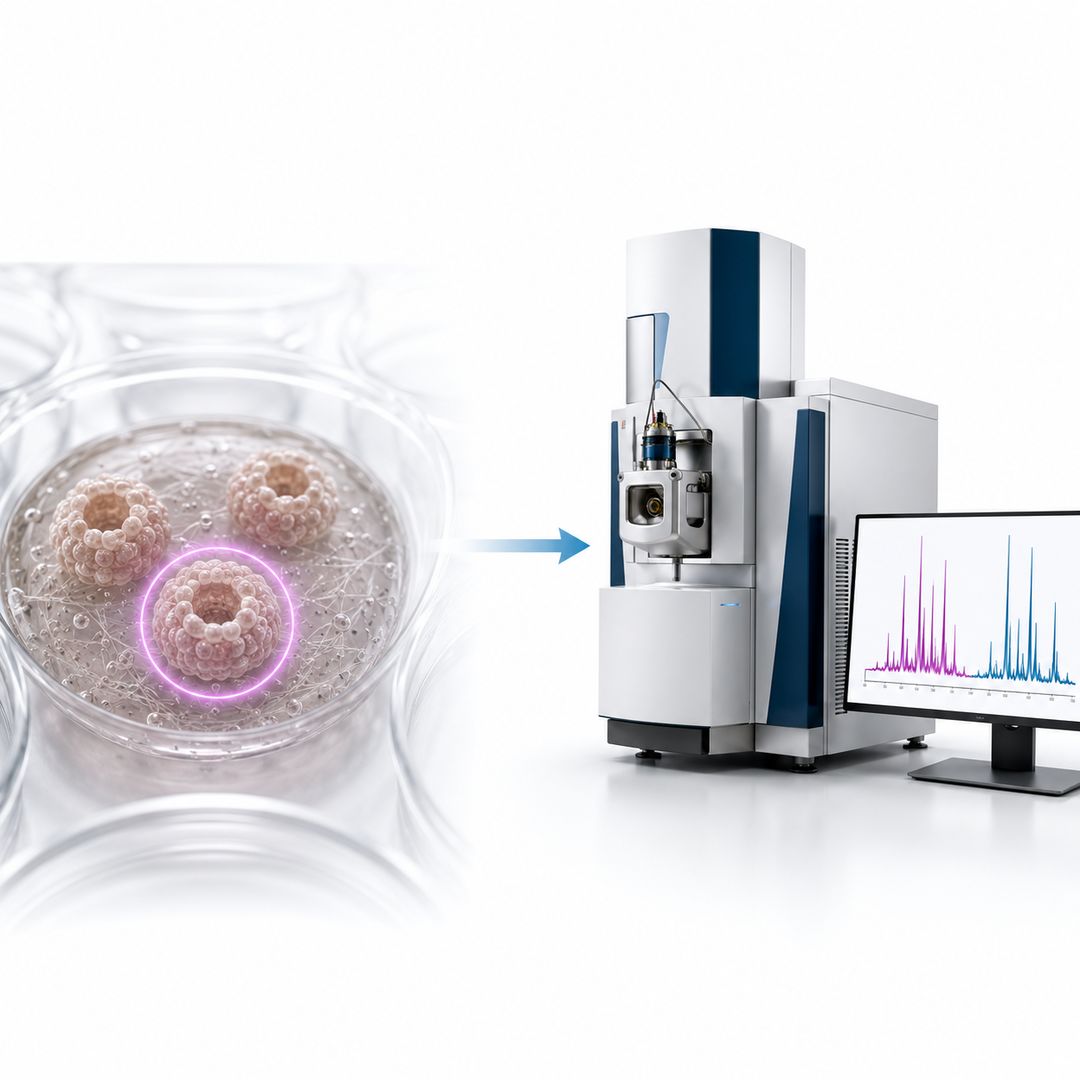
Organoids recapitulate the architecture, cell-cell interactions and metabolic gradients of native tissue,
making them the most human-relevant in vitro system available for disease modeling, drug response studies
and regenerative medicine research. The organoid metabolome is their most direct functional readout: ATP
consumption, substrate utilization and pathway flux respond to every experimental perturbation before
morphology or gene expression do.
Conventional 2D cultures average away the physiology that organoids preserve, and animal models are slow,
costly and increasingly constrained by 3Rs principles. Metabolomics captures organoid metabolism in a
human-relevant model, measuring the biochemical consequences of your experimental design.
Organoids yield far fewer cells than 2D cultures, and most are grown inside extracellular matrix (ECM)
hydrogels such as Matrigel. Standard extraction protocols designed for 2D pellets either fail on low-input
samples or co-extract matrix components that dominate the signal. That is why we developed dedicated
low-input, ECM-aware workflows rather than adapting generic cell protocols. Our cell metabolomics services cover the full cellular range, and
organoid metabolomics extends that capability into 3D.
What Problem Do We Solve in Low-Input Organoid
Metabolomics?
Three analytical challenges make organoid metabolomics fail with off-the-shelf protocols — and each one is
engineered out of our workflow:
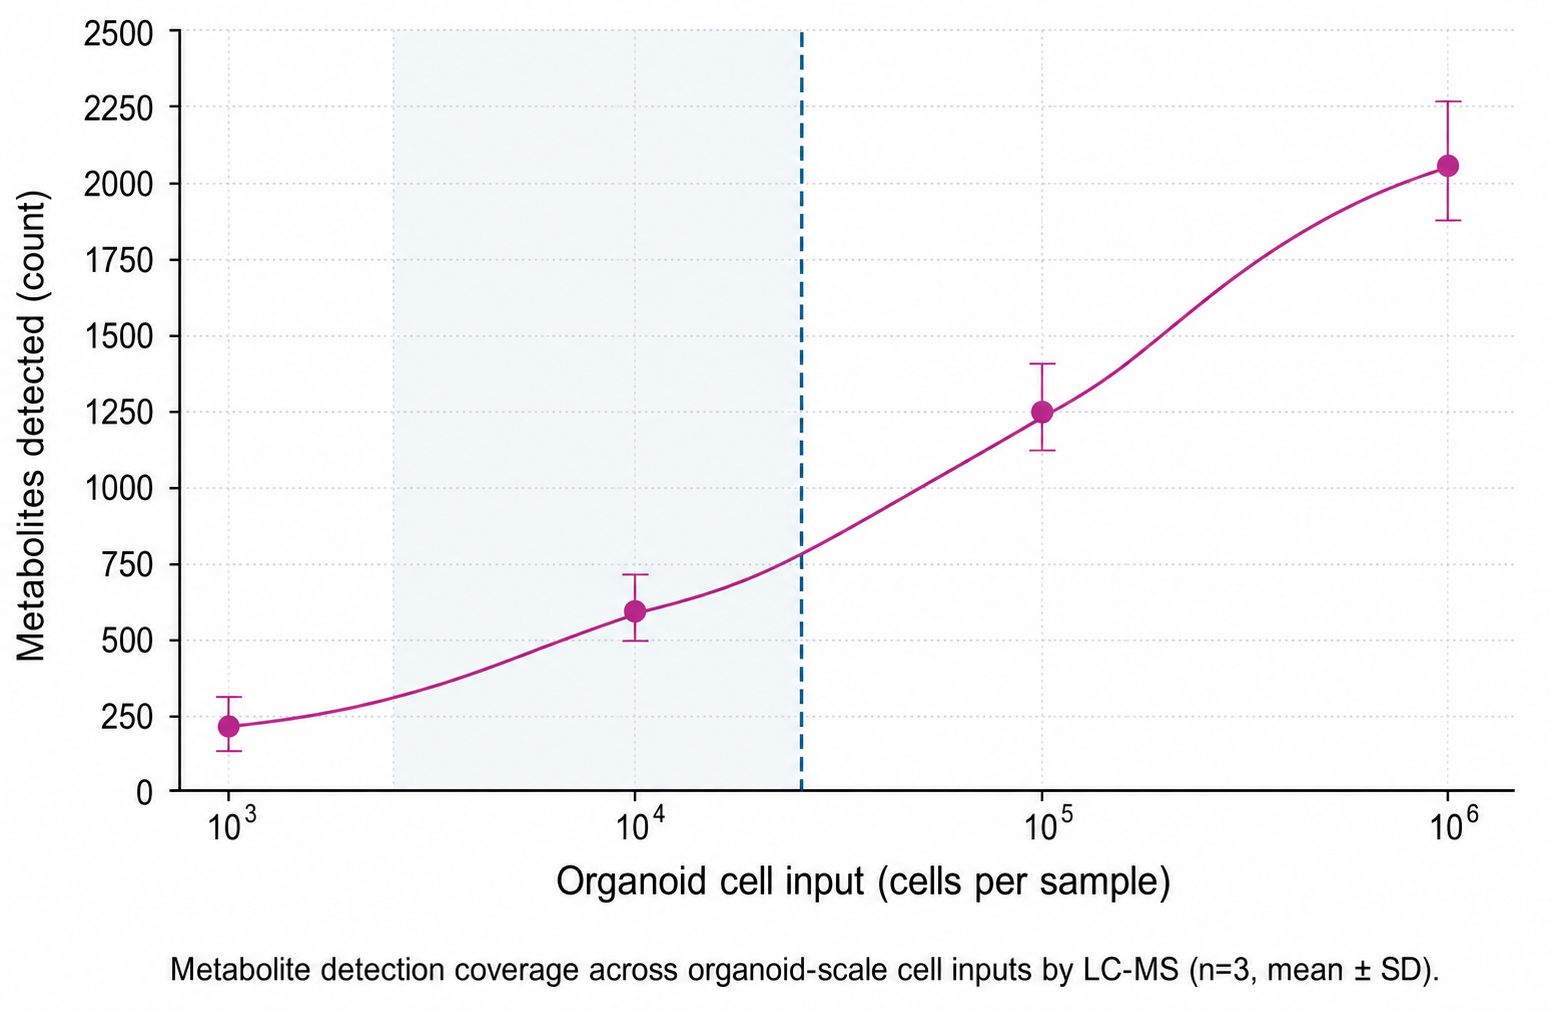
- Organoid-scale cell numbers fall below 2D validation ranges. Standard extraction
protocols built for 2D pellets either fail on low-input samples or lose labile metabolites. Our workflows
are validated from approximately 5,000 organoid cells per sample, with targeted panels demonstrated from
~500 cells.
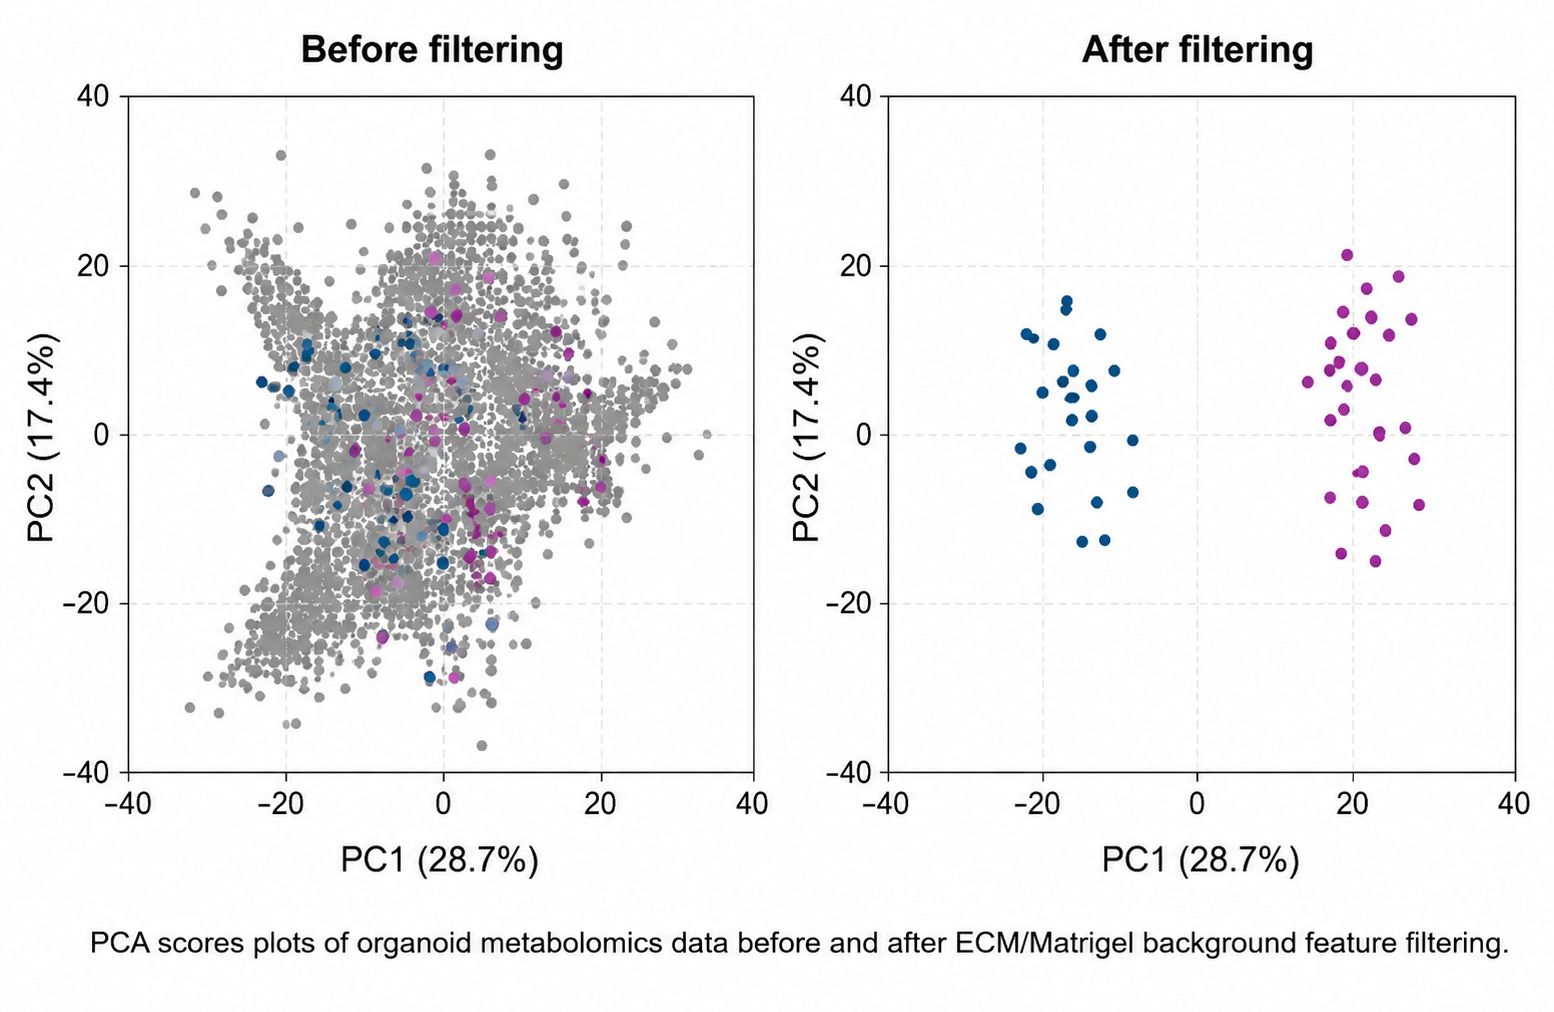
- ECM and Matrigel co-extract with the organoid. Organoids are grown inside hydrogel
matrices, and generic protocols co-extract hydrogel components that dominate the analytical signal.
Gel-matched blanks and a validated background-filtering step exclude these components before analysis, so
hydrogel-derived signals are not carried into the biological dataset.
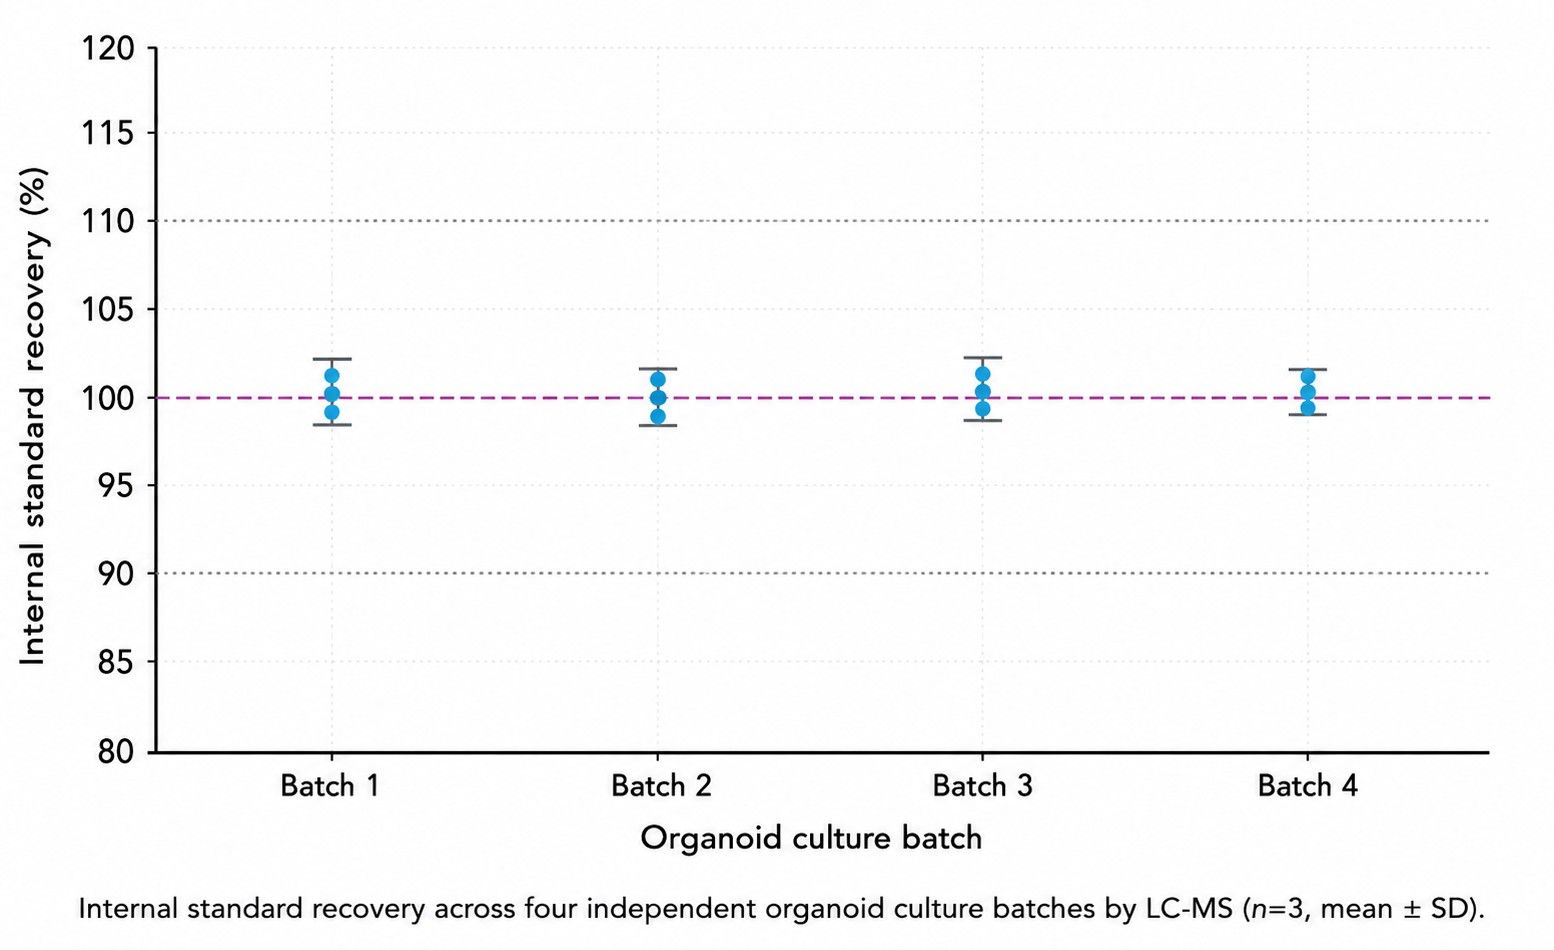
- Low-input, matrix-containing samples exceed generic QC assumptions. Recovery varies and
batch drift is higher, so isotope-labeled internal standards, pooled QC samples and gel-matched controls
are integrated into every run from the start.
Organoid vs 2D-Cell, Tissue and Animal
Metabolomics — Which Model Answers Your Question?
Organoid metabolomics answers a different question than 2D-cell, tissue or animal-model studies. Choosing
the right system starts with what each one can and cannot tell you:
| Dimension |
Organoid Metabolomics |
2D Cell |
Tissue |
Animal Model |
| Human relevance |
High — native 3D architecture, cell-cell and ECM interactions |
Limited — flat culture, no tissue context |
High, but donor and cohort heterogeneity |
Moderate — species differences |
| Sample input needed |
Low — ~5,000 cells per sample |
Moderate — 105–106 cells |
High — milligram tissue |
High — whole-animal study |
| Matrix interference |
Managed — matrix-matched blanks and ECM/Matrigel filtering |
None |
Moderate |
Low |
| 3Rs compliance |
Fully compliant |
Fully compliant |
N/A |
Restricted |
| Best for |
Disease modeling, drug response, mechanism and biomarker studies |
High-throughput screening, 2D mechanistic work |
Clinical and pathology correlation |
Whole-body pharmacokinetics and safety |
For organoids grown in perfused microfluidic systems rather than static ECM culture, our organ-on-a-chip and MPS metabolomics service applies the same
low-input LC-MS workflows to chip-based models.
Why Choose Our Organoid Metabolomics Service?
We designed this service around what organoid projects require: low-input sensitivity, ECM-aware sample
preparation, and reproducible, interpretable data. Workflows are validated on organoid-scale cell numbers
and ECM-containing samples before your project begins.
- Low-Input Validated
Workflows confirmed on organoid-scale cell numbers, not adapted from 2D protocols.
- ECM-Aware
Matrix-matched blanks and background filtering remove Matrigel interference.
- Quantification Path
Untargeted discovery and targeted absolute quantification on one platform.
- QC-Transparent
Internal standard recovery, pooled QC RSD and batch drift reported in every project.
- Scientist-to-Scientist
Feasibility and method design confirmed with you before the project starts.
Organoid metabolomics is not a scaled-down version of tissue metabolomics. Capturing the full organoid
metabolome requires instrumentation and methods matched to small sample masses, and our platform combines
three complementary capabilities — untargeted discovery, targeted quantification and organoid lipidomics —
on one workflow.
Untargeted discovery — High-resolution Orbitrap/Q-TOF mass spectrometry with polarity
switching captures 1,000+ features per organoid sample, covering polar metabolites, amino acids, nucleotides
and central carbon intermediates. MS/MS spectra are matched against HMDB, METLIN and our in-house libraries
for confident annotation.
Targeted absolute quantification — Triple-quadrupole MRM panels quantify defined
metabolite sets with isotope-labeled internal standards and multi-point calibration. This moves you from
discovery hits to validated, decision-grade concentrations (nM or µmol/g).
Organoid lipidomics — Complementary reverse-phase and HILIC lipid workflows cover
phospholipids, sphingolipids, glycerolipids and fatty acids from the same 3D culture, enabling parallel
metabolome and lipidome interrogation.
Method breadth for organoid-scale samples — Beyond LC-MS, we extend organoid metabolomics
with gas chromatography-mass spectrometry (GC-MS) for volatile and derivatized metabolites, and capillary
electrophoresis-mass spectrometry (CE-MS) where nanoliter-scale injection suits the smallest organoid
samples. Where metabolite localization within an organoid matters, mass spectrometry imaging (MALDI-MSI)
complements whole-sample profiling.
| Detection Layer |
What You Get |
| Untargeted metabolome |
1,000+ features; polar metabolites, amino acids, nucleotides, central carbon |
| Targeted panels |
150+ metabolites; absolute quantification with isotope-labeled standards |
| Lipidome |
Phospholipids, sphingolipids, glycerolipids, fatty acids |
| Sensitivity |
LLOQ down to sub-nanogram levels; validated from organoid-scale input |
| Background control |
ECM/Matrigel filtering with matrix-matched blanks |
| Interpretation |
KEGG/HMDB pathway mapping, PCA/PLS-DA, written mechanism summary |
For discovery-scale coverage across the wider platform, our untargeted metabolomics service surveys the full
metabolome and helps prioritize targeted organoid panels.
Organoid Metabolomics Workflow — From Organoid Sample to
Biological Report
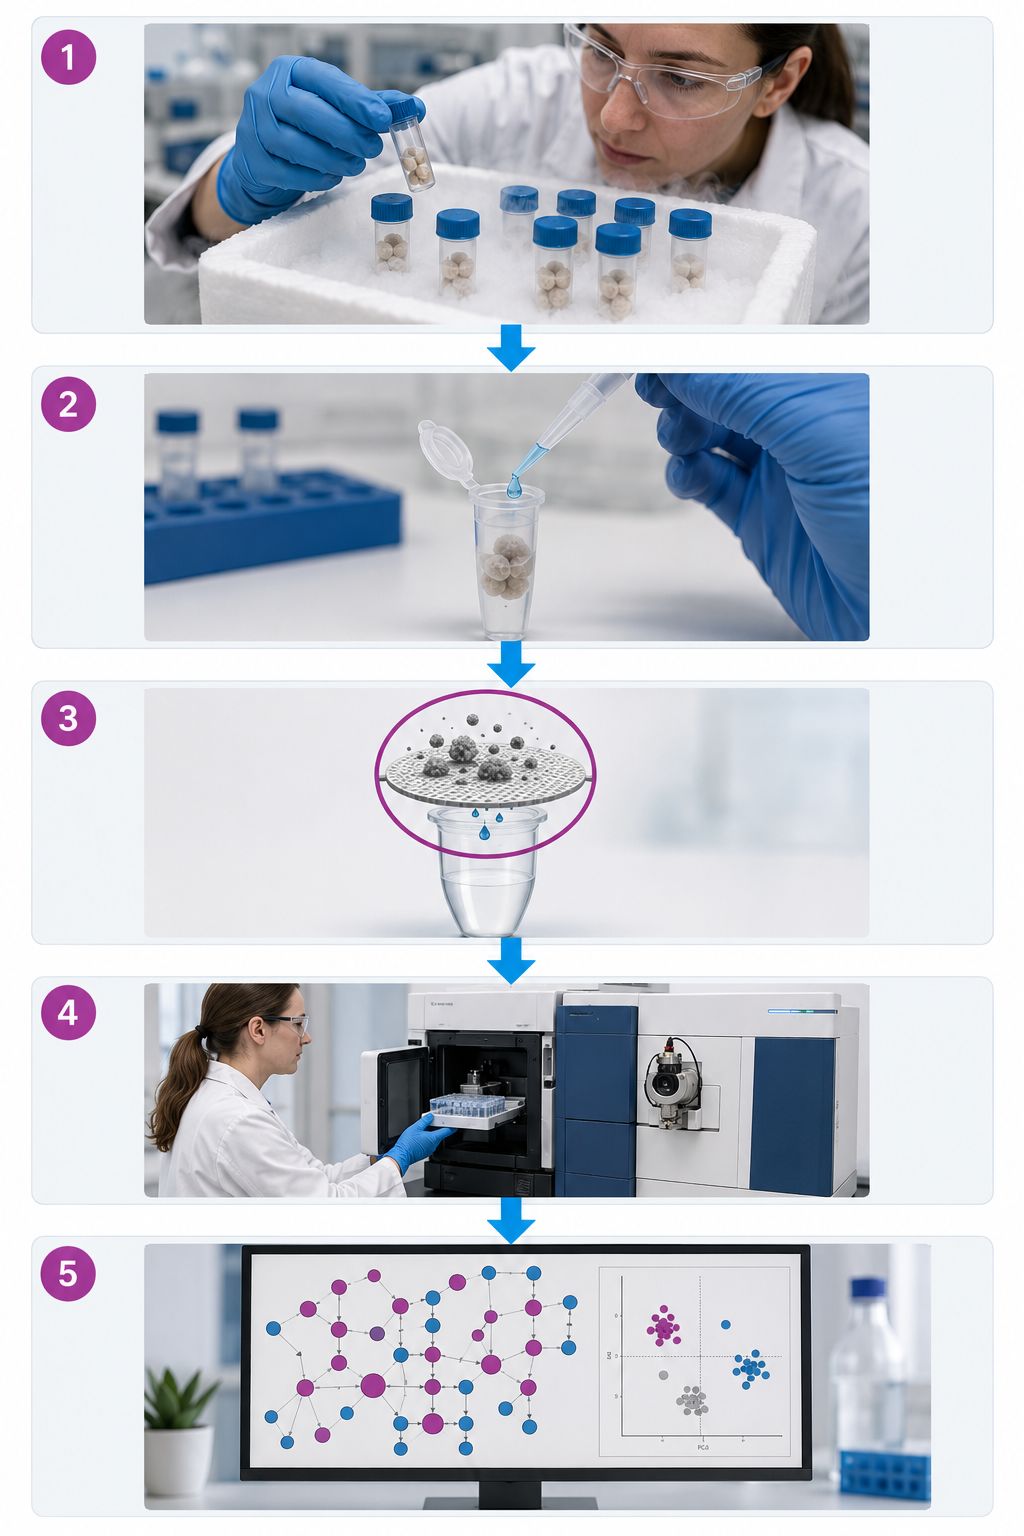
We designed every step for the constraints of 3D organoid culture. The workflow runs from sample receipt to
an interpreted biological report, and each stage is validated on organoid-scale input.
For studies requiring pathway turnover rather than steady-state levels, our metabolic flux analysis traces isotope-labeled precursors
through the same organoid samples.
Organoid Metabolomics Sample Requirements — Intact
Organoids, Lysates, Pellets and Conditioned Medium
| Parameter |
Guidance |
| Organoid types |
PDOs (tumor), intestinal, liver, kidney, brain, lung, retinal, cardiac organoids and spheroids
|
| Sample format and recommended input |
Organoid lysates or cell pellets: ≥ 5,000 cells per sample (targeted panels demonstrated from ~500
cells); intact organoids in Matrigel/ECM: ≥ 1×10⁴ cells per sample; conditioned medium: ≥
100 µL per sample |
| Biological replicates |
4–6 per group recommended for statistical power |
| Storage |
−80°C, on dry ice for shipping |
| Matrix note |
Matrigel/ECM-containing samples accepted; indicate matrix type at submission |
| Controls |
Matrix-matched blanks strongly recommended; we provide guidance |
Notes
- Send organoids pre-cultured, or ask our scientists for culture and harvesting guidance before you start
- Sample requirements are confirmed with you before the project begins
- Input levels, replicates and controls are agreed up front rather than discovered later
Organoid Metabolomics Data Analysis and Deliverables —
Raw Data to Decision-Ready Reports
Each project delivers a standardized data package with documented QC and full auditability:
- Raw LC-MS data files:mzML and vendor format for RP and HILIC acquisitions
- Processed feature matrix:retention time, m/z, adduct assignment, per-sample intensities
- Annotated metabolite table:HMDB accessions with annotation confidence levels
- Differential analysis:volcano plots, fold-change and FDR statistics
- Pathway enrichment:KEGG maps ranked by impact score and FDR
- Multivariate statistics:PCA scores plots, PLS-DA and permutation tests
- Written interpretation:mechanism hypotheses translated from pathway findings
- QC report:internal standard recovery, pooled QC RSD, batch drift metrics
Reports are structured so every reported value can be traced to its source measurement. For multi-batch or
multi-condition organoid studies, our metabolomics data
analysis team can extend the core deliverable with cohort-scale statistics and custom visualization.
Organoid Metabolomics Applications — PDOs, Disease
Modeling and Drug Screening
Our organoid metabolomics service supports researchers across disciplines where 3D culture models drive
decisions:
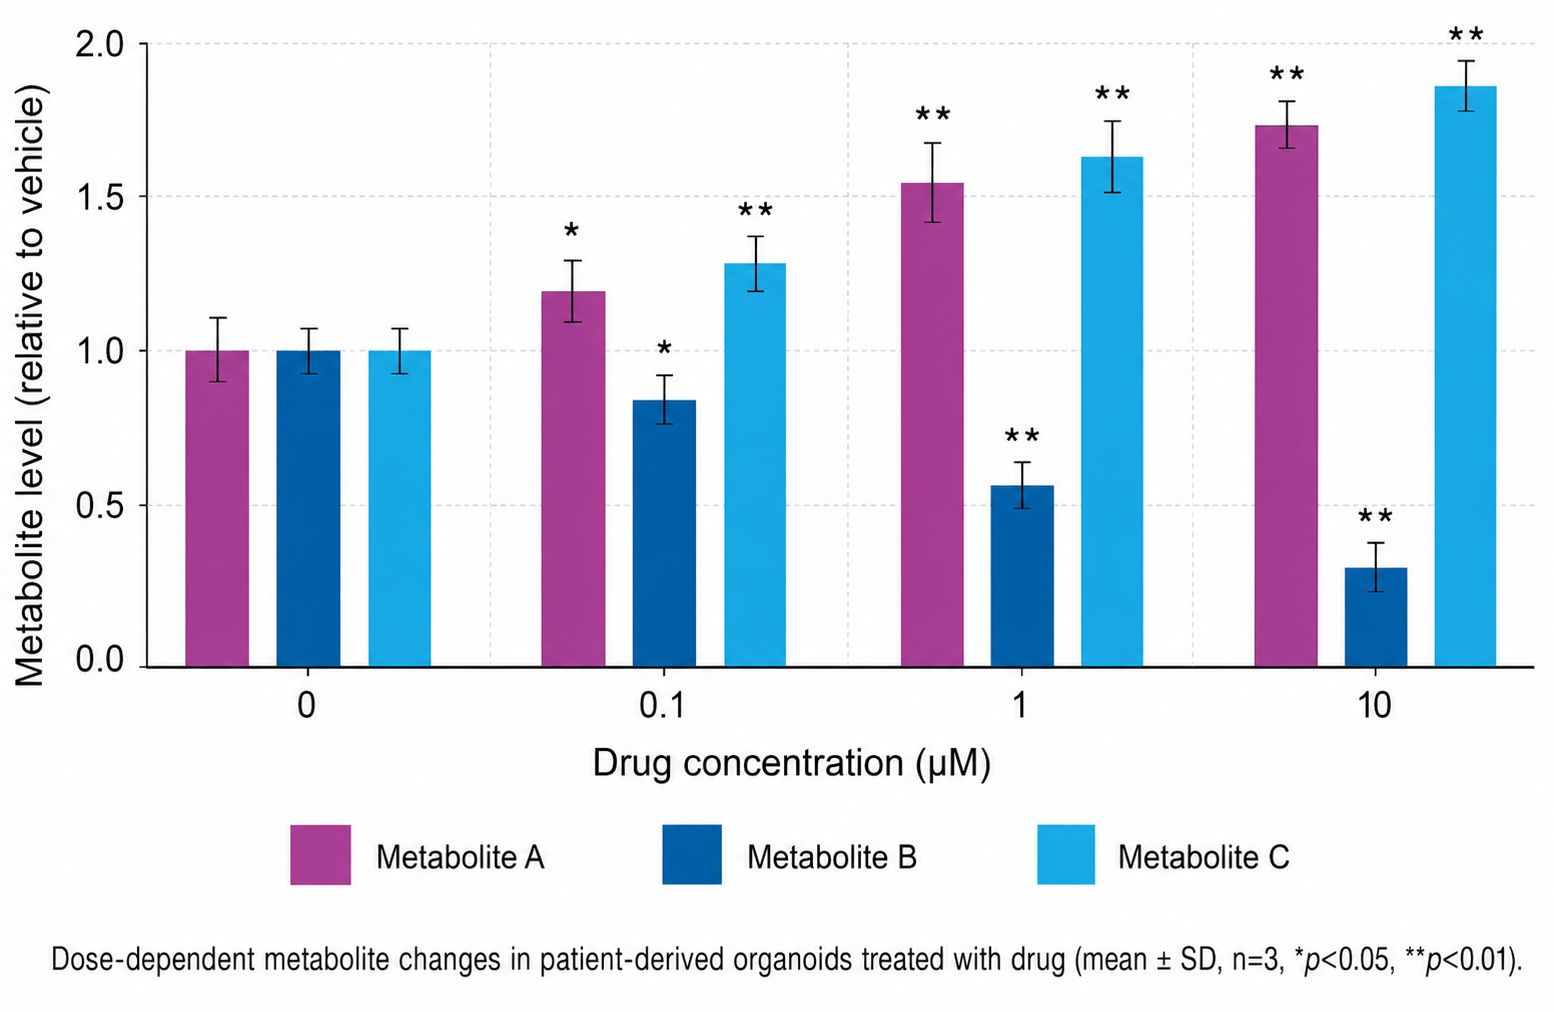
- PDO Drug Response Profiling — Profile metabolic phenotype shifts across drug doses,
dose combinations, and resistance states in patient-derived organoids, supporting screening,
mechanism-of-action studies, and biomarker discovery
- Disease Modeling and Stem Cell Maturation — Track metabolic rewiring in intestinal,
brain, hepatic, retinal, and lung organoids; qualify maturation stage and batch consistency before
downstream experiments
- Metabolic Toxicity and Safety Screening — Detect xenobiotic-induced metabolic shifts in
liver and kidney organoids earlier than endpoint assays
- Precision Oncology and Drug Resistance — Profile tumor organoids across drug gradients
to reveal metabolic mechanisms of sensitivity and resistance
Patient-derived tumor organoids preserve patient-specific heterogeneity, and their metabolome reveals
drug-induced pathway shifts that viability assays miss. We profile metabolic phenotypes across drug doses,
dose combinations and resistance states to support screening, mechanism-of-action studies and biomarker
discovery.
Intestinal, brain, hepatic, retinal and lung organoids model human-specific biology that rodents cannot.
Metabolomics tracks metabolic maturation, nutrient sensing and disease-associated rewiring, and because
metabolic state is both a marker and driver of stem cell fate, the same measurements help qualify organoid
quality, maturation stage and batch consistency before downstream experiments.
Liver and kidney organoid models extend organoid metabolomics to research toxicology and safety screening:
metabolic responses to xenobiotics can surface toxicity signals earlier than endpoint assays, and tumor
organoids profiled across drug gradients support precision-oncology stratification and drug resistance
studies. Secreted metabolites in conditioned medium add a non-destructive, longitudinal readout from the
same cultures.
Where metabolite localization within an organoid is required, our spatial metabolomics services (MALDI-MSI) map molecular
distributions across organoid sections; for cell-level heterogeneity, single-cell metabolomics profiles individual cells within
the same model.
Metabolomics Decodes the GCN2–p53 Metabolic
Axis in Prostate Cancer Organoids
Background
The eIF2 kinase GCN2 and the integrated stress response are constitutively active in prostate cancer,
maintaining amino acid homeostasis that fuels tumor growth. A research team investigating whether GCN2 loss
could be leveraged therapeutically needed to understand the downstream metabolic consequences — and validate
them across model systems, including organoids.
Challenge:
Define the metabolic mechanism downstream of GCN2 inhibition and confirm that dual targeting kills cancer
cells in human-relevant models, from cell lines through organoids to xenografts.
Analytical Approach
In the published study, untargeted LC-MS metabolomics of GCN2-inhibited (GCN2iB) LNCaP prostate cancer
cells captured changes across purine, pyrimidine and pentose phosphate metabolism. The authors then
validated mechanistic predictions in prostate cancer cell lines, organoids and xenograft models.
Key Findings (from the published study)
| Finding |
Evidence |
| GCN2 inhibition depletes purine nucleotides |
Untargeted metabolomics (Figs. 5A–5B): reduced purine, pyrimidine and pentose phosphate
intermediates |
| Purine loss impairs ribosome biogenesis |
Triggers the impaired ribosome biogenesis checkpoint |
| p53-dependent senescence program is induced |
GCN2 loss activates pro-senescent p53 signaling, promoting survival of GCN2-deficient cells |
| Dual targeting kills cancer cells across models |
GCN2 loss + p53 loss or de novo purine biosynthesis inhibition reduced proliferation and enhanced
cell death in cell lines, organoids and xenografts |
What this means for your organoid program:
- Metabolomics exposes the mechanism behind drug efficacy, not just the endpoint — here, purine depletion
as the trigger for senescence.
- Organoid validation translates 2D-cell metabolic findings toward in vivo relevance before expensive
animal studies.
- Purine/pyrimidine and pentose phosphate pathways are actionable metabolic checkpoints for combination
therapy design.
- Metabolic phenotypes measured in organoids are directly comparable across genetic backgrounds and drug
combinations.
- Quantified metabolite data supports pipeline go/no-go decisions with full traceability.
Conclusion
This published example shows how organoid-coupled metabolomics converts a mechanistic hypothesis into
cross-model validation with quantified metabolic evidence — the same workflow we run for organoid customer
projects.
Reference
- Cordova, R.A., Sommers, N.R., Law, A.S., Klunk, A.J., Brady, K.E., Goodrich, D.W., Anthony, T.G.,
Brault, J.J., Pili, R., Wek, R.C., Staschke, K.A.
Coordination
between the eIF2 kinase GCN2 and p53 signaling supports purine metabolism and the progression of
prostate cancer. Science Signaling 17(864) (2024).
Coordination between the eIF2 kinase GCN2 and p53 signaling supports purine metabolism and the progression of prostate cancer
Cordova, R.A., Sommers, N.R., Law, A.S., Klunk, A.J., Brady, K.E., Goodrich, D.W., Anthony, T.G., Brault,
J.J., Pili, R., Wek, R.C., Staschke, K.A.
Journal: Science Signaling
Year: 2024
DOI:
https://doi.org/10.1126/scisignal.adp1375
Metabolomics-based mass spectrometry methods to analyze the chemical content of 3D organoid models
Murphy, S.E., Sweedler, J.V.
Journal: The Analyst
Year: 2022
DOI:
https://doi.org/10.1039/d2an00599a


 Contact Us



