15N Metabolic Flux Analysis — Resolving Nitrogen Fate and Transamination Dynamics
Nitrogen is an indispensable elemental component of amino acids, purine and pyrimidine nucleotides, polyamines, glutathione, and neurotransmitters. However, because nitrogen atoms undergo rapid, reversible transamination across multiple transaminases (GOT/AST, GPT/ALT, PSAT1, BCAT) and deamination via glutamate dehydrogenase, nitrogen fluxes decouple from carbon skeleton trajectories and cannot be determined by carbon isotope tracing alone.
Stable isotope 15N metabolic flux analysis (15N-MFA) tracks the transfer and incorporation velocity of nitrogen atoms across complex biochemical networks to calculate in vivo reaction rates. As part of our comprehensive metabolic flux analysis service, targeted 15N-MFA provides quantitative resolution of cellular nitrogen economy. It enables you to:
(i) Differentiate amide-nitrogen versus amino-nitrogen allocation from glutamine into nucleotide synthesis versus non-essential amino acid transamination
(ii) Quantify inorganic ammonium assimilation efficiency via glutamate dehydrogenase (GLUD) and glutamine synthetase (GS)
(iii) Resolve hepatic ammonia detoxification capacity and urea cycle flux across carbamoyl phosphate synthetase 1 (CPS1), ornithine transcarbamylase (OTC), and argininosuccinate synthase (ASS1)
(iv) Track branched-chain amino acid (BCAA) nitrogen transfer to glutamate and alanine during metabolic stress, muscle wasting, and tumor progression.
What Analytical Challenges Do We Solve in 15N Fluxomics?
Key hurdles in nitrogen flux analysis include isobaric mass overlap between 15N (+0.9970 Da) and 13C (+1.00335 Da) isotopologues, extensive network reversibility in transamination, and rapid intracellular pool turnover. Creative Proteomics resolves these challenges with a dedicated 15N analytical workflow that is:
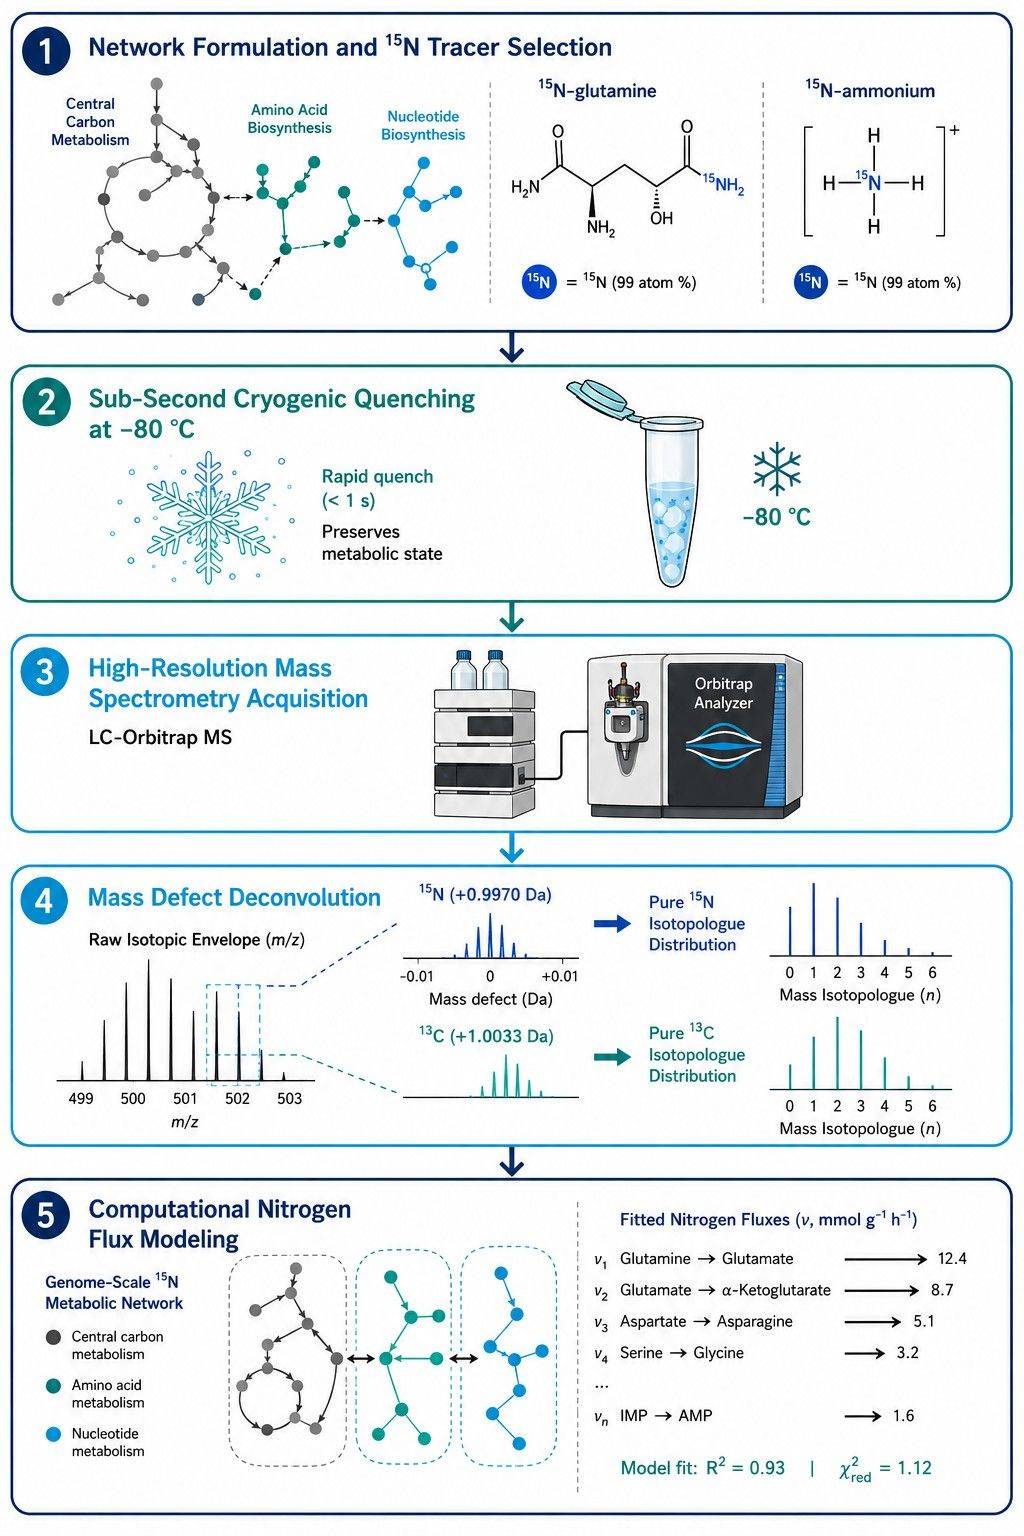
- Isotopically Resolved: Leveraging high-resolution Orbitrap mass spectrometry (>140,000 FWHM) to baseline-resolve 15N isotopic mass defects from isobaric 13C, 2H, and 18O species without spectral interference.
- Position-Specific: Employing distinct [amide-15N]glutamine, [alpha-15N]glutamine, [15N]glutamate, and [15N]ammonium tracers to isolate specific enzymatic transfer steps.
- Quantitatively Constrained: Combining intracellular 15N mass isotopologue distributions (MIDs) with quantitative amino acid and ammonia uptake/secretion rates measured via targeted metabolomics panels to calculate absolute molar flux rates.
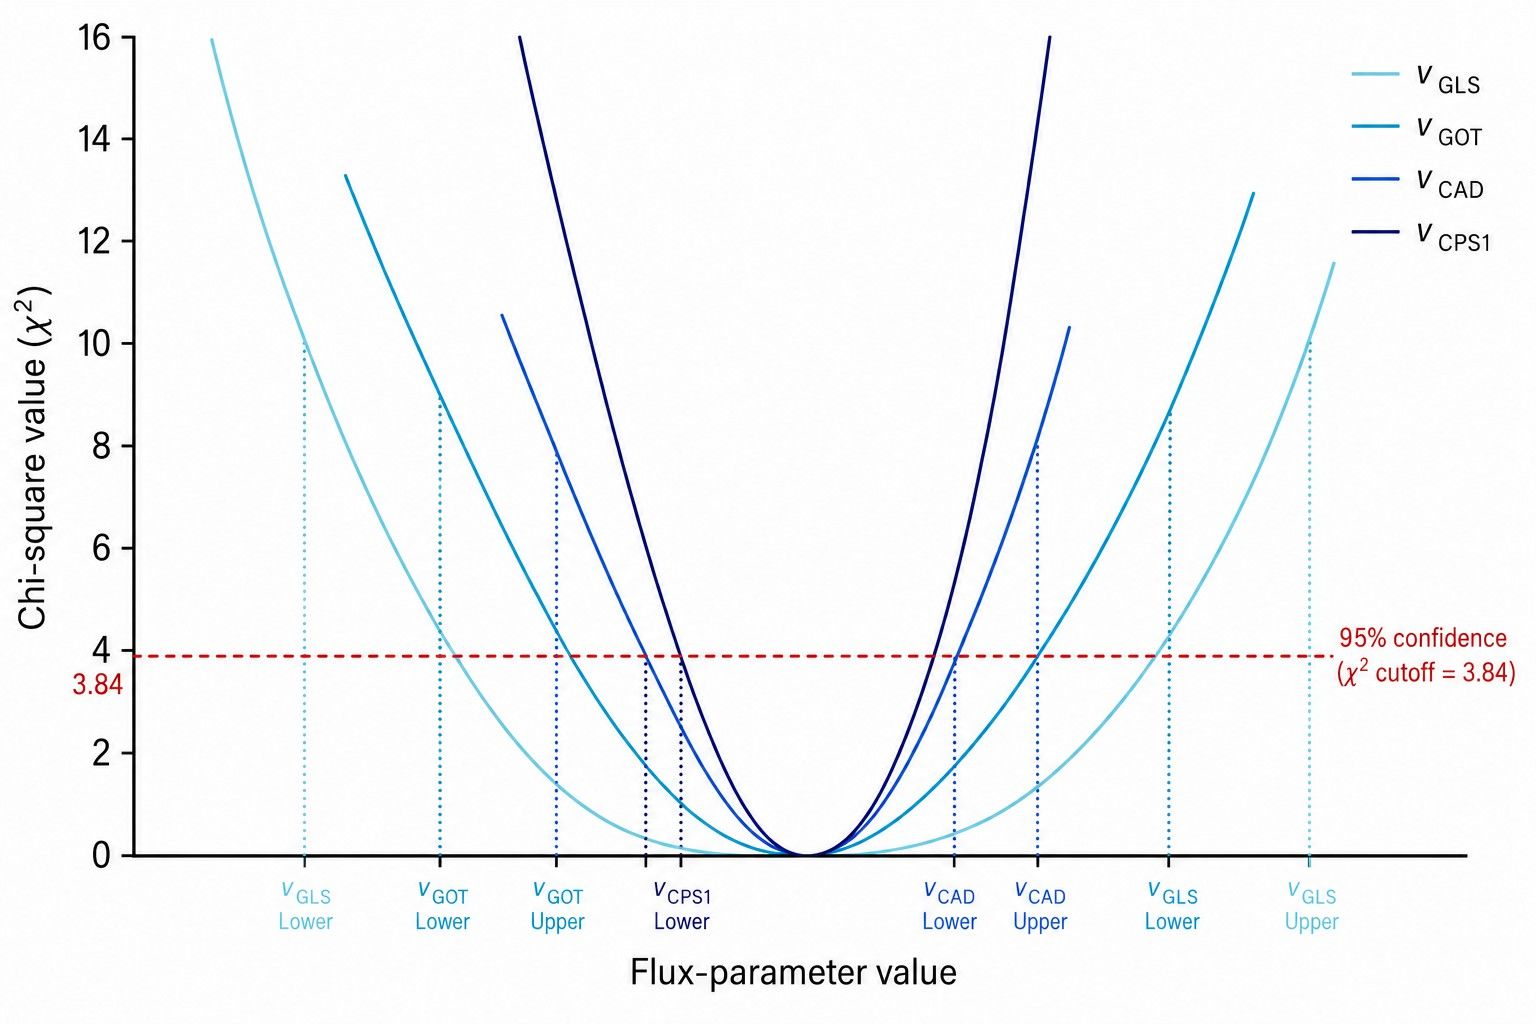
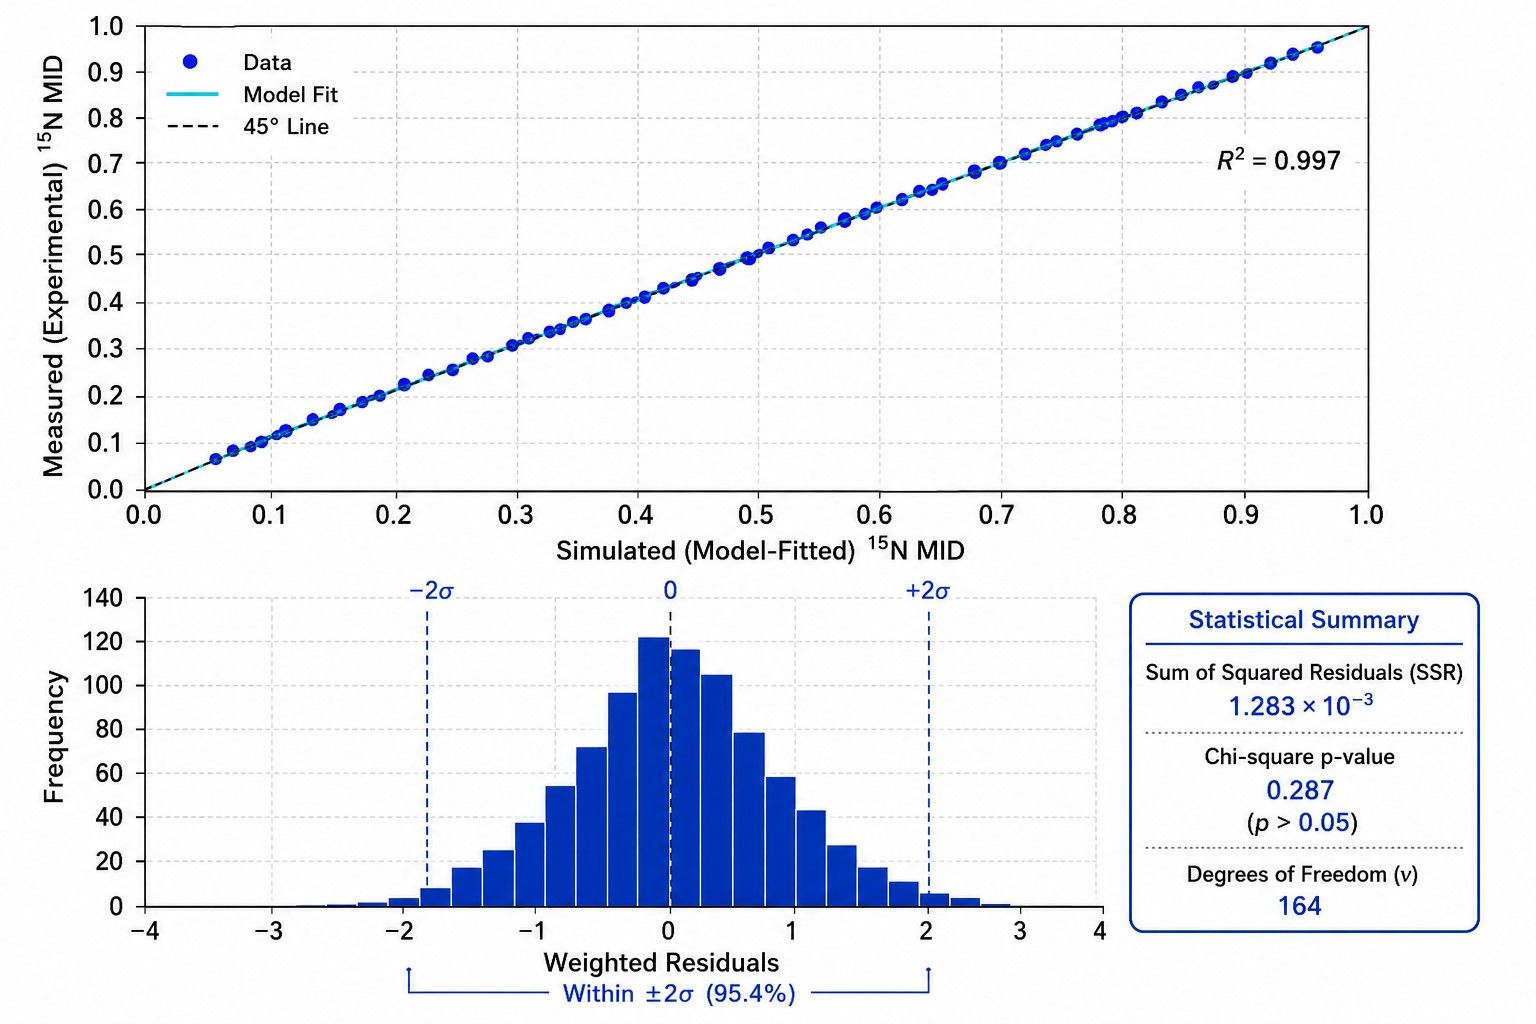
- Model-Validated: Implementing Elementary Metabolic Unit (EMU) network algorithms adapted for nitrogen stoichiometry with Chi-square goodness-of-fit testing and 95% profile likelihood confidence intervals.
Targeted 15N Tracer Selection Strategies: Resolving Specific Nitrogen Nodes
Creative Proteomics offers a comprehensive range of 15N stable isotope tracer configurations tailored to specific metabolic decision points across mammalian, microbial, and plant systems.
1. Standard 15N-Glutamine Tracing Panels
| Tracer Configuration |
Target Pathway Resolution & Readout |
| [amide-15N]Glutamine (γ-Nitrogen) |
Specifically tracks glutamine amidotransferase reactions. Labels carbamoyl phosphate for pyrimidine synthesis (CAD complex: M+1 UMP, CTP), PRPP amidotransferase for purine synthesis (M+1 IMP, AMP, GMP), and glucosamine-6-phosphate synthesis (GFPT1) without entering transamination cascades within our nucleotide metabolic flux analysis framework. |
| [α-15N]Glutamine (Amino-Nitrogen) |
Follows deamidation to glutamate and subsequent transamination. Labels aspartate (via GOT1/2), alanine (via GPT1/2), serine (via PSAT1), and phosphoserine in our amino acid metabolic flux analysis workflow. |
| [U-15N2]Glutamine (Dual Labeled) |
Measures total glutamine nitrogen utilization, simultaneously capturing both amidotransferase flux (M+1 nucleotides) and transamination flux (M+1 amino acids, M+2 purines) to determine overall nitrogen economy. |
2. Inorganic 15N-Ammonium & Amino Acid Tracing Panels
| Tracer Configuration |
Target Pathway Resolution & Readout |
| [15N]Ammonium ([15NH4]Cl / [15NH4]2SO4) |
Measures de novo ammonia assimilation kinetics via GLUD (M+1 glutamate), GS (M+1 glutamine amide), and carbamoyl phosphate synthetase 1 (CPS1). Standard for microbial fermentation and plant nitrogen use efficiency. |
| [α-15N]Aspartate & [15N]Glutamate |
Tracks direct amino group transfer into the urea cycle (argininosuccinate synthase flux) and purine ring synthesis (adenylosuccinate synthase flux) within our central carbon and nitrogen flux analysis module. |
| [15N]Glycine & [15N]Serine |
Quantifies glycine incorporation into purine C4-C5-N7 cores, glutathione tripeptide synthesis (GSH), and one-carbon transfer dynamics in our one-carbon metabolic flux analysis. |
3. Parallel & Dual 13C/15N Co-Tracing Panels
| Panel Strategy |
Key Applications & Network Constraints |
| Parallel [U-13C6]Glucose + [α-15N]Glutamine |
Independent labeling in parallel cultures fitted simultaneously in a unified stoichiometric model. Eliminates non-identifiability between carbon skeleton routing (glycolysis/TCA) and nitrogen transfer (transamination). |
| Dual-Labeled [U-13C5, 15N2]Glutamine |
Directly monitors intact carbon-nitrogen bond conservation during glutaminolysis, resolving glutaminase deamidation rates versus intact transport and transamination. |
| Isotopically Nonstationary 15N-MFA (INST-MFA) |
Applies short time-course sampling (seconds to minutes) to track rapid transamination transients in slow-growing cells and photosynthetic organisms via dynamic and INST metabolic flux analysis. |
4. Customization & Add-ons
| Category |
Options |
| Custom Tracer Synthesis |
Position-specific 15N, 13C/15N dual-labeled, or 18O-labeled precursors customized to client metabolic models |
| Nitrogen Boundary Rates |
Quantitative measurement of extracellular ammonia, urea, glutamine, glutamate, and amino acid consumption/excretion rates |
| Compartmentalized Fluxes |
Mitochondrial versus cytosolic transamination deconvolution via subcellular rapid fractionation |
| Complex Matrices |
Adaptable extraction protocols for co-cultures, fermentation broths, plant root/leaf tissues, and biofluids |
Why Choose Our 15N Metabolic Flux Analysis Service?
- High-Resolution Mass Defect Resolution (>140,000 FWHM)
Ultra-high-resolution Orbitrap mass spectrometry baseline-resolves 15N (+0.99703 Da) from 13C (+1.00335 Da) isotopic peaks, eliminating isobaric overlap in complex biological matrices without derivatization artifacts.
- Position-Specific Nitrogen Dissection
Targeted [amide-15N] versus [alpha-15N] glutamine strategies definitively separate amidotransferase-driven nucleotide synthesis from transaminase-driven amino acid pool replenishment.
- Sub-Second Cryogenic Quenching Protocols
Rapid sub-zero organic solvent quenching (-80 °C) arrests fast enzymatic transamination within seconds, preserving true in vivo nitrogen isotopologue distributions of labile metabolites.
- EMU Computational Modeling with Rigorous Statistics
Nitrogen transition networks are fitted using Elementary Metabolic Unit algorithms in INCA and 13CFLUX2, validated by Chi-square (χ²) goodness-of-fit testing and non-linear 95% profile likelihood confidence intervals.
Instrumentation & Method Parameters for 15N Isotopologue Profiling
Analytical Platform
High-Resolution LC-Orbitrap MS (Primary Platform)
Mass Spectrometer: Thermo Scientific Orbitrap Exploris 240 / 480 & Q-Exactive HF-X
Ionization Mode: Electrospray Ionization (ESI), Positive & Negative Polarity Switching
LC System: Vanquish Horizon UHPLC System
Chromatography: HILIC (SeQuant ZIC-pHILIC) & Reversed-Phase Ion-Pairing
Target Intermediates: Intact nucleotides (ATP, GTP, UTP, CTP, IMP), nucleotide sugars (UDP-GlcNAc), amino acids, urea cycle intermediates (citrulline, argininosuccinate, ornithine, arginine), and glutathione (GSH/GSSG)
Method Performance
| Parameter |
Typical Specification |
| Mass Resolving Power |
Up to 240,000 FWHM at m/z 200 |
| Mass Accuracy |
< 1.5 ppm internal calibration |
| 15N/13C Isobaric Separation |
Baseline resolved (Δm = 6.32 mDa) |
| MID Analytical Precision |
CV ≤ 1.5% across replicate injections |
| Linear Dynamic Range |
3.5–4 orders of magnitude |
| Injection Volume |
Typically 2–5 μL |
GC-MS & High-Field 15N-NMR (Orthogonal Platforms)
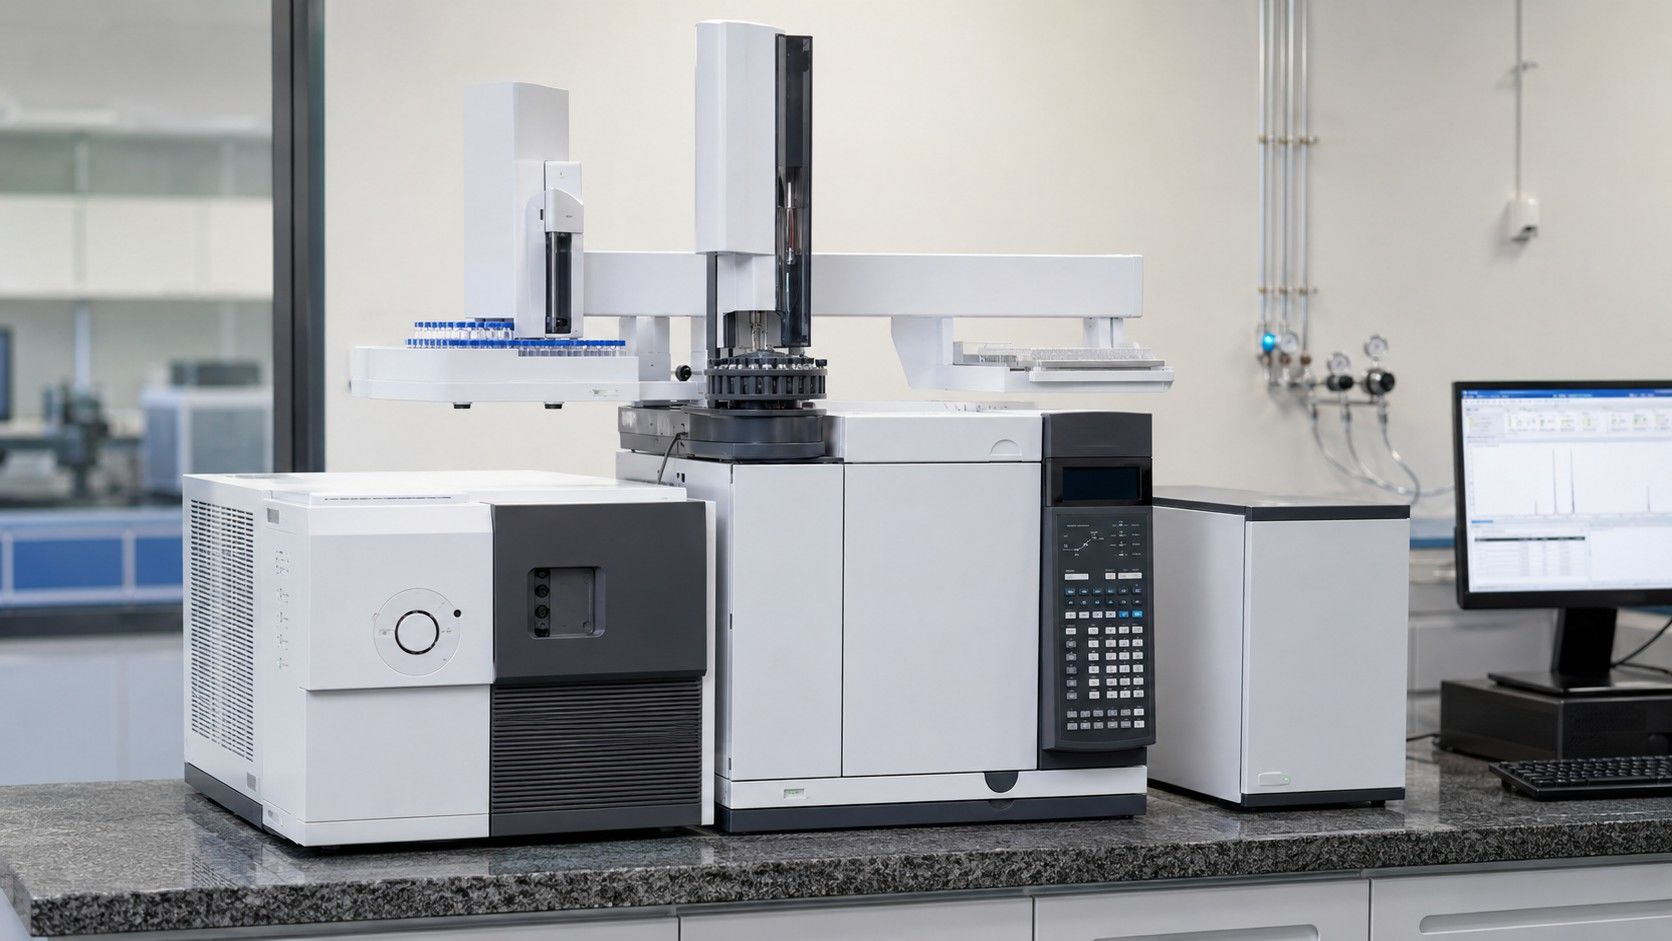
GC-MS provides fragment-level positional verification for derivatized amino acids, while our NMR-based metabolic flux analysis platform provides non-destructive 15N-1H HMQC and 15N direct detection.
- GC-MS Derivatization: TBDMS or chloroformate derivatization for amino acid backbone fragmentation
- GC-MS Column: DB-5ms UI (30 m × 0.25 mm × 0.25 μm), EI 70 eV
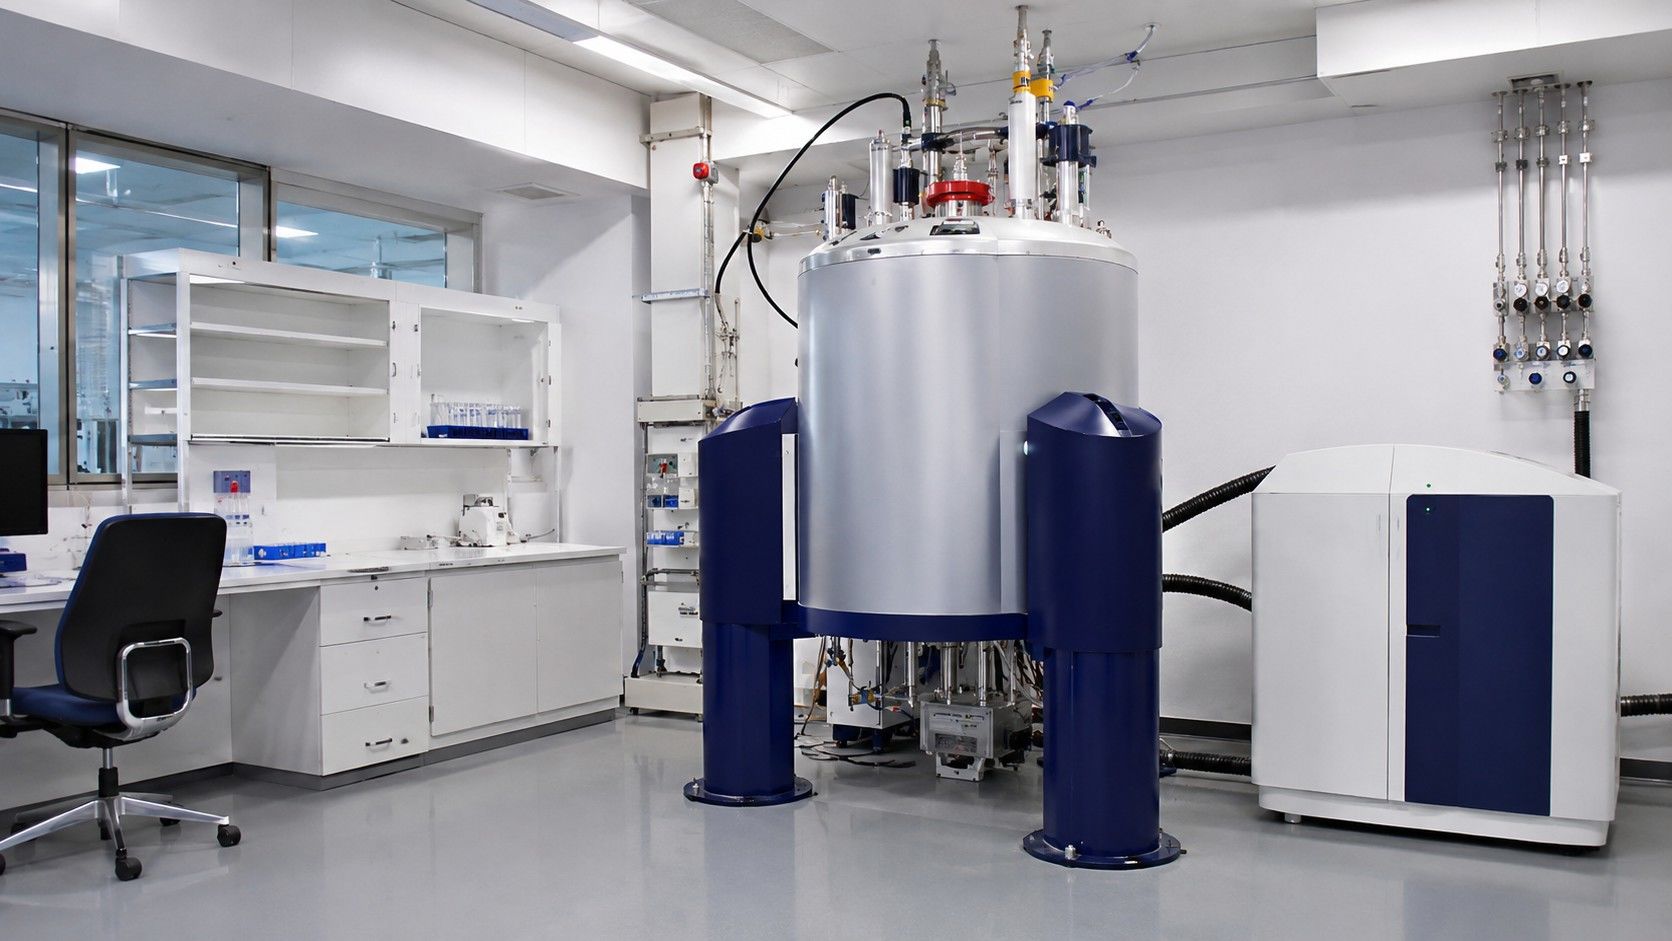
- 15N-NMR System: Bruker Avance III HD 600 MHz Spectrometer equipped with cryoprobe for direct 15N tracking
Quality Control & Boundary Constraints
- Spectral Quality Control: Retention time precision (CV < 0.5%), peak shape symmetry, and absence of detector saturation
- Natural Abundance Correction: Mathematical subtraction of 15N natural abundance (0.366%) and background heavy isotopes via validated deconvolution matrices
- Nitrogen Balance Constraints: Quantitative uptake (ammonia, amino acids) and excretion (urea, ammonia) rates utilized as fixed boundary conditions
15N Metabolic Flux Analysis Workflow — A Step-by-Step Guide
How to Prepare and Submit Samples for 15N-MFA
| Sample Type |
Amount Required |
Preparation & Quenching Instructions |
Storage & Shipping |
| Adherent Mammalian Cells |
1–10 × 106 cells (e.g. 60/100 mm dish) |
Aspirate medium (<3 s), rapid wash with ice-cold saline, add pre-cooled (-80 °C) 80:20 MeOH:H2O, scrape on dry ice. Avoid trypsinization. Retain parallel plate for cell count in mammalian cell metabolic flux analysis. |
Store at −80 °C; ship on dry ice |
| Suspension Cells |
2–10 × 106 cells |
Rapid cold centrifugation (4 °C, <2 min) or direct sub-zero buffered quenching (-40 °C). Avoid prolonged room-temperature washes. |
Store at −80 °C; ship on dry ice |
| Microbial Broth / Fermentation |
2–10 mg dry cell weight (OD-adjusted) |
Fast vacuum filtration (<2 s) with immediate liquid nitrogen filter immersion, or cold methanol quenching for microbial metabolic flux analysis. Retain supernatant for ammonia/amino acid exchange analysis. |
Store at −80 °C; ship on dry ice |
| Conditioned Media (Supernatant) |
≥ 200 μL |
Collect from matched labeling time points, centrifuge (10,000 × g, 5 min) to remove debris, aliquot supernatant for extracellular ammonia, glutamine, and urea quantification. |
Store at −80 °C; ship on dry ice |
| Plant Tissues (Leaves / Roots) |
20–100 mg wet weight |
Instant freeze-clamping in liquid nitrogen, cryo-pulverization under liquid nitrogen conditions without thawing for plant metabolic flux analysis. |
Store at −80 °C; ship on dry ice |
Notes
- Always retain parallel uncultured medium blanks and conditioned media to quantify extracellular nitrogen uptake and secretion rates
- Do not use enzymatic detachment (trypsin) for adherent cultures; perform direct in-plate cold solvent quenching
- Maintain continuous cold chain (−80 °C or dry ice) during sample storage and transport
- Contact our technical team prior to collecting specialized or low-biomass matrices
Deliverables: What You Receive from 15N Metabolic Flux Analysis
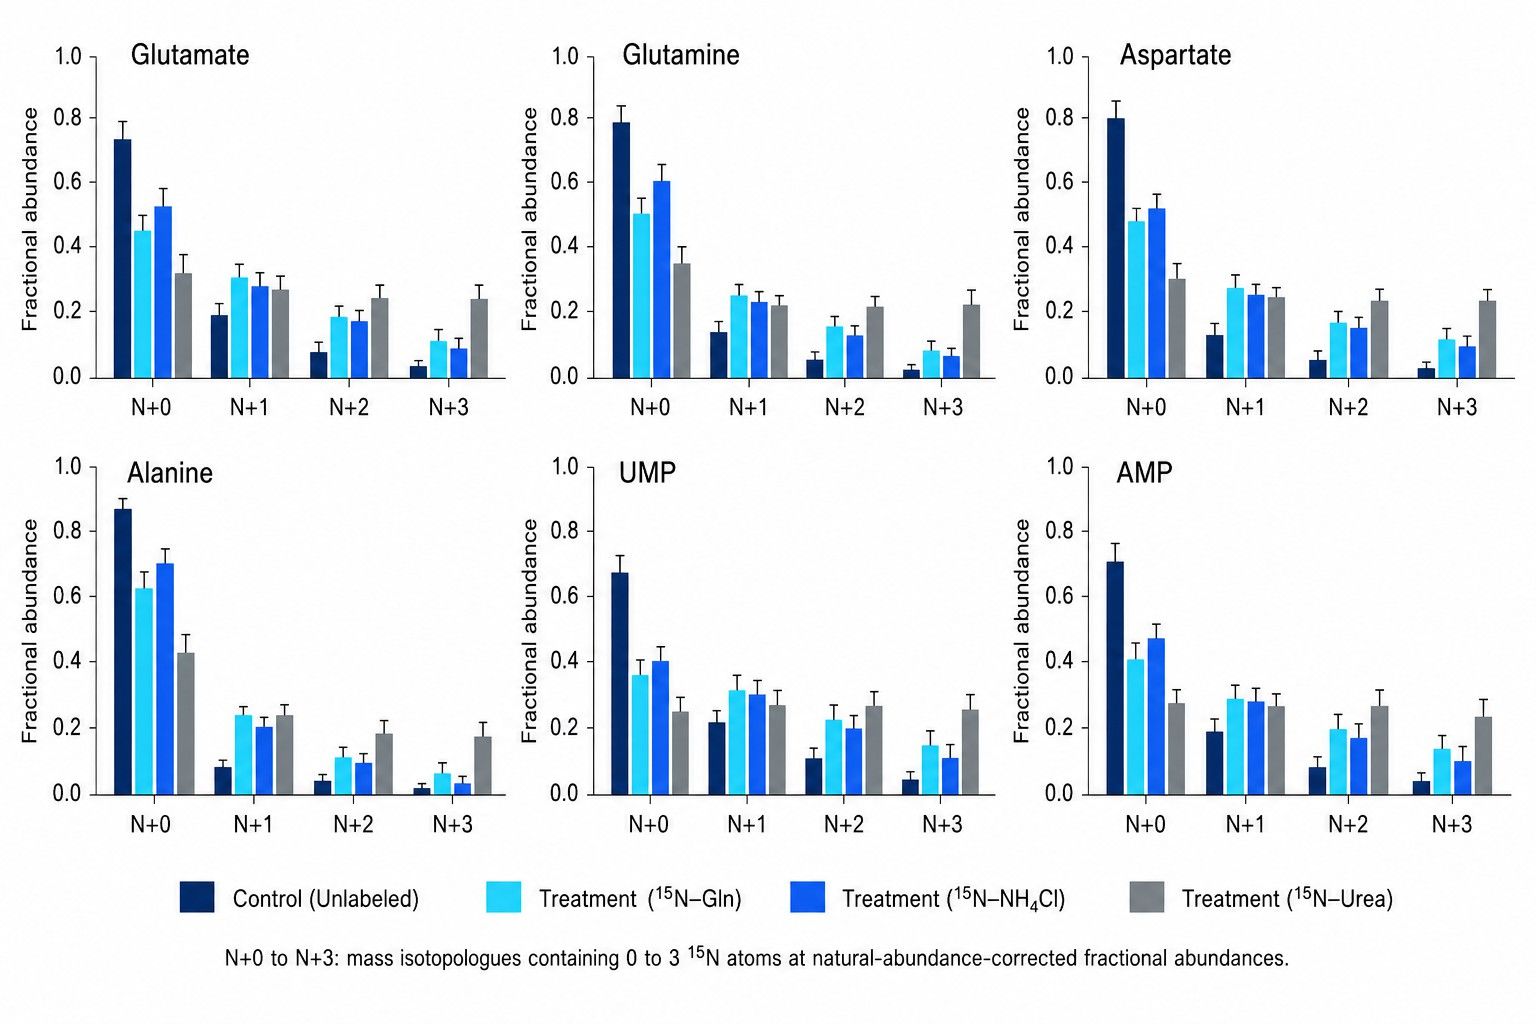
- Natural-Abundance-Corrected 15N MID Matrix: Fractional isotopic abundances (N+0 to N+n) for all target amino acids, nucleotides, and urea cycle intermediates (.csv / Excel).
- Extracellular Nitrogen Exchange Rates: Calculated absolute consumption and secretion rates for glutamine, glutamate, ammonia, and urea (mmol/gDW/h or nmol/106 cells/h).
- Reaction Network & EMU Nitrogen Model Files: Complete stoichiometric equations, nitrogen atom transition matrices, and executable project files (.xml / INCA / 13CFLUX2).
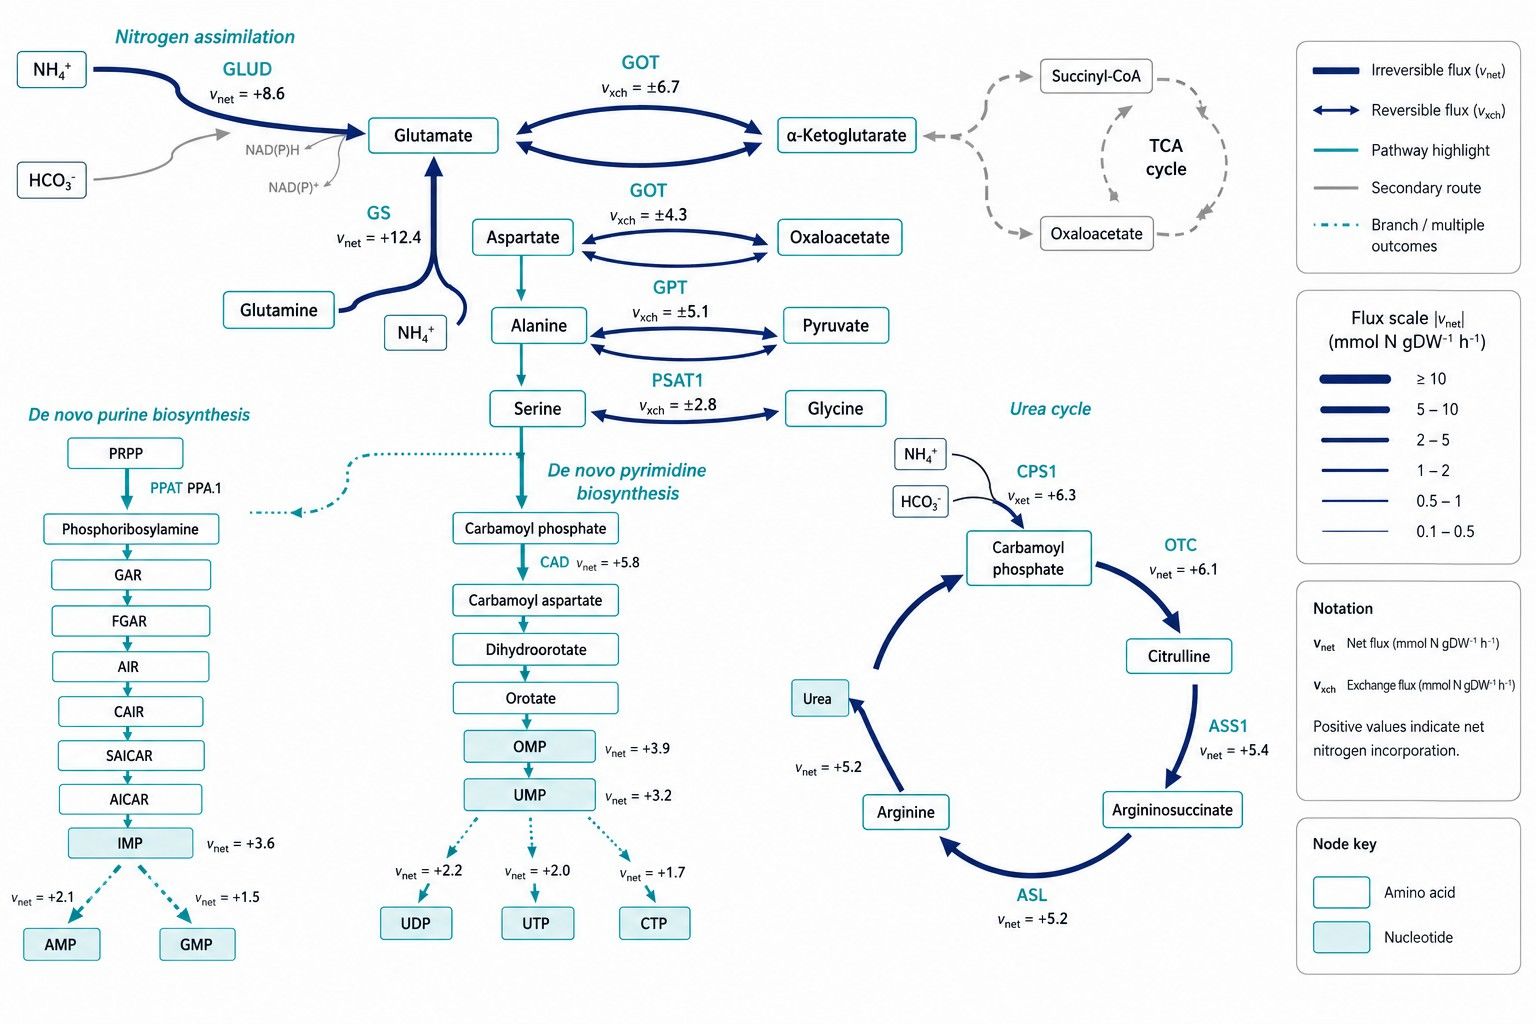
- Fitted Nitrogen Flux Values & Confidence Intervals: Estimated net (vnet) and exchange (vxch) fluxes with 95% profile likelihood confidence intervals.
- Statistical Diagnostics & Residuals: Chi-square (χ²) goodness-of-fit statistics, sum of squared residuals (SSR), and measured vs. simulated correlation plots.
- Publication-Ready Nitrogen Flux Maps: High-resolution vector graphics (PDF/SVG) illustrating intracellular nitrogen distribution with flux-scaled arrow widths, supported by comprehensive fluxomics data analysis.
Applications of 15N Metabolic Flux Analysis
Our 15N metabolic flux analysis service supports researchers across academic, biotechnology, and biopharma programs:
Resolving Arginine Nitrogen Transamination and Urea Cycle Intermediates in Neuroinflammatory Disease Models
Background
Arginine is a central nitrogen hub utilized for protein translation, nitric oxide (NO) generation, polyamine synthesis, and urea cycle transamination. In neurodegenerative and neuroinflammatory pathologies such as Huntington's disease (HD), hyperactive nitrogen metabolism and inducible nitric oxide synthase (iNOS) activation generate excessive reactive nitrogen species (RNS) and nitrosative stress. To elucidate how cellular nitrogen fluxes through arginine and urea cycle intermediates are altered in HD astrocytes and neuronal models, researchers performed quantitative targeted metabolomic profiling.
Challenge:
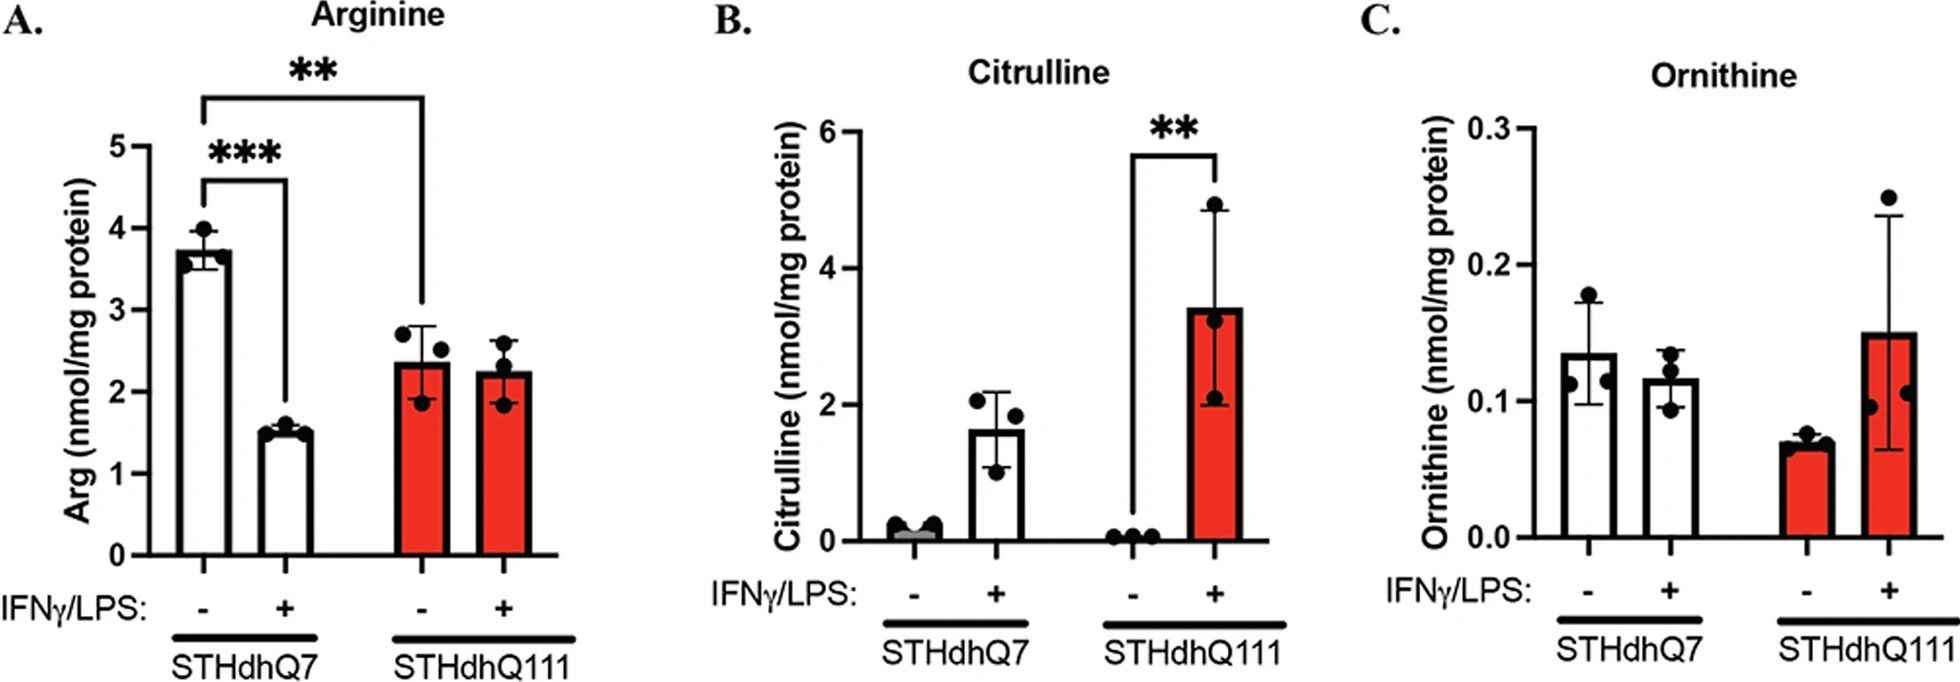
Quantify intracellular nitrogen-containing urea cycle metabolites (arginine, citrulline, ornithine) with high precision and determine how solute carrier transporter SLC7A2 modulation affects nitrogen flux into nitric oxide production versus transamination pathways.
Findings (from the published study)
- Selective Nitrogen Transporter Upregulation: SLC7A2, a high-affinity cationic amino acid transporter supplying arginine nitrogen, was selectively upregulated in HD cellular models and patient tissues.
- Hyperactive Nitrosative Flux: Inflammatory cytokine stimulation (IFN-γ/LPS) triggered heightened iNOS induction and excessive NO flux in HD cells, leading to downstream S-nitrosylation of mitochondrial fission proteins (DRP-1) and mitochondrial fragmentation.
- Urea Cycle Flux Disruption: Quantitative HPLC-MS/MS profiling of urea cycle metabolites revealed that genetic knockout of SLC7A2 or extracellular arginine deprivation completely abolished pathological NO production and normalized nitrogen partitioning.
- Therapeutic Validation: Modulating nitrogen substrate availability and urea cycle intermediate balance successfully protected mitochondrial morphology and attenuated inflammatory neurotoxicity.
Figure 4. Quantitative measurement of arginine and urea cycle nitrogen metabolites following inflammatory stimulation
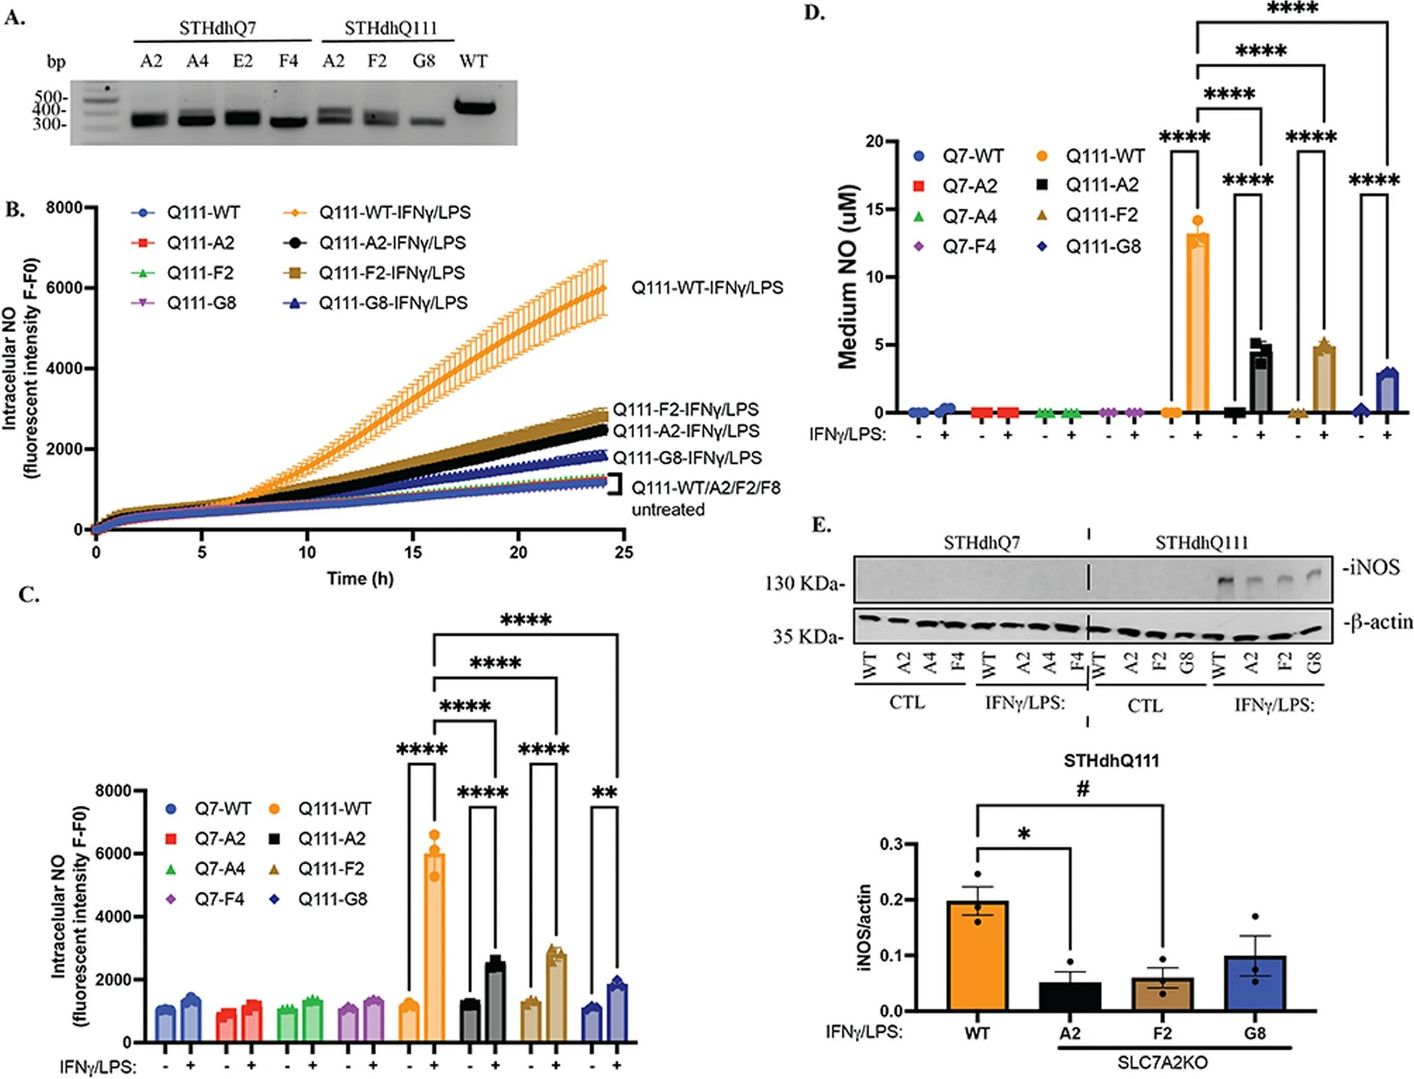 Figure 6. Schematic pathway of arginine nitrogen flux into nitric oxide synthesis versus urea cycle transamination
Process Insight
This study demonstrates how quantitative mass spectrometry of nitrogen-containing metabolites resolves complex transamination and nitrogen partitioning mechanisms, linking specific amino acid transporter expression to downstream nitrosative flux and organelle pathology.
Where Our 15N Metabolic Flux Analysis Service Fits
Creative Proteomics performed the quantitative mass spectrometry workflow for urea cycle and nitrogen-containing metabolites in this study, delivering end-to-end analytical support:
- Nitrogen Pathway Metabolite Quantification: Targeted HPLC-MS/MS assay with stable isotope internal standards for absolute quantification of arginine, citrulline, and ornithine.
- Sub-Second Quenching & Extraction: Standardized cell harvesting protocols minimizing post-sampling enzymatic transamination.
- Pathway Flux Interpretation: High-precision chromatographic deconvolution supporting biomedical insights into nitrogen metabolic rewiring.
Reference
- Gaudet ID, Xu H, Gordon E, et al. Elevated SLC7A2 expression is associated with an abnormal neuroinflammatory response and nitrosative stress in Huntington’s disease. Journal of Neuroinflammation. 2024;21(1):38.
Elevated SLC7A2 expression is associated with an abnormal neuroinflammatory response and nitrosative stress in Huntington's disease
Gaudet, I. D., Xu, H., Gordon, E., Cannestro, G. A., Lu, M. L., & Wei, J.
Journal: Journal of Neuroinflammation
Year: 2024
DOI: https://doi.org/10.1186/s12974-024-03038-2
Polyamine metabolism impacts T cell dysfunction in the oral mucosa of people living with HIV
Mahalingam, S. S., Jayaraman, S., Bhaskaran, N., Schneider, E., Faddoul, F., Paes Da Silva, A., ... & Pandiyan, P.
Journal: Nature Communications
Year: 2023
DOI: https://doi.org/10.1038/s41467-023-36163-2
Cancer SLC43A2 alters T cell methionine metabolism and histone methylation
Bian, Y., Li, W., Kremer, D. M., Sajjakulnukit, P., Li, S., Crespo, J., ... & Zou, W.
Journal: Nature
Year: 2020
DOI: https://doi.org/10.1038/s41586-020-2682-1
Suppression of the KRAS-NRF2 axis shifts arginine into the phosphocreatine energy system in pancreatic cancer cells
Di Giorgio, E., Choudhary, H., Ferino, A., Cortolezzis, Y., Dalla, E., D’Este, F., ... & Xodo, L. E.
Journal: iScience
Year: 2023
DOI: https://doi.org/10.1016/j.isci.2023.108566
Teriflunomide/leflunomide synergize with chemotherapeutics by decreasing mitochondrial fragmentation via DRP1 in SCLC
Mirzapoiazova, T., Tseng, L., Mambetsariev, B., Li, H., Lou, C. H., Pozhitkov, A., ... & Salgia, R.
Journal: iScience
Year: 2024
DOI: https://doi.org/10.1016/j.isci.2024.110132
Impaired ketogenesis ties metabolism to T cell dysfunction in COVID-19
Karagiannis, F., Peukert, K., Surace, L., Michla, M., Nikolka, F., Fox, M., ... & Kurts, C.
Journal: Nature
Year: 2022
DOI: https://doi.org/10.1038/s41586-022-05128-8
Hierarchical glycolytic pathways control the carbohydrate utilization regulator in human gut Bacteroides
Kabonick, S. G., Verma, K., Modesto, J. L., Pearce, V. H., Winokur, K. M., Groisman, E. A., & Townsend, G. E.
Journal: Nature Communications
Year: 2025
DOI: https://doi.org/10.1038/s41467-025-59704-3


 Contact Us



