13C Metabolic Flux Analysis — Resolving In Vivo Reaction Rates
Static metabolite profiling reveals pool sizes but cannot determine whether an altered concentration
reflects increased pathway synthesis, reduced consumption, or redirected branch-point flux. 13C metabolic
flux analysis (13C-MFA) solves this fundamental limitation by tracking the transfer of stable carbon-13
isotopes through intracellular biochemical networks to calculate the actual in vivo reaction rates (fluxes)
of enzymatic steps.
As part of our comprehensive metabolic flux analysis
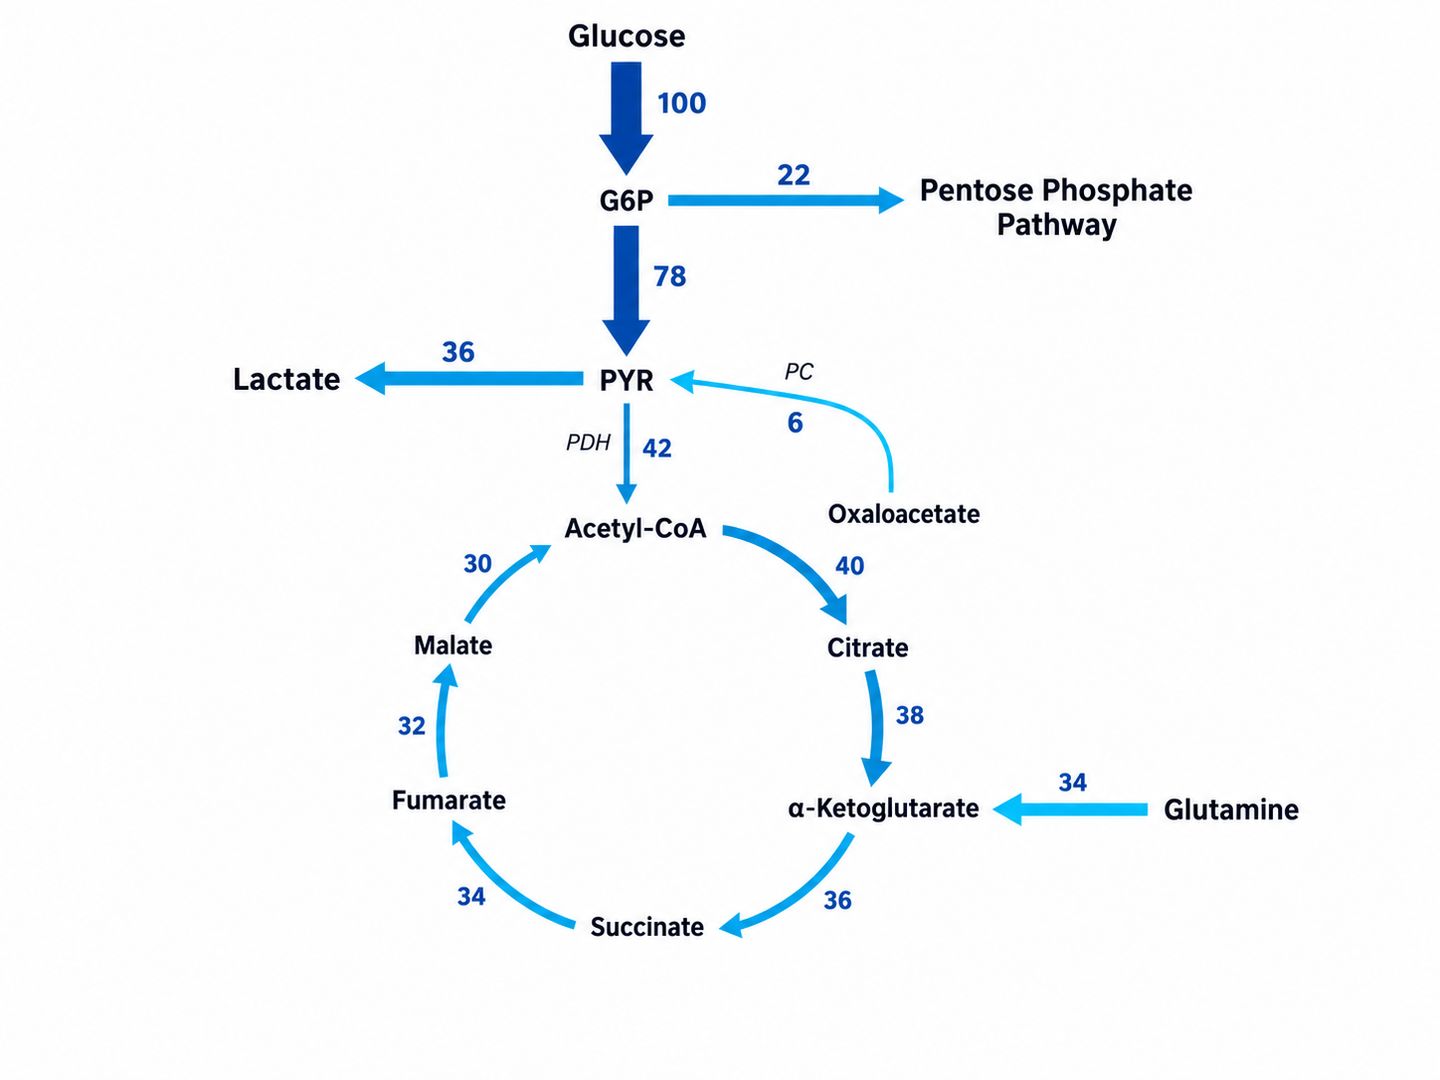
service, targeted 13C-MFA delivers quantitative insights into carbon skeleton distribution. It enables
you to:
(i) Differentiate mitochondrial carbon entry via pyruvate dehydrogenase (PDH) versus pyruvate carboxylase
(PC) anaplerosis
(ii) Quantify the exact split ratio between glycolysis and the oxidative pentose phosphate pathway (PPP)
(iii) Resolve forward oxidative TCA cycling versus IDH-mediated reductive carboxylation for lipid synthesis
(iv) Map carbon overflow and nutrient partitioning under genetic knockouts, environmental perturbations, or
therapeutic interventions.
What Analytical Challenges Do We Solve in 13C Fluxomics?
Accurate flux calculation requires precise isotopic measurements, rigorous correction routines, and
identifiable network models. Creative Proteomics resolves key industry bottlenecks through an integrated
workflow that is:
- Isotopically Resolved: High-resolution Orbitrap mass spectrometry (>140,000 FWHM)
resolves 13C isotopologues from overlapping 15N, 2H, and 18O isobaric species, ensuring pure mass
isotopologue distributions (MIDs).
- Quantitatively Constrained: Extracellular exchange rates (glucose, lactate, glutamine,
amino acids) are measured concurrently via targeted
metabolomics panels to provide absolute boundary conditions for stoichiometric fitting.
- Statistically Validated: Elementary Metabolic Unit (EMU) algorithms combined with
non-linear parameter estimation calculate 95% profile likelihood confidence intervals, establishing
parameter identifiability and eliminating ill-conditioned models.
- Artifact-Free: Fast sub-zero solvent quenching arrests enzymatic turnover in
sub-seconds, preserving true in vivo labeling states.
Targeted 13C Tracer Selection Strategies: Resolving Specific Metabolic Nodes
Creative Proteomics provides custom stable-isotope tracer configurations tailored to specific biological
questions and metabolic branch points across mammalian, microbial, and plant systems.
1. Standard Central Carbon Tracing Panels
| Tracer Configuration |
Target Pathway Resolution & Readout |
| [1,2-13C2]Glucose |
Resolves the split ratio between glycolysis (generating M+2 lactate/pyruvate) and the oxidative
pentose phosphate pathway (releasing 13CO2 to yield M+1 lactate/pyruvate)
within our pentose phosphate
pathway metabolic flux analysis framework. |
| [U-13C6]Glucose |
Measures glycolytic rate, pyruvate entry into TCA via PDH (M+2 citrate) vs. PC (M+3 malate,
M+3/M+5 citrate), and downstream anaplerotic networks in our glycolytic pathway metabolic flux
analysis service. |
| [U-13C5]Glutamine |
Differentiates forward oxidative TCA cycle flux (M+4 succinate, fumarate, malate) from reverse
reductive carboxylation (M+5 citrate, M+3 malate) supporting lipid biosynthesis in our TCA cycle pathway metabolic
flux analysis. |
2. Advanced Tracing & Co-Substrate Panels
| Tracer Configuration |
Target Pathway Resolution & Readout |
| [1-13C]Glucose & [6-13C]Glucose |
Independent parallel labeling experiments quantifying non-oxidative PPP reversibility and
transketolase/transaldolase exchange kinetics. |
|
[U-13C3]Lactate & [U-13C3]Pyruvate
|
Quantifies exogenous lactate/pyruvate uptake, oxidation, and gluconeogenic flux in liver and
cancer tissue models within our central carbon
metabolic flux analysis module. |
|
[U-13C16]Palmitate & [1,2-13C2]Acetate
|
Measures beta-oxidation rate, acetyl-CoA pool dilution, and de novo lipogenesis in our fatty acid metabolic flux analysis. |
| [U-13C3]Serine & [U-13C2]Glycine
|
Tracks one-carbon unit generation, folate cycle flux, and purine precursor synthesis in our one-carbon metabolic flux analysis. |
3. Customization & Add-ons
| Category |
Options |
| Custom Tracer Synthesis |
Deuterium (2H), nitrogen-15 (15N), or dual-labeled isotopes (13C/15N) tailored to client metabolic
models |
| Dynamic / INST-MFA |
Short-time-scale labeling for systems not in isotopic steady state via dynamic and INST metabolic flux analysis |
| Extracellular Rate Panels |
Quantitative measurement of medium consumption and secretion rates for absolute flux anchoring
|
| Complex Matrices |
Optimized protocols for 3D spheroids, tissue slices, co-cultures, plant organs, and fermentation
broths |
Why Choose Our 13C Metabolic Flux Analysis Service?
- High-Resolution Mass Spectrometry Platform
Ultra-high-resolution Orbitrap MS (>140,000 FWHM) eliminates spectral interference between 13C and other heavy isotopes (15N, 2H), providing highly accurate mass isotopologue distributions without chemical derivatization bias.
- Statistically Constrained EMU Network Modeling
We implement Elementary Metabolic Unit (EMU) algorithms in INCA and 13CFLUX2, evaluating parameter identifiability, Chi-square (χ²) goodness-of-fit, and rigorous 95% profile likelihood confidence intervals.
- Matrix-Specific Cryogenic Quenching Protocols
Standardized rapid sub-zero organic solvent quenching (-80 °C) arrests cellular enzymatic activity in sub-seconds, preventing post-harvest metabolic changes.
- Parallel & Multi-Tracer Experimental Capability
We design parallel labeling schemes (e.g. [1,2-13C2]glucose + [U-13C5]glutamine) fitted simultaneously within a unified stoichiometric model to resolve complex, overlapping metabolic networks.
Instrumentation & Method Parameters for 13C Isotopologue Profiling
Analytical Platform
High-Resolution LC-Orbitrap MS (Primary Platform)
Mass Spectrometer: Thermo Scientific Orbitrap Exploris 240 / 480 & Q-Exactive HF-X
Ionization Mode: Electrospray Ionization (ESI), Positive & Negative Polarity Switching
LC System: Vanquish Horizon UHPLC System
Chromatography: HILIC (SeQuant ZIC-pHILIC) & Reversed-Phase Ion-Pairing
Target Intermediates: Intact phosphorylated hexoses (G6P, F6P), trioses (DHAP, 3PG, PEP), organic acids
(citrate, alpha-KG, succinate, malate), amino acids, and nucleotides
Method Performance
| Parameter |
Typical Specification |
| Mass Resolving Power |
Up to 240,000 FWHM at m/z 200 |
| Mass Accuracy |
< 1.5 ppm internal calibration |
| MID Analytical Precision |
CV ≤ 1.0% across replicate injections |
| Linear Dynamic Range |
3.5–4 orders of magnitude |
| Injection Volume |
Typically 2–5 μL |
| Polarity Switching |
Fast positive/negative cycle |
GC-MS & High-Field NMR (Orthogonal Platforms)
GC-MS provides robust fragment-level positional constraints for derivatized amino acids and organic acids,
while our NMR-based metabolic flux analysis platform
provides non-destructive positional isotopomer quantification.
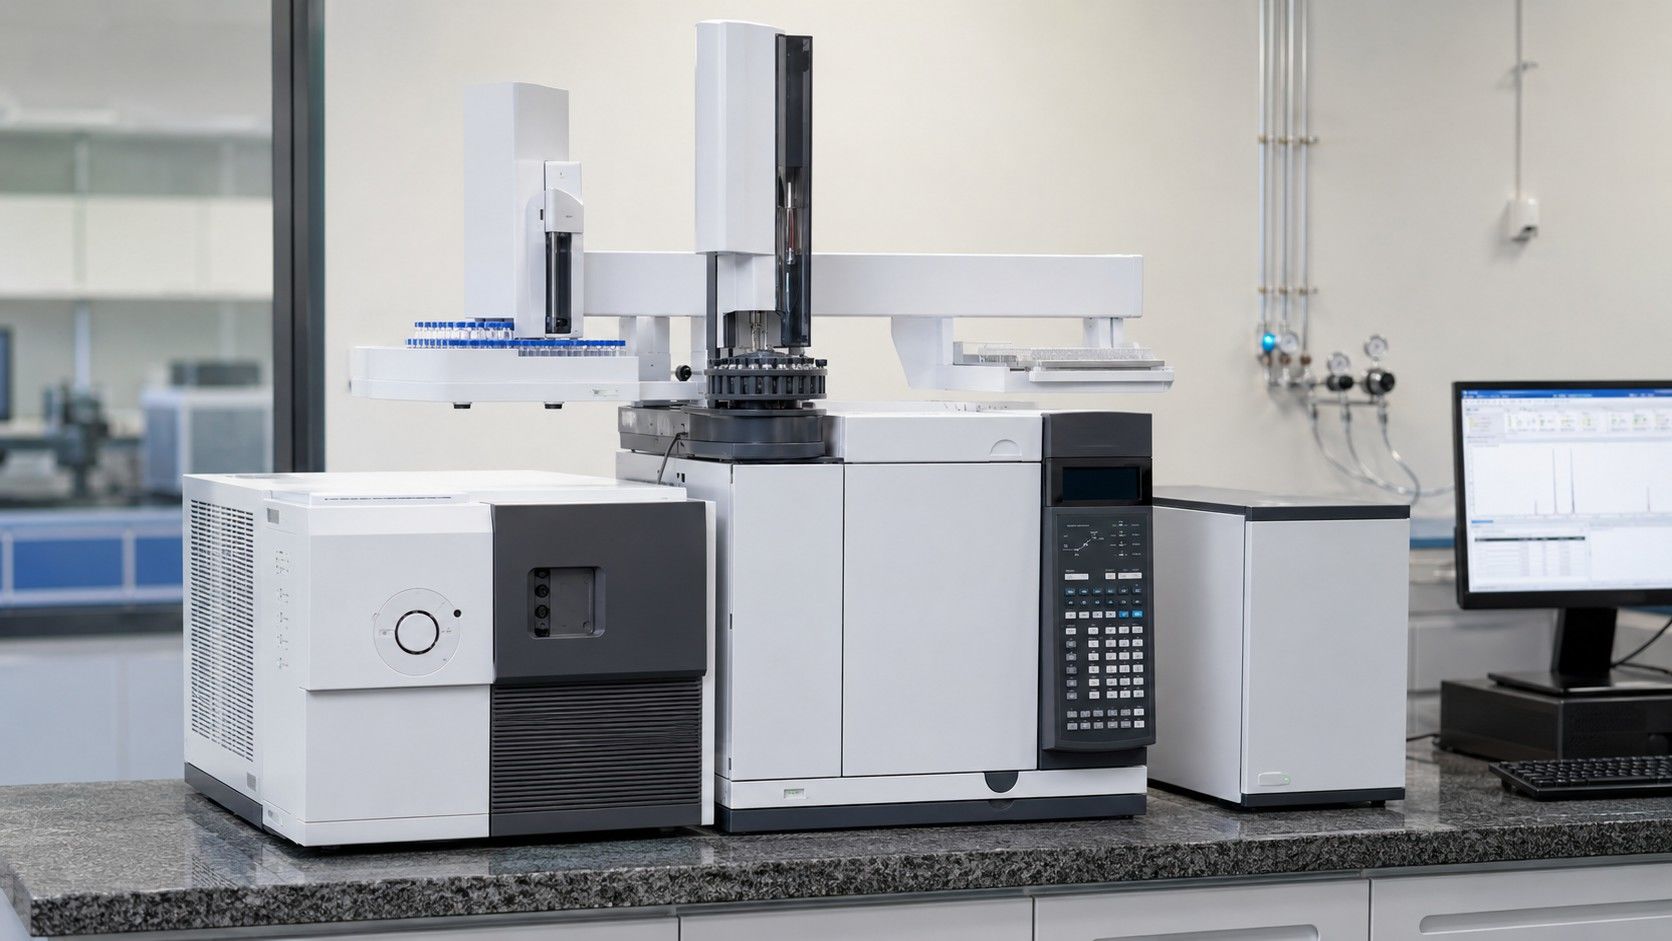
- GC-MS System: Agilent 7890B GC coupled with 5977B MSD, EI mode (70 eV)
- GC Derivatization: MOX-TBDMS and TMS derivatization for organic acids and amino acids
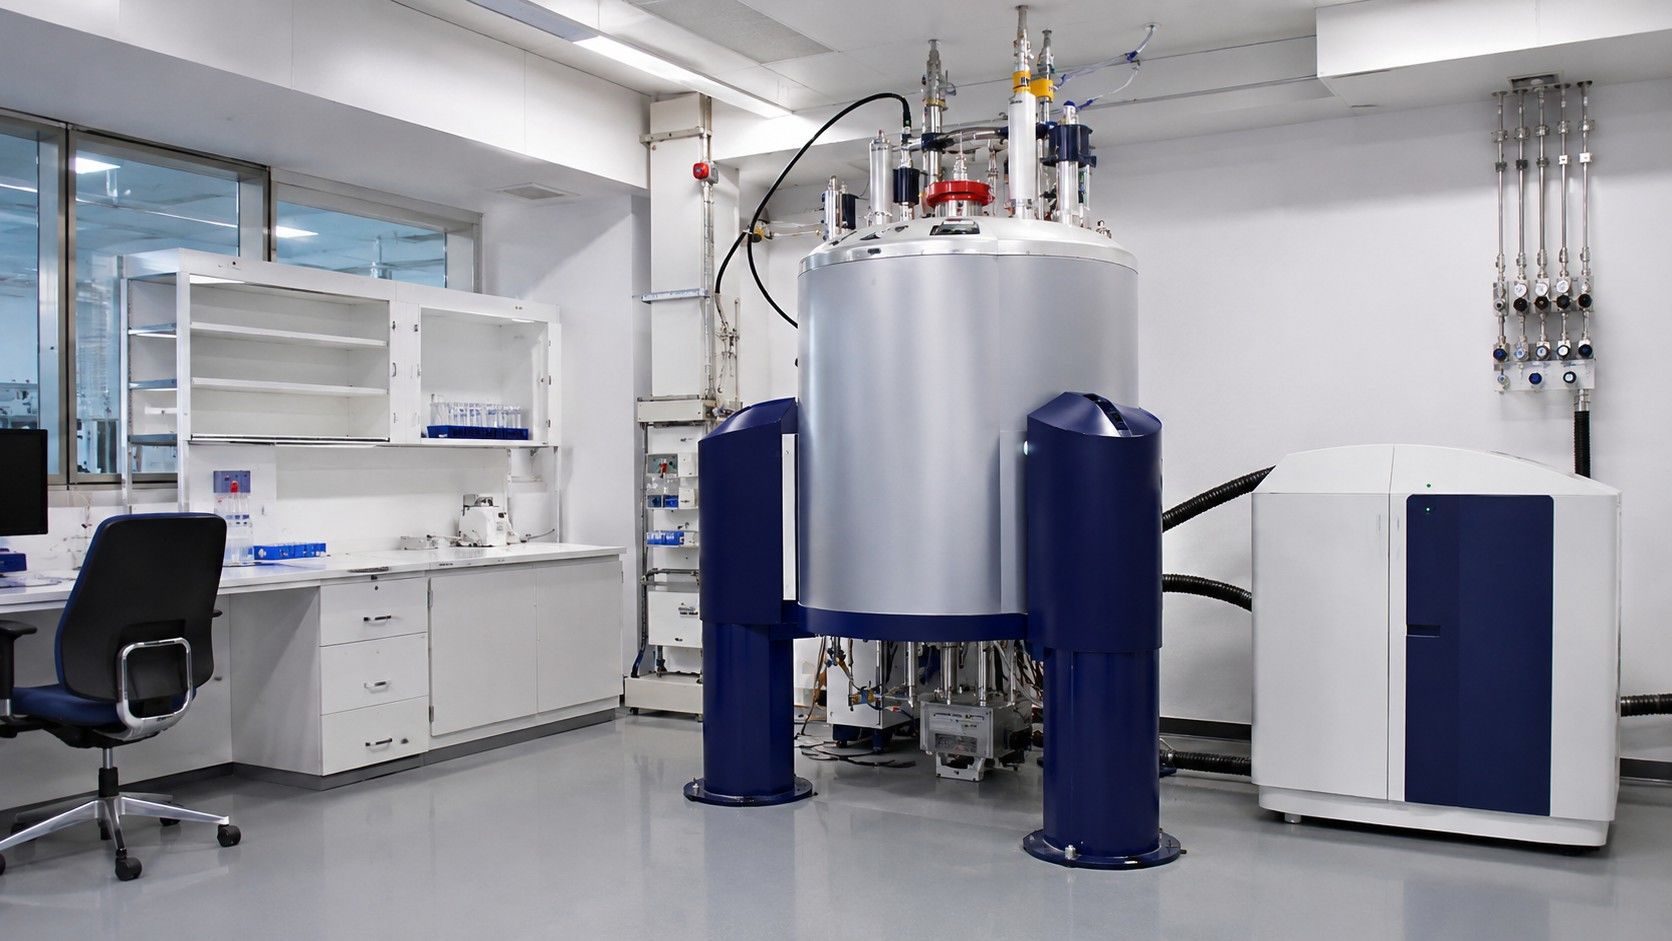
- NMR Platform: Bruker Avance III HD 600 MHz Spectrometer equipped with cryoprobe
Quality Control & Data Validation
- Instrument Performance QC: Monitored retention time reproducibility (CV < 0.5%) and peak symmetry
- Natural Abundance Correction: Mathematical deconvolution of natural isotope contributions (13C, 18O,
15N, 29Si, 30Si) using IsoCor / AccuCor algorithms
- Mass Balance Verification: Measured substrate uptake and product excretion rates applied as hard
stoichiometric constraints
13C Metabolic Flux Analysis Workflow — A Step-by-Step Guide
How to Prepare and Submit Samples for 13C-MFA
| Sample Type |
Amount Required |
Preparation & Quenching Instructions
|
Storage & Shipping |
| Adherent Mammalian Cells |
1–10 × 106 cells (e.g. 60/100 mm dish) |
Aspirate medium (<3 s), rapid wash with ice-cold saline, add pre-cooled (-80 °C) 80:20
MeOH:H2O, scrape on dry ice. Avoid trypsinization. Retain parallel plate for cell count in mammalian cell metabolic flux analysis.
|
Store at −80 °C; ship on dry ice |
| Suspension Cells |
2–10 × 106 cells |
Rapid cold centrifugation (4 °C, <2 min) or direct sub-zero buffered quenching (-40 °C). Avoid
prolonged room-temperature washes. |
Store at −80 °C; ship on dry ice |
| Microbial Broth / Fermentation |
2–10 mg dry cell weight (OD-adjusted) |
Fast vacuum filtration (<2 s) with immediate liquid nitrogen filter immersion, or cold methanol
quenching for microbial metabolic flux
analysis. Retain supernatant for exchange rate analysis. |
Store at −80 °C; ship on dry ice |
| Conditioned Media (Supernatant) |
≥ 200 μL |
Collect from matched labeling time points, centrifuge (10,000 × g, 5 min) to remove debris,
aliquot supernatant for extracellular rate quantification. |
Store at −80 °C; ship on dry ice |
| Plant Tissues (Leaves / Roots) |
20–100 mg wet weight |
Instant freeze-clamping in liquid nitrogen, cryo-pulverization under liquid nitrogen conditions
without thawing for plant metabolic flux analysis.
|
Store at −80 °C; ship on dry ice |
Notes
- Always retain parallel uncultured medium blanks and conditioned media to quantify extracellular
consumption and secretion rates
- Do not use enzymatic detachment (trypsin) for adherent cultures; perform direct in-plate cold solvent
quenching
- Maintain continuous cold chain (−80 °C or dry ice) during sample storage and transport
- Contact our technical team prior to collecting specialized or low-biomass matrices
Deliverables: What You Receive from 13C Metabolic Flux Analysis
- Natural-Abundance-Corrected MID Matrix: Fractional isotopic abundances (M+0 to M+n) for
all target metabolites (.csv / Excel).
- Extracellular Consumption & Secretion Rates: Measured absolute boundary rates
(mmol/gDW/h or nmol/106 cells/h).
- Reaction Network & EMU Model Files: Complete stoichiometric equations, carbon atom
transition matrices, and executable project files (.xml / INCA / 13CFLUX2).
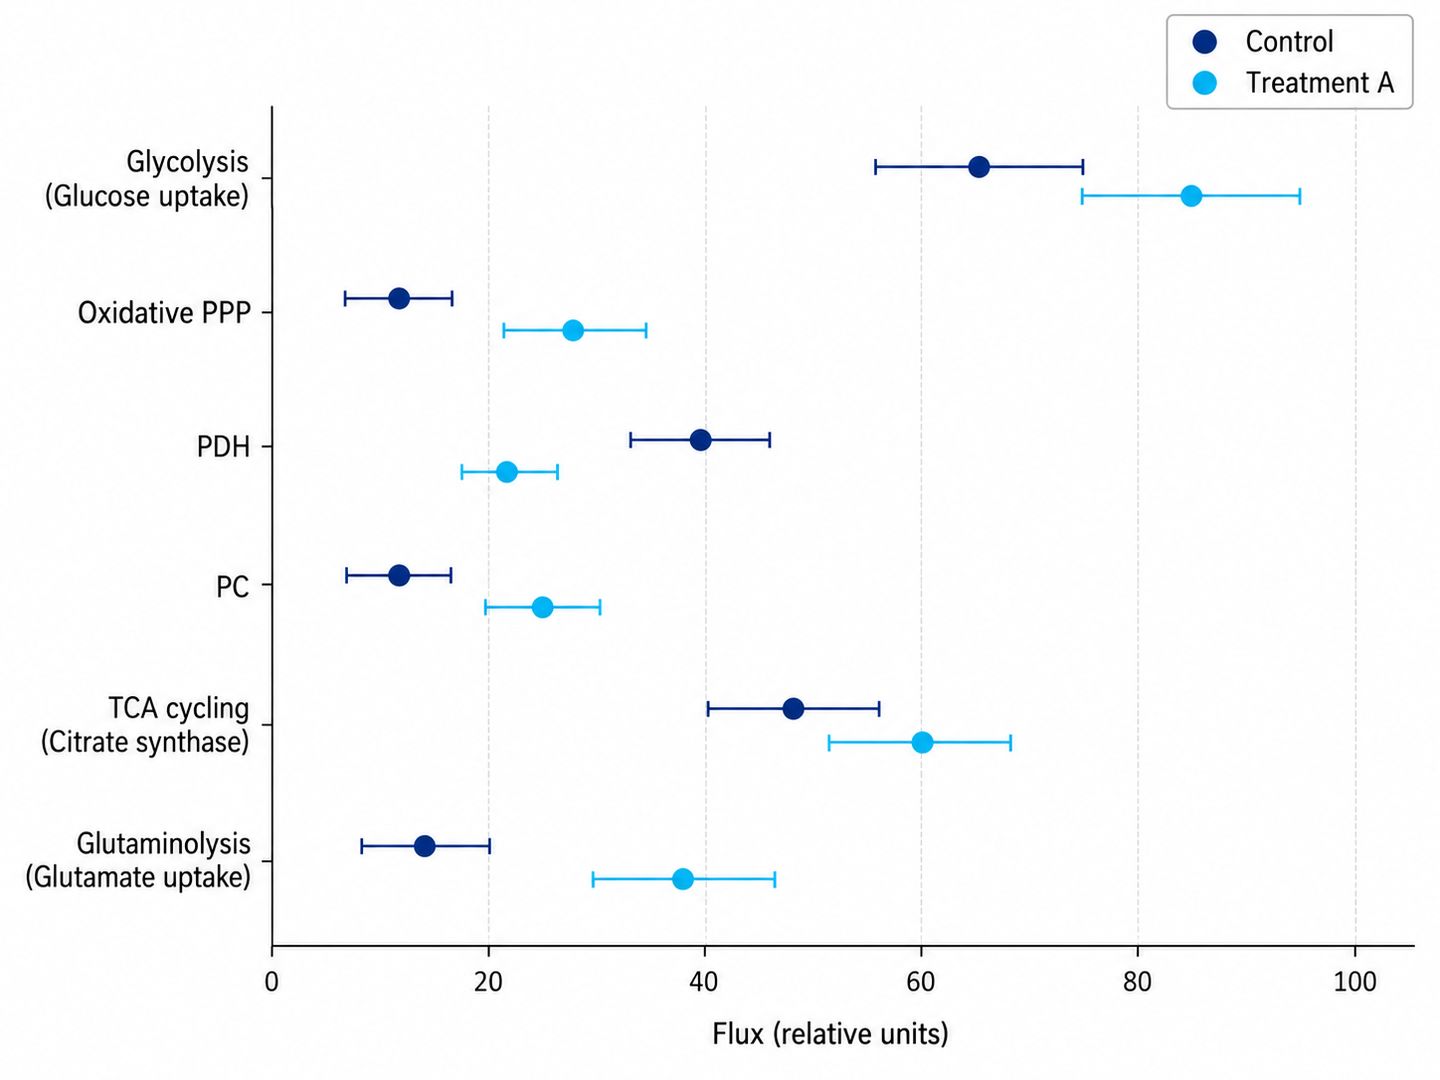
- Fitted Metabolic Flux Values & Confidence Intervals: Estimated net
(vnet) and exchange (vxch) fluxes with 95% profile likelihood confidence intervals.
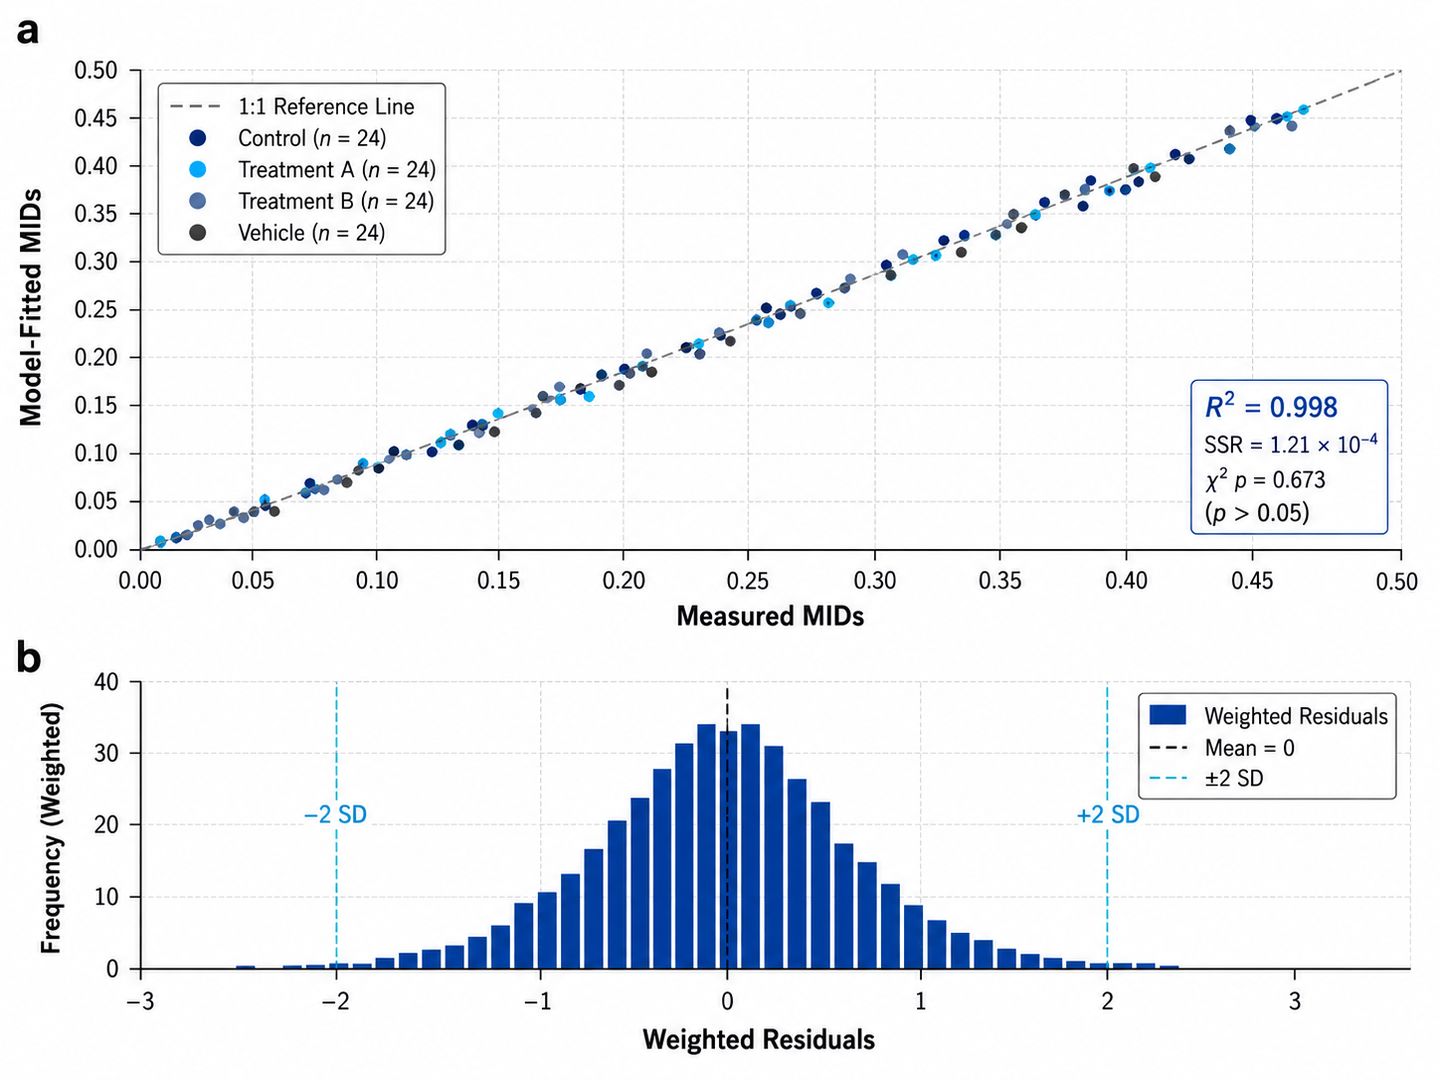
- Statistical Diagnostics & Residuals: Chi-square (χ²) goodness-of-fit statistics,
sum of squared residuals (SSR), and measured vs. simulated correlation plots.
- Publication-Ready Pathway Flux Maps: High-resolution vector graphics (PDF/SVG)
illustrating intracellular carbon distribution with flux-scaled arrow widths, supported by comprehensive
fluxomics data analysis.
Applications of 13C Metabolic Flux Analysis
Our 13C metabolic flux analysis service supports researchers across academic, biotechnology, and biopharma
programs:
Stable Isotope 13C-Glutamine Tracing Resolves
Anaplerotic Flux and TCA Cycle Rewiring in Proliferating Tissues
Background
During peri-implantation development, rapid elongation of the conceptus requires extensive metabolic
coordination between glycolysis and the tricarboxylic acid (TCA) cycle. While proliferating cells
predominantly utilize aerobic glycolysis for biomass synthesis, maintaining mitochondrial TCA cycle flux is
critical for energy generation. To elucidate how conceptus tissues metabolically adapt to changes in
nutrient availability, researchers investigated the capacity of trophectoderm cells to utilize glutamine via
glutaminolysis as an alternative anaplerotic carbon source.
Challenge:
Determine whether proliferating trophectoderm cells can decouple glycolysis from the TCA cycle by utilizing
glutamine-derived carbons to maintain mitochondrial anaplerotic flux when glucose is restricted.
Findings (from the published study)
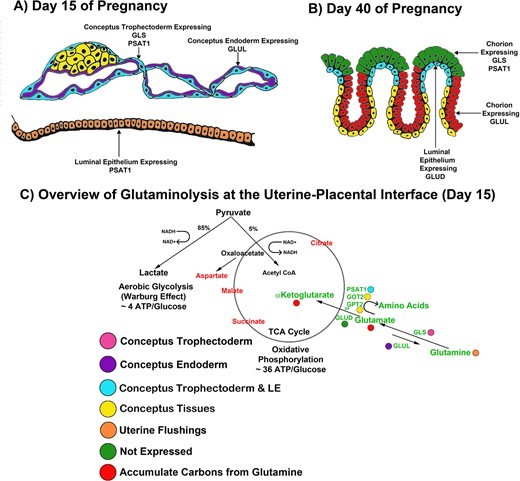
- Active Glutaminolysis Induction: Expression of glutaminase (GLS) and aminotransferases
(PSAT1, GOT2, GPT2) was upregulated in elongating conceptus trophectoderm, establishing active glutamine
conversion into glutamate and α-ketoglutarate.
- TCA Anaplerosis Maintenance: Stable isotope tracing with [U-13C5]glutamine confirmed
substantial 13C label incorporation into downstream TCA intermediates (succinate, fumarate, malate,
citrate), proving that glutaminolysis maintains anaplerotic flux to sustain mitochondrial function.
- Glucose-Deprivation Compensation: When glucose was omitted from the medium, glutamine
oxidation to 14CO2 and 13C incorporation into aspartate increased significantly, demonstrating metabolic
flexibility to support nucleotide precursor synthesis.
- Pathway Rewiring: The study established that proliferating tissues actively decouple
glycolysis from the TCA cycle, utilizing glutamine catabolism to maintain mitochondrial anaplerosis and
provide precursors for cell migration and growth.
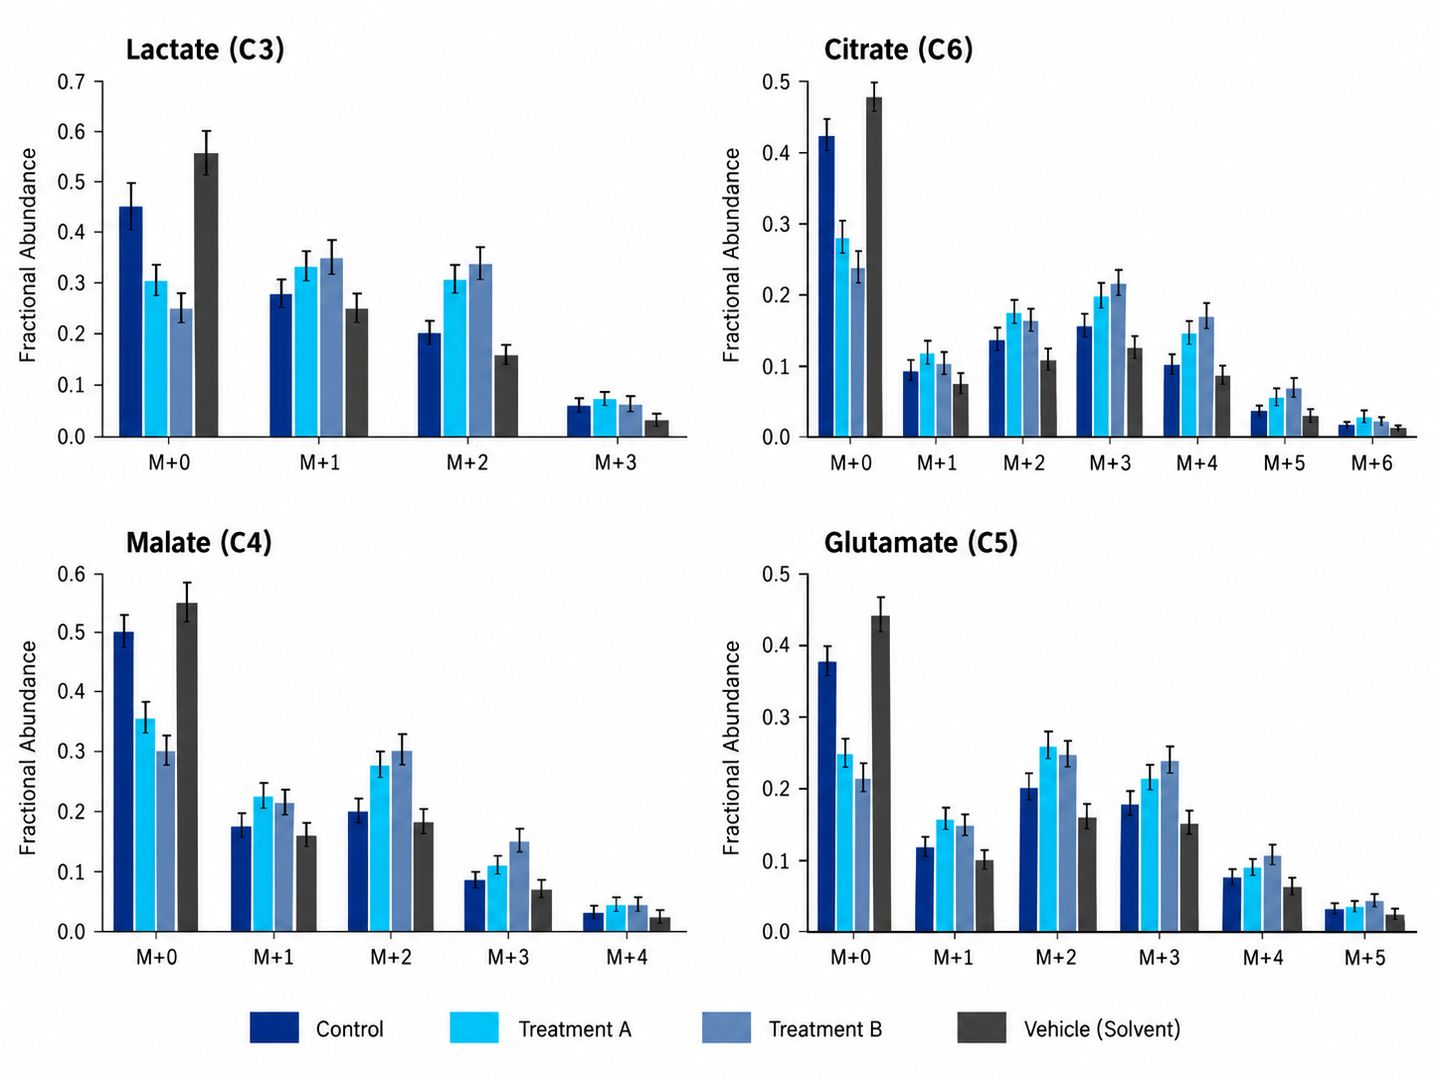
Figure 7. Mass isotopologue distributions and 13C-enrichment of central carbon and TCA cycle intermediates from [U-13C5]glutamine tracing
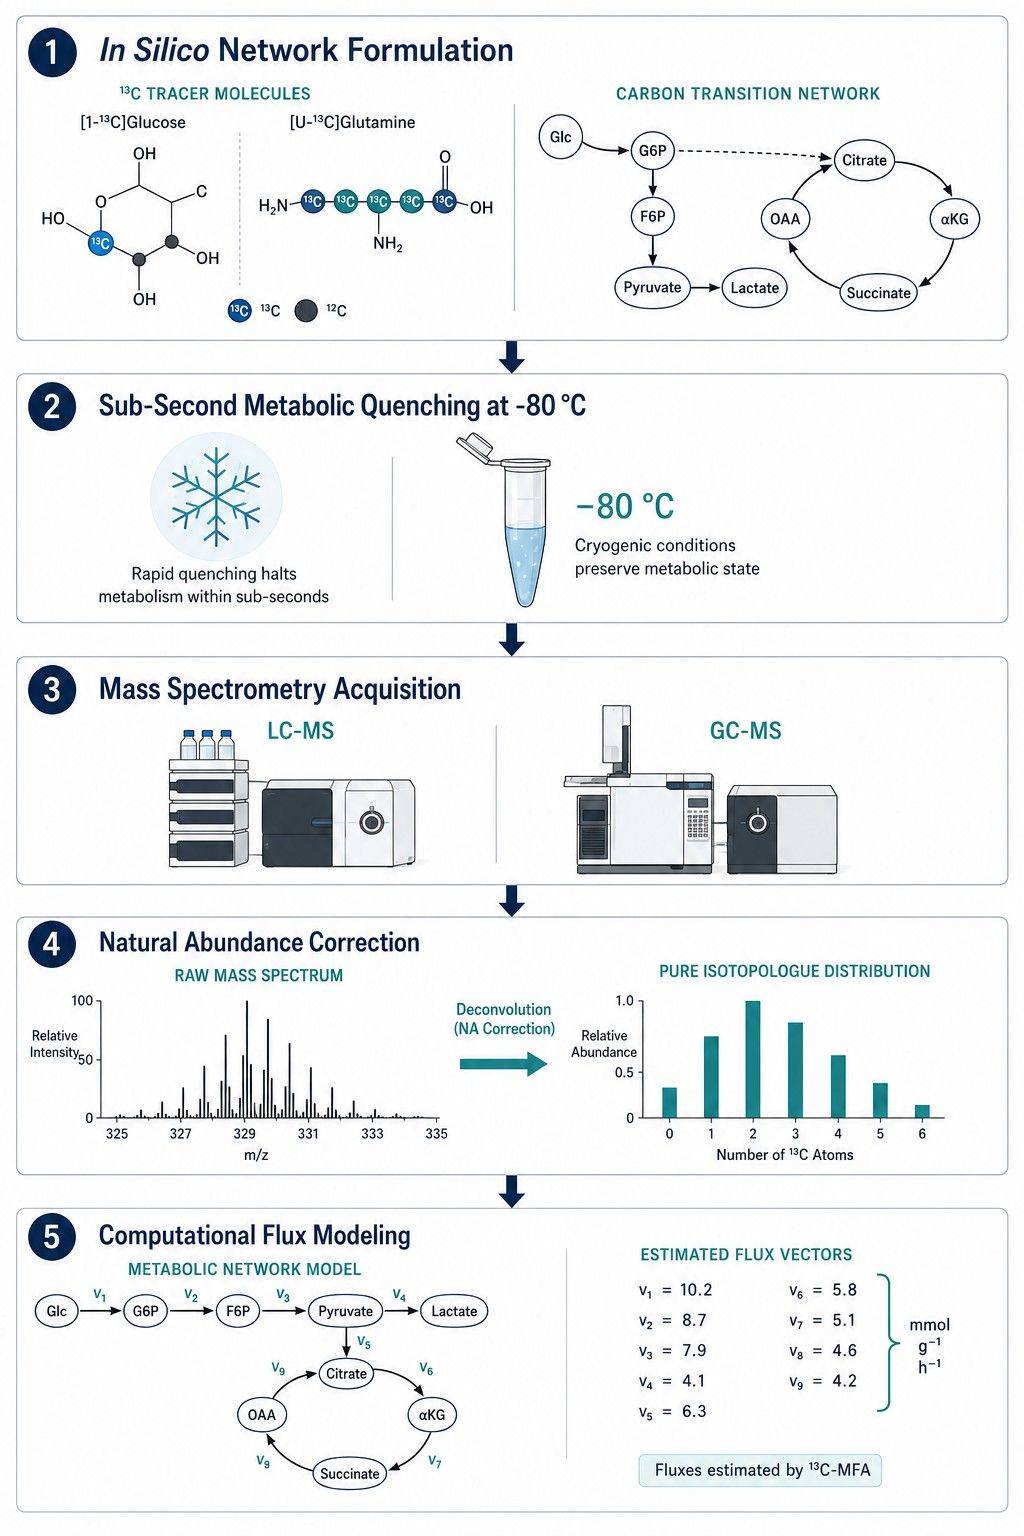
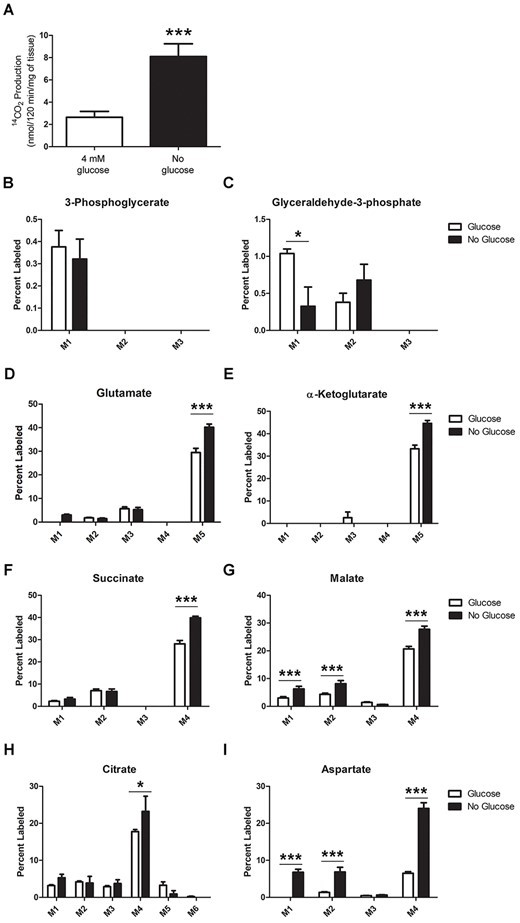 Figure 8. Schematic model of spatial-temporal glutaminolysis pathway flux and carbon transition network
Process Insight
The study highlights how 13C stable isotope tracing combined with high-resolution mass spectrometry
resolves pathway-level metabolic flexibility, demonstrating that amino acid catabolism acts as an essential
anaplerotic buffer when primary nutrient availability changes.
Where Our 13C Metabolic Flux Analysis Service Fits
Creative Proteomics performed the stable isotope tracing mass spectrometry workflow for this study,
delivering complete analytical and data processing support:
- Tracer Experimental Design: Optimizing isotopic precursor concentrations, incubation
timelines, and medium blank controls.
- High-Resolution LC-MS Analysis: Accurate mass acquisition and peak deconvolution on
high-resolution mass spectrometry platforms.
- Natural Abundance Isotope Correction: Automated matrix correction and mass isotopologue
reporting ready for stoichiometric flux modeling.
Reference
- Seo H, Kramer AC, McLendon BA, et al. Elongating porcine conceptuses can utilize glutaminolysis as an anaplerotic
pathway to maintain the TCA cycle. Biology of Reproduction. 2022;107(4):948-959.
Impaired ketogenesis ties metabolism to T cell dysfunction in COVID-19
Karagiannis, F., Peukert, K., Surace, L., Michla, M., Nikolka, F., Fox, M., ... & Kurts, C.
Journal: Nature
Year: 2022
DOI: https://doi.org/10.1038/s41586-022-05128-8
Elongating porcine conceptuses can utilize glutaminolysis as an anaplerotic pathway to maintain the TCA cycle
Seo, H., Kramer, A. C., McLendon, B. A., Fang, X., Satterfield, M. C., Wu, G., ... & Johnson, G. A.
Journal: Biology of Reproduction
Year: 2022
DOI: https://doi.org/10.1093/biolre/ioac097
Hierarchical glycolytic pathways control the carbohydrate utilization regulator in human gut Bacteroides
Kabonick, S. G., Verma, K., Modesto, J. L., Pearce, V. H., Winokur, K. M., Groisman, E. A., &
Townsend, G. E.
Journal: Nature Communications
Year: 2025
DOI: https://doi.org/10.1038/s41467-025-59704-3
Macrophage-Associated Lipin-1 Promotes beta-Oxidation in Response to Proresolving Stimuli
Schilke, R. M., Blackburn, C. M. R., Rao, S., Krzywanski, D. M., Finck, B. N., & Woolard, M. D.
Journal: ImmunoHorizons
Year: 2020
DOI: https://doi.org/10.4049/immunohorizons.2000047
The mitochondrial Pyruvate Carrier 1 is needed for the synthesis of 1-deoxysphingolipids in spheroids of the preputial gland
Panknin, I., Rieder, D., Mair, R., Sailer, S., Gotic, M., Meissner, C., ... & Keller, M. A.
Journal: eLife
Year: 2021
DOI: https://doi.org/10.7554/eLife.67500
The role of carnitine palmitoyl transferase 2 in the progression of salt-sensitive hypertension
Dissanayake, L. V., Smith, B. A., Zietara, A., Levchenko, V., Lowe, M., Kravtsova, O., ... &
Staruschenko, A.
Journal: American Journal of Physiology-Cell Physiology
Year: 2025
DOI: https://doi.org/10.1152/ajpcell.00485.2025
Integrated Metabolomic and Transcriptomic Analyses of Flavonoid Biosynthesis during Fruit Development in Two Jujube Cultivars
Li, M., Liu, P., Liu, Y., Zhao, S., Wang, M., Liang, M., ... & Dai, L.
Journal: Metabolites
Year: 2024
DOI: https://doi.org/10.3390/metabo14100523


 Contact Us



