Central Carbon Metabolic Flux Analysis — Beyond Static Pool Concentrations
Central carbon metabolism coordinates cellular energetics and precursor synthesis across glycolysis, the pentose phosphate pathway (PPP), and the tricarboxylic acid (TCA) cycle. While conventional metabolomics quantifies static pool sizes (μmol/g or ng/mL), concentration data alone cannot determine whether intermediate accumulation reflects accelerated upstream synthesis, impaired downstream consumption, or branch-point rerouting.
As a core pathway pillar within our metabolic flux analysis service, Central Carbon MFA tracks stable carbon isotopes (13C) to model intracellular reaction rates and pathway partitioning:
(i) Glycolysis vs. Pentose Phosphate Pathway Split: Carbon routing at the glucose-6-phosphate (G6P) node, detailed in our pentose phosphate pathway metabolic flux analysis.
(ii) Pyruvate Partitioning & Anaplerosis: Mitochondrial carbon entry through pyruvate dehydrogenase (PDH) versus pyruvate carboxylase (PC), connected to our glycolytic pathway metabolic flux analysis.
(iii) TCA Cycle Directionality: Forward oxidative TCA cycling versus IDH-mediated reductive carboxylation, evaluated in our TCA cycle metabolic flux analysis.
(iv) Biosynthetic Diversion: One-carbon and serine/glycine synthesis from 3-phosphoglycerate (3-PG) under genetic, nutritional, or pharmacological perturbations.
Looking for metabolite concentration measurements? If your study focuses on quantifying absolute or relative metabolite pool sizes (μmol/g or ng/mL) rather than dynamic pathway fluxes, please explore our Central Carbon Metabolism Analysis service.
Analytical Considerations & Feasibility for Central Carbon Fluxomics
Central carbon fluxomics requires tailored bioanalytical strategies across polar phosphorylated intermediates, carboxylic acids, and amino acids:
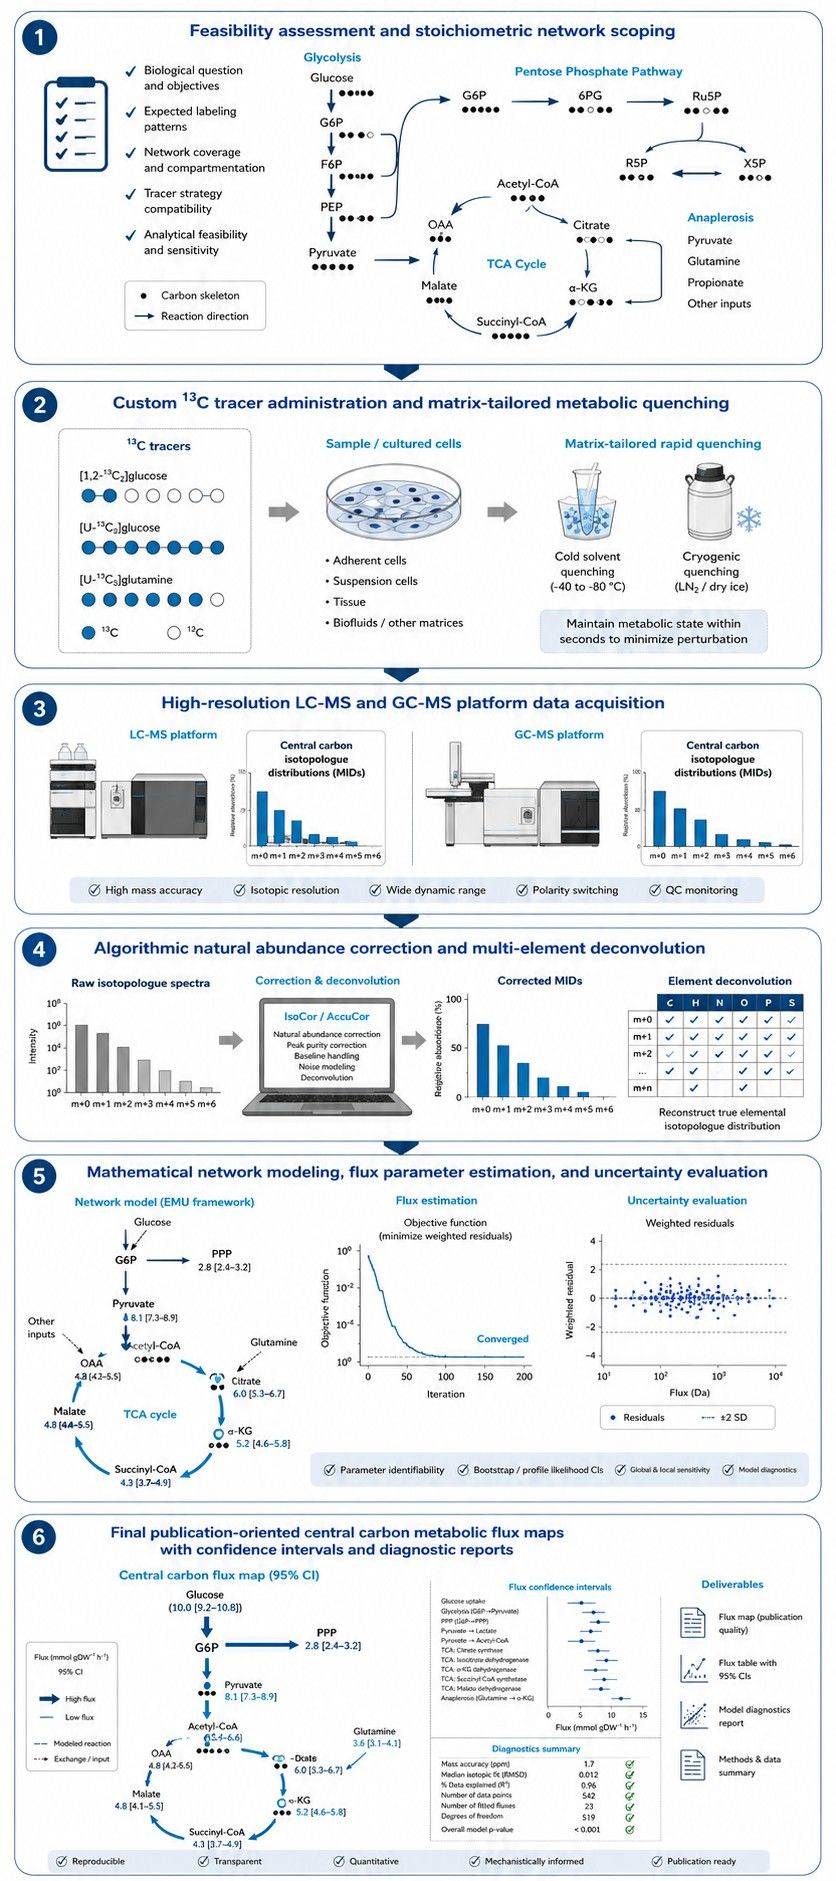
- System-Tailored Metabolic Arrest: Rapid solvent quenching and extraction protocols are selected based on the matrix (adherent cells, suspension cultures, microbial biomass, or tissue specimens) to preserve intermediate integrity.
- High-Resolution Mass Spectrometry: LC-MS and GC-MS platforms are matched to analytical targets to separate key isotopologue envelopes from matrix interferences without derivatization bias for phosphorylated intermediates.
- Natural Abundance Deconvolution: Algorithmic matrix correction (such as IsoCor or AccuCor routines) corrects raw mass spectra for natural isotopic background (13C, 15N, 18O, and silyl tags) prior to model fitting.
- Extracellular Boundary Constraints: Concurrently measured substrate uptake (e.g. glucose, glutamine) and byproduct secretion rates (e.g. lactate, alanine) anchor the mathematical model to absolute physical scales.
Stable-Isotope 13C Tracer Strategies for Central Carbon Flux Tracing
Tracer selection is evaluated during feasibility review to align labeling contrast with your pathway hypotheses:
| Tracer Substrate |
Target Pathway Node |
Diagnostic Labeling Information |
| [1,2-13C2]Glucose |
Glycolysis vs. Oxidative Pentose Phosphate Pathway (oxPPP) |
Direct glycolysis yields M+2 downstream triose phosphates and lactate (retaining C1-C2 intact), whereas oxPPP decarboxylation of C1 yields M+1 pentose phosphates and downstream M+1 lactate. Provides diagnostic labeling contrast that can support estimation of glycolytic and oxidative PPP routing when incorporated into an appropriately constrained network model. |
| [U-13C6]Glucose |
Glycolytic throughput, PDH vs. PC entry into TCA, and serine synthesis |
Uniformly labels glycolytic intermediates (M+3 trioses, M+3 pyruvate/lactate). Pyruvate dehydrogenase (PDH) entry produces M+2 acetyl-CoA and M+2 citrate, whereas pyruvate carboxylase (PC) anaplerosis yields M+3 oxaloacetate and M+3/M+5 citrate. |
| [U-13C5]Glutamine |
Oxidative TCA cycling vs. Reductive Carboxylation |
Deamination yields [U-13C5]α-KG (M+5). Forward oxidative cycling produces M+4 succinate, fumarate, malate, and citrate; reverse reductive carboxylation catalyzed by IDH produces M+5 citrate and M+3 malate. |
| Parallel [1-13C] + [U-13C6]Glucose |
Global network identifiability and exchange reversibility |
Parallel tracer experiments and joint model fitting can resolve transketolase/transaldolase reversible exchange fluxes alongside anaplerosis within our 13C metabolic flux analysis framework. |
Technical Platform Capabilities for Central Carbon MFA
- Orthogonal Analytical Platforms: Tailored deployment of high-resolution LC-MS for intact phosphorylated intermediates alongside GC-MS-based metabolic flux analysis for fragment-resolved amino acid and organic acid isotopologues.
- Isotopic Steady-State and Dynamic Options: Supports conventional isotopic steady-state 13C-MFA as well as time-course sampling for dynamic and INST metabolic flux analysis where pool turnover or growth transitions preclude isotopic equilibrium.
- Statistical Identifiability and Uncertainty Analysis: Fitted fluxes are evaluated with goodness-of-fit testing and confidence interval assessments to distinguish well-constrained parameters from unidentifiable reactions.
- Complementary Positional Validation: Where position-specific carbon atom transitions require orthogonal physical verification, studies can incorporate high-field NMR-based metabolic flux analysis.
End-to-End Central Carbon MFA Workflow & Analytical Pipeline
Sample Preparation & Submission Guidelines for Central Carbon MFA
Sample amounts and quenching procedures are finalized during feasibility review based on intermediate abundance, turnover kinetics, and matrix type:
| Sample Type |
Typical Input Guidelines |
Harvesting & Quenching Principles |
Storage & Transport |
| Adherent Cultured Cells |
Typically 1–10 × 106 cells per replicate, confirmed by pilot assessment |
Rapid medium removal, immediate addition of pre-chilled organic extraction solvent, cell detachment on dry ice/ice. Minimize wash duration. |
Store at −80 °C; ship on dry ice |
| Suspension Cultured Cells |
Typically 2–10 × 106 cells, adjusted to cell size and density |
Short, pre-cooled centrifugation or direct cold solvent quenching, rapid supernatant removal, and immediate solvent extraction. |
Store at −80 °C; ship on dry ice |
| Microbial & Fermentation Pellets |
Biomass volume determined by pilot extraction and target coverage |
Fast filtration or direct quenching into pre-chilled solvent to arrest fast-turnover pools. Retain spent medium for extracellular rate quantification. |
Store at −80 °C; ship on dry ice |
| Plant & Animal Tissue Specimens |
20–100 mg wet weight, depending on metabolic activity |
Immediate freeze-clamping or flash freezing in liquid nitrogen upon collection; cryogenic pulverization without intermediate thawing. |
Store at −80 °C; ship on dry ice |
| Conditioned Culture Medium |
≥ 200 μL matched supernatant |
Collect from matched labeling time points, clarify by centrifugation to remove cellular debris, aliquot for extracellular rate profiling. |
Store at −80 °C; ship on dry ice |
Quantifiable Deliverables from Central Carbon Metabolic Flux Analysis
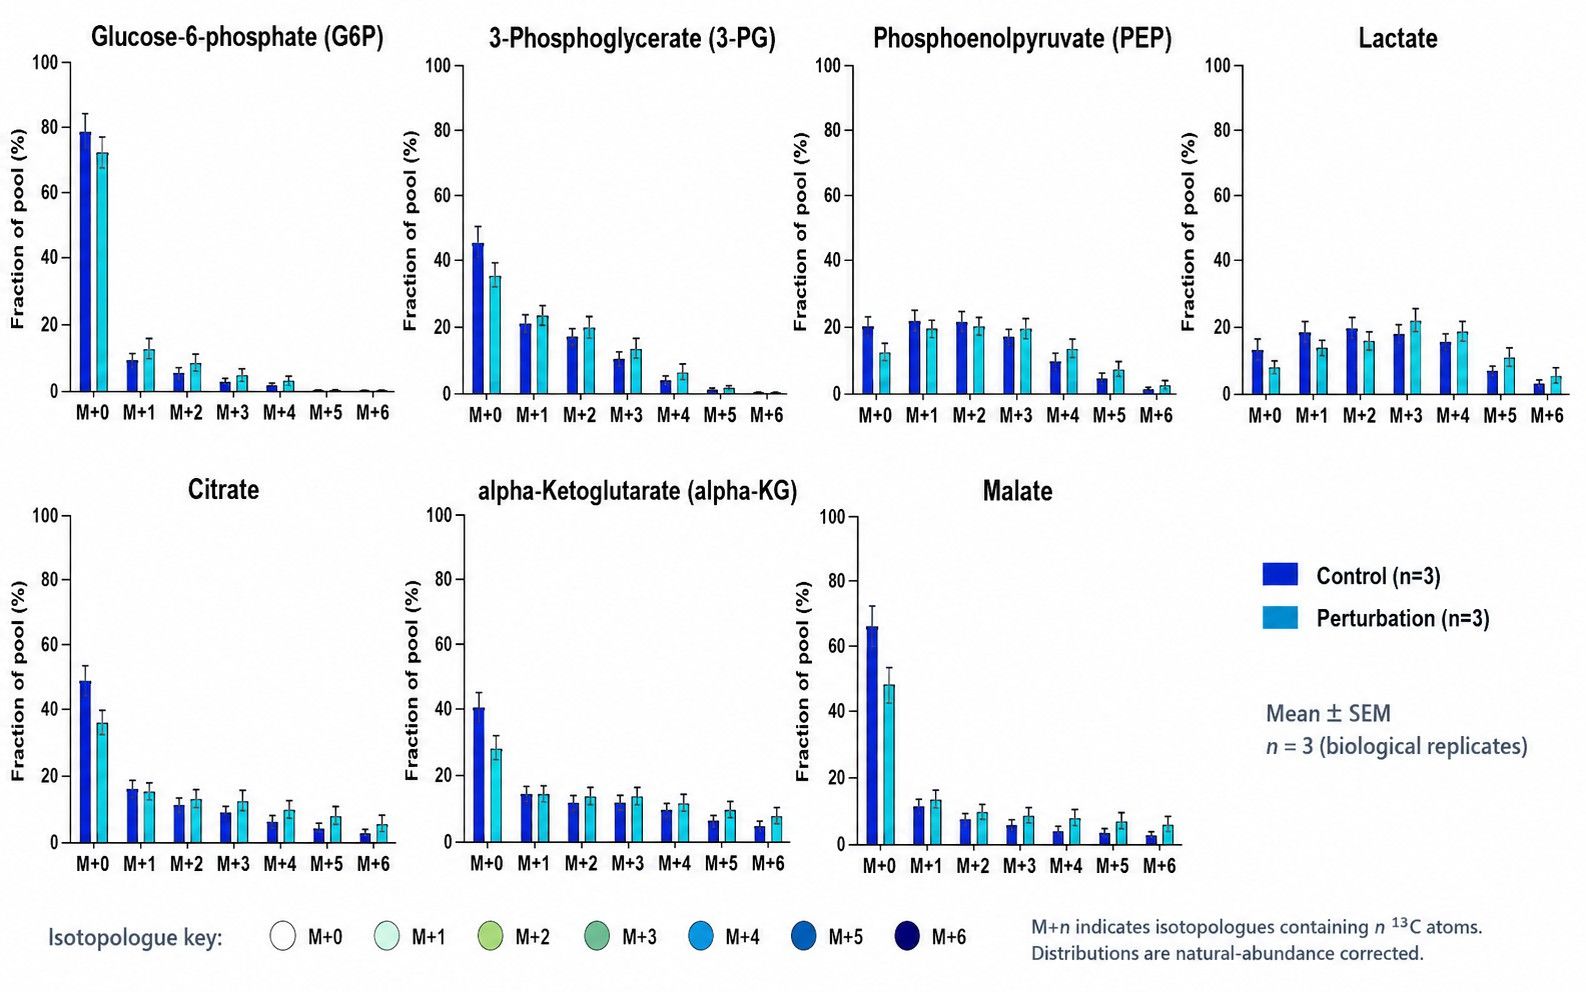
- Corrected Mass Isotopologue Distribution Data: Natural-abundance-corrected fractional labeling (M+0 to M+n) across central pathway intermediates (.csv / Excel).
- Extracellular Rate Measurements: Quantified substrate uptake and product secretion rates providing stoichiometric boundaries for flux calculation.
- Model Specifications & Network Files: Reaction network definitions, carbon atom transition mappings, and project configuration files.
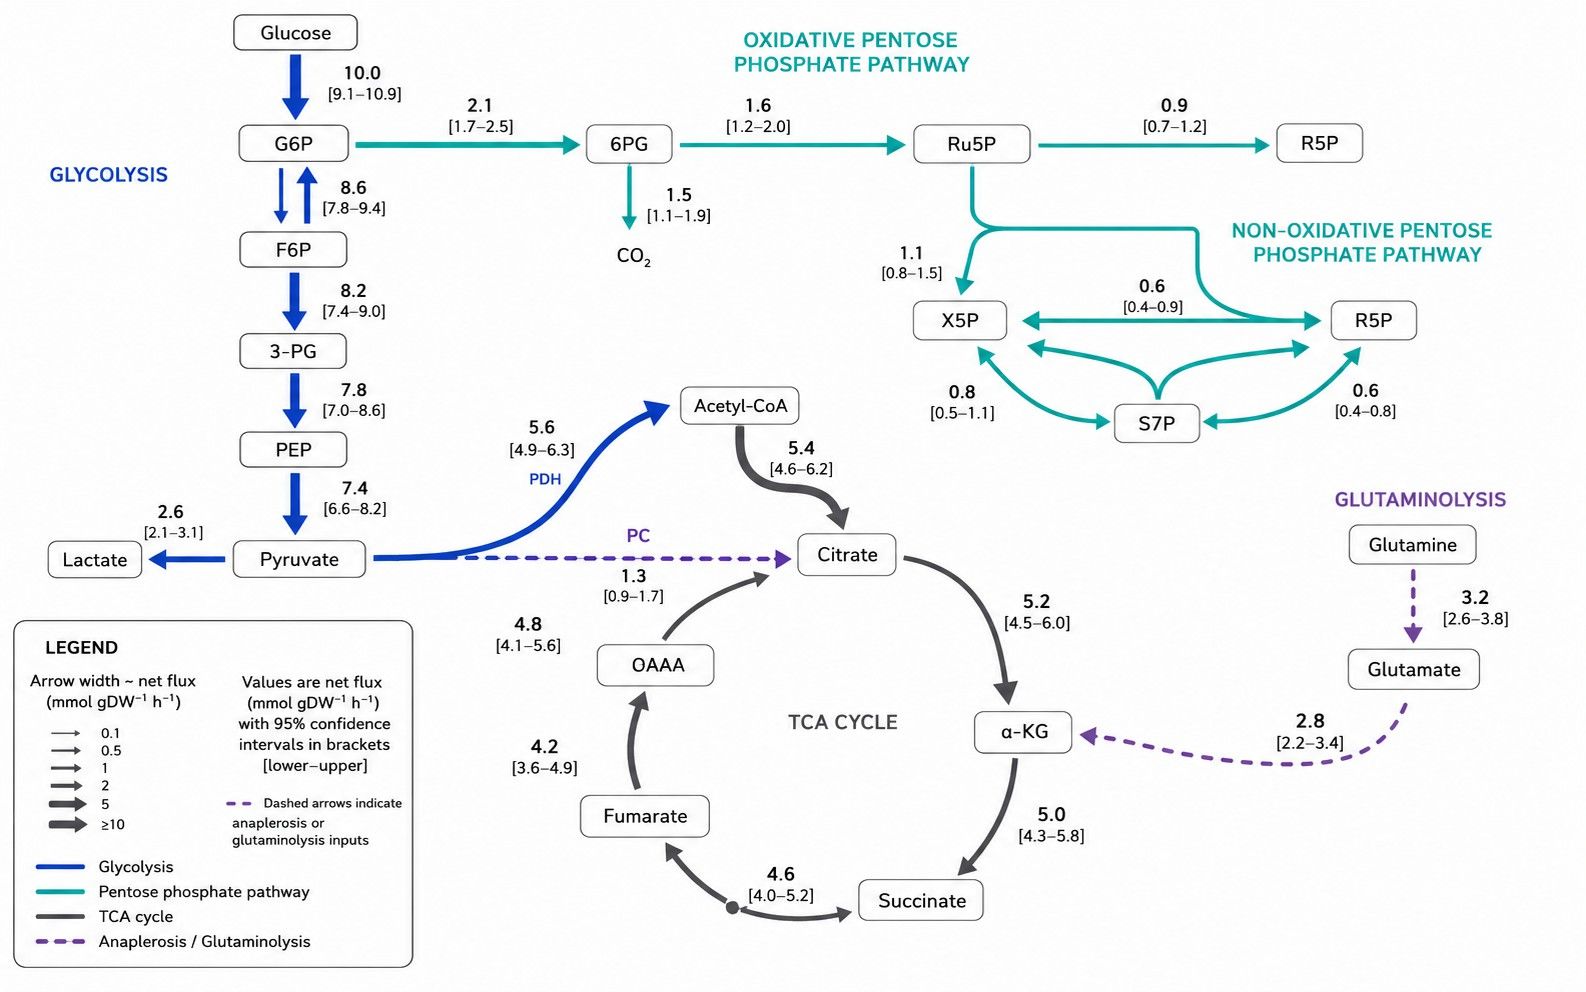
- Fitted Flux Estimates & Uncertainty Ranges: Calculated net and exchange fluxes with accompanying sensitivity analysis and confidence intervals.
- Goodness-of-Fit Diagnostics: Residual distributions, Chi-square statistics, and measured-versus-simulated correlation plots.
- Pathway Flux Visualizations: Publication-oriented network diagrams representing central carbon partitioning with flux-scaled annotations.
Research Applications of Central Carbon Pathway Flux Analysis
- Cellular Metabolic Phenotyping: Characterize alterations in glucose catabolism, glutamine utilization, and anaplerotic pathways across wild-type, mutant, or drug-treated conditions.
- Bioprocess & Metabolic Engineering: Identify pathway bottlenecks, evaluate carbon yield toward target products, and monitor overflow metabolism in fermentation hosts.
- Immunometabolism Studies: Map metabolic shifts between oxidative phosphorylation and aerobic glycolysis during immune cell activation or differentiation.
- Nutrient Adaptation & Stress Response: Quantify carbon redistribution under nutrient limitation, hypoxia, or environmental challenges in mammalian, microbial, or plant systems.


 Contact Us



