Mammalian Cell Metabolic Flux Tracing Across Disease Models
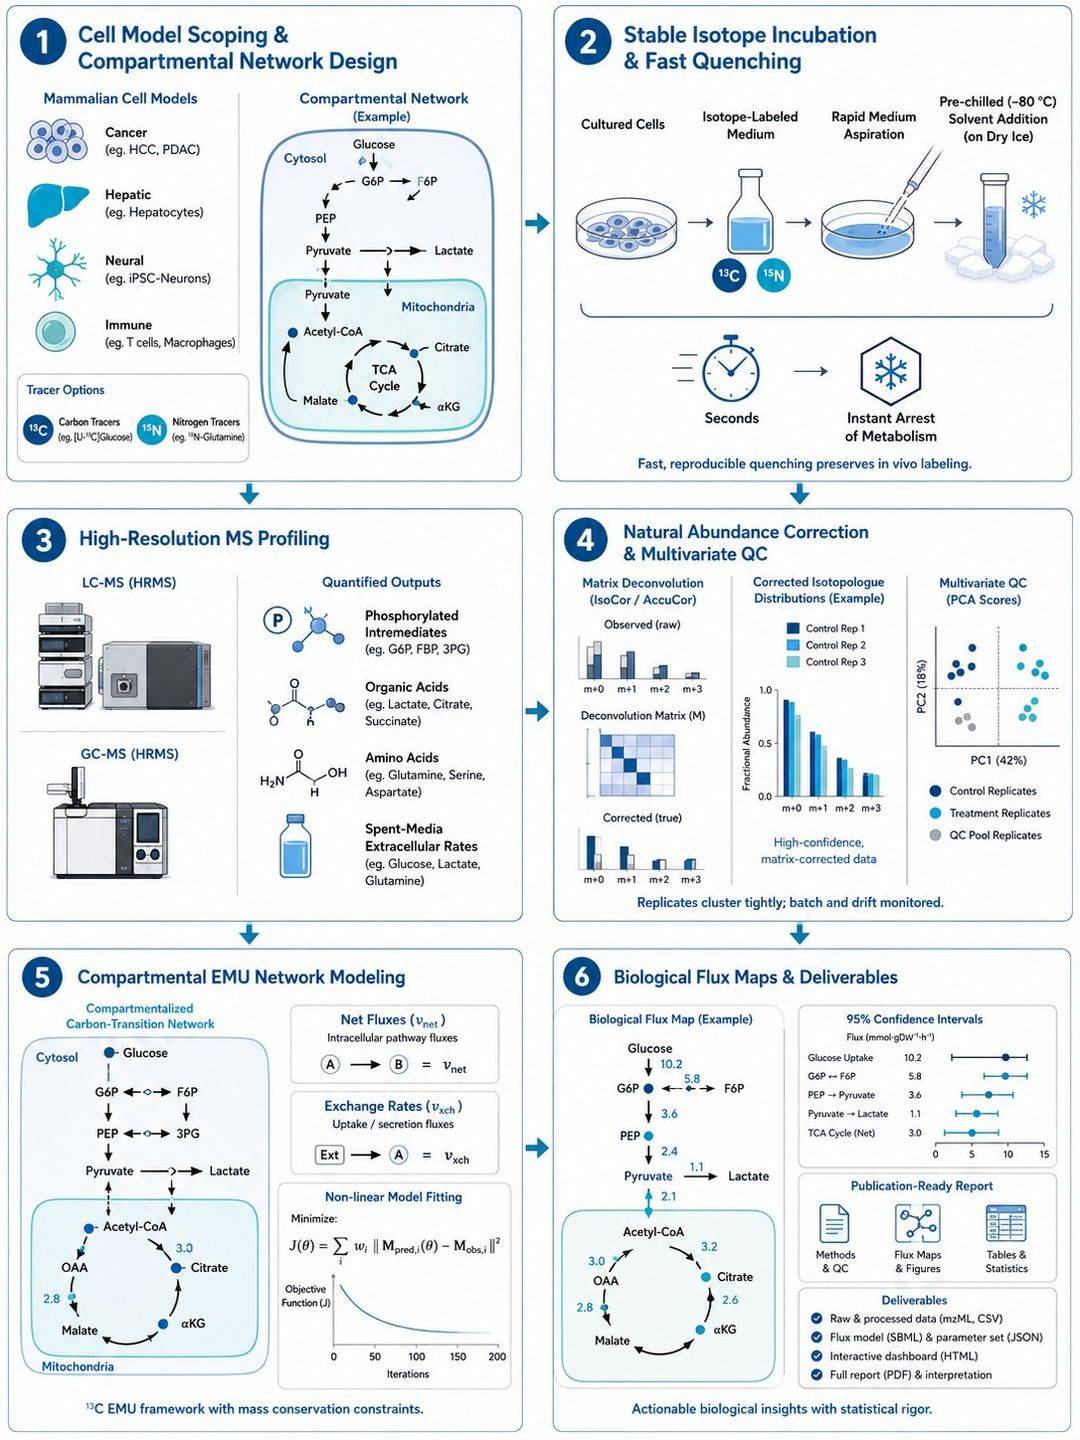
Mammalian cells continuously reprogram nutrient utilization in response to oncogenic transformation, microenvironmental hypoxia, differentiation cues, or pharmacological intervention. Because static intermediate pool sizes (μmol/106 cells or ng/mg protein) cannot distinguish accelerated pathway synthesis from impaired consumption or altered uptake, stable isotope tracing is required to resolve dynamic reaction velocities. Our Mammalian Cell MFA service maps carbon and nitrogen routing in cultured mammalian cell systems across cancer lines, primary cells, and immune populations—integrating glycolytic pathway metabolic flux analysis with mitochondrial TCA cycle metabolic flux analysis, lipid biosynthesis, and one-carbon metabolism:
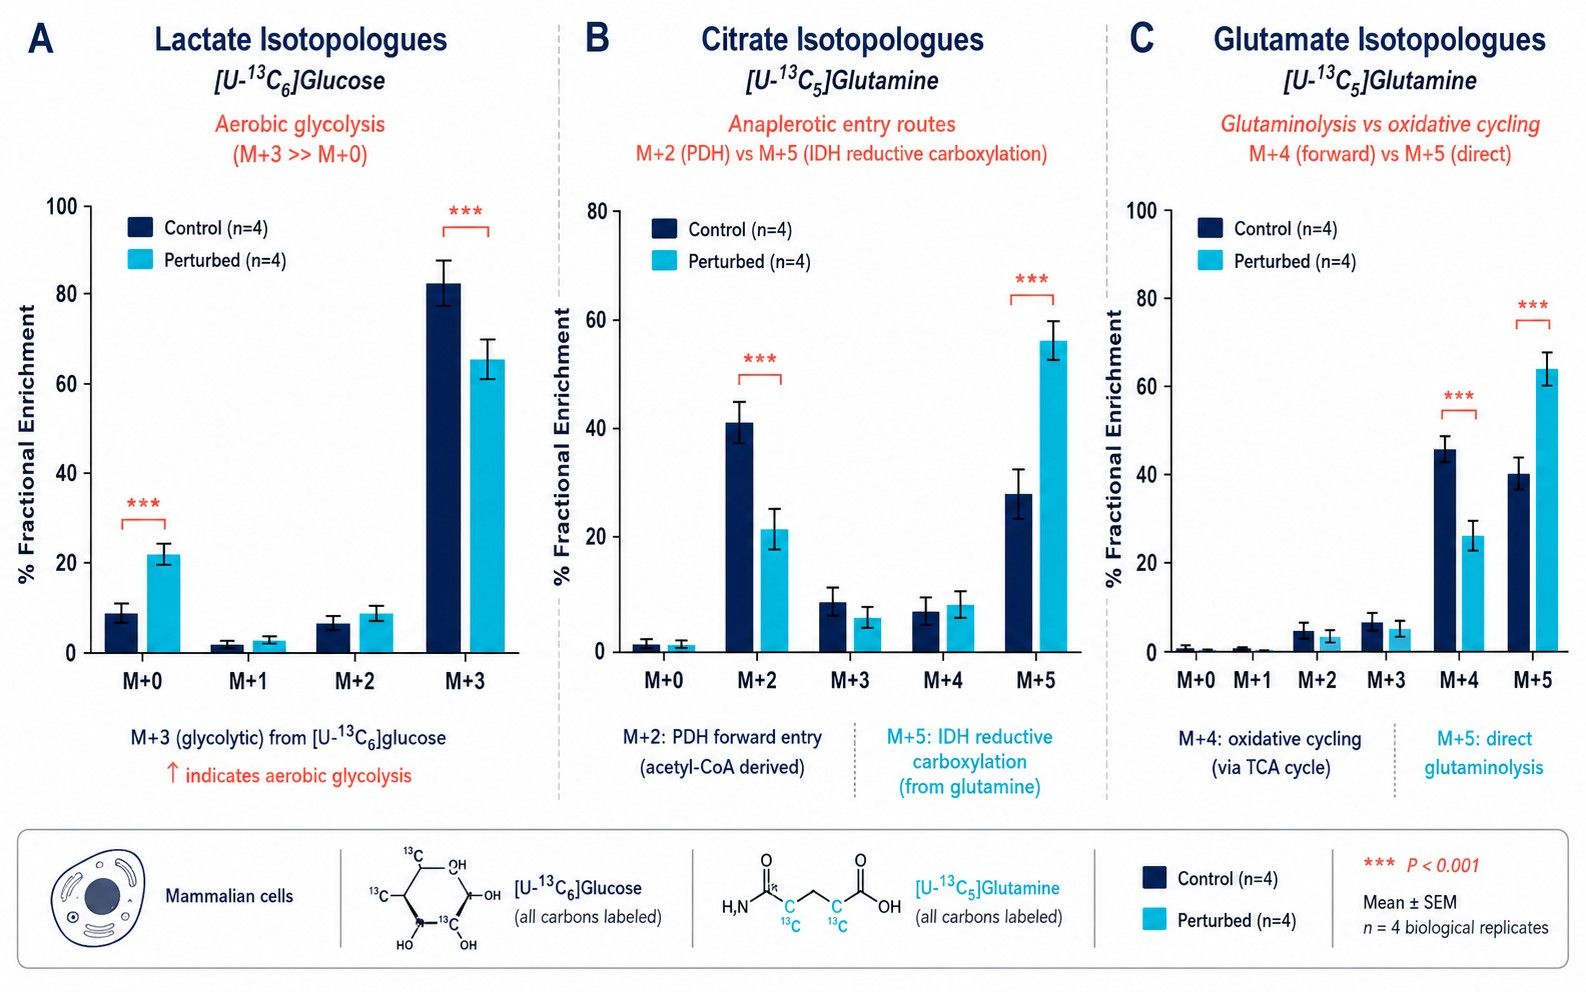
(i) Cancer Cell Reprogramming & Glycolytic Shifts: Tracking [U-13C6]glucose and [U-13C5]glutamine to generate diagnostic M+3 lactate and M+5 citrate patterns, supporting assessment of aerobic glycolysis (Warburg effect), lactate excretion, and reductive IDH carboxylation under hypoxia.
(ii) Hepatic Model Dynamics (Primary Hepatocytes vs. Immortalized Lines): Measuring the balance between gluconeogenic output, pyruvate carboxylase (PC) anaplerosis, and cytosolic acetyl-CoA generation feeding fatty acid metabolic flux analysis in primary hepatocytes or continuous cell models such as HepG2.
(iii) Neural Cell Metabolic Tracking: Profiling nutrient utilization, glutamate-glutamine labeling, and oxidative metabolism in isolated neurons, astrocytes, or co-cultures (with bulk mixed signals annotated where physical cell-type separation is not performed).
(iv) Immune & Stem Cell Activation: Tracing nutrient redistribution and one-carbon donor utilization through one-carbon metabolic flux analysis during T-cell activation, macrophage polarization (M1 vs. M2), and stem cell differentiation.
Looking for mammalian cell metabolite concentration measurements? If your study focuses on quantifying absolute or relative metabolite pool sizes (μmol/106 cells or ng/mg protein) without stable isotope tracing, please explore our Cell Metabolomics Service.
Analytical & Quenching Considerations in Mammalian Fluxomics
Mammalian cell fluxomics requires validated bioanalytical protocols to arrest rapid-turnover pools while accounting for cellular compartmentation:
- Cell-Line-Specific Metabolic Arrest & Quenching: Enzymatic detachment (e.g. trypsinization) disrupts membrane transport and depletes labile phosphorylated intermediates within seconds and must be avoided. Washing steps and quenching solvent compositions are evaluated and validated per cell line and target analyte to minimize metabolite leakage while arresting enzyme activity.
- Extracellular Boundary Rate Quantitation: Parallel measurement of glucose, glutamine, and essential amino acid uptake alongside lactate, alanine, glutamate, and ammonia excretion rates anchors network models to absolute physical scales (nmol/106 cells/h).
- Compartmentalized Modeling & Subcellular Considerations: Whole-cell extracts reflect combined signals from cytosolic, mitochondrial, and other organellar pools. Where explicit organellar fluxes are required, compartment-aware EMU modeling evaluates identifiable transport and exchange parameters, or study designs are paired with subcellular fractionation.
- Multi-Element Background Deconvolution: Algorithmic matrix correction (IsoCor / AccuCor) removes natural 13C, 15N, 2H, 18O, and silyl tag backgrounds across all measured fragment envelopes.
Stable-Isotope Tracer Strategies for Mammalian Cell Metabolism
Tracer selection determines which pathways, branch points, and exchange rates are mathematically identifiable:
| Tracer Strategy |
Target Cell Model |
Key Target Pathway Nodes |
Diagnostic Labeling Information |
| [U-13C6]Glucose |
Cancer Lines, Primary Cells & Activated Immune Cells |
Glycolytic throughput, lactate secretion, PDH vs. PC entry into TCA |
Labels glycolytic intermediates (M+3 triose-P, M+3 lactate). PDH entry produces M+2 citrate and downstream TCA intermediates; PC entry produces M+3 oxaloacetate, malate, and citrate. |
| [U-13C5]Glutamine |
Glutamine-Dependent Cancers & T-Cells |
Oxidative TCA cycling vs. Reductive Carboxylation |
Deaminates to [U-13C5]α-KG (M+5). Forward oxidative cycling produces M+4 succinate, malate, and citrate. IDH-mediated reductive carboxylation produces M+5 citrate and M+3 malate, supporting assessment of reductive glutamine metabolism under hypoxia. |
| [1,2-13C2]Glucose |
Proliferating & Redox-Stressed Cells |
Glycolysis vs. Oxidative Pentose Phosphate Pathway (oxPPP) split |
Direct glycolysis retains C1-C2 intact to yield M+2 lactate; oxPPP decarboxylation of C1 yields M+1 pentose-P and downstream M+1 lactate. |
| [1,2-13C2]Acetate / [U-13C16]Palmitate |
Hepatocytes, Adipocytes & Lipogenic Tumors |
De novo lipogenesis (DNL) vs. Fatty acid β-oxidation (FAO) |
[1,2-13C2]Acetate traces cytosolic acetyl-CoA for MIDA lipogenesis modeling; [U-13C16]palmitate traces β-oxidation entry into mitochondrial acetyl-CoA. |
Technical Capabilities for Mammalian Cell MFA
- Compartment-Aware Elementary Metabolite Unit (EMU) Modeling: Uses stoichiometric and EMU frameworks to estimate net fluxes (vnet) and exchange velocities (vxch) across interconnected mammalian pathways when supported by data constraints.
- Time-Resolved INST-MFA for Non-Steady States: Supports dynamic isotopic non-stationary MFA within our dynamic and INST metabolic flux analysis framework to resolve acute drug treatments, hypoxia induction, or rapid differentiation transitions.
- Statistical Identifiability & Confidence Profiling: Non-linear profile likelihood estimation evaluates parameter identifiability, computing 95% confidence intervals for all fitted reaction rates.
- Platform Scalability & Optional NMR Validation: Scalable extraction workflows and optional NMR positional verification available upon project feasibility confirmation.
End-to-End Mammalian Cell Metabolic Flux Analysis Workflow
Sample Preparation & Harvesting Guidelines for Mammalian Cells
Sample amounts and extraction protocols are finalized during feasibility review based on cell type, proliferation rate, and target metabolite abundance:
| Mammalian Cell Model |
Typical Input Guidelines |
Harvesting & Quenching Principles |
Storage & Transport |
| Adherent Cancer Lines & Continuous Cells |
Typically 1–5 × 10⁶ cells (60 mm dish or 6-well), confirmed by pilot assessment |
Aspirate tracer medium rapidly, apply validated pre-chilled organic solvent extraction on dry ice/ice. Avoid trypsinization and warm wash steps. |
Store at −80 °C; ship on dry ice |
| Primary Hepatocytes & Differentiated Models |
Typically 2–5 × 10⁶ cells per replicate (3–5 replicates recommended) |
Maintain physiological extracellular matrix overlay, quench rapidly with cold extraction solvent, scrape on ice. |
Store at −80 °C; ship on dry ice |
| Suspension Cells & Immune Subsets |
Typically 2–10 × 106 cells, adjusted to cell size and density |
Short, pre-cooled centrifugation or direct cold solvent quenching, aspirate supernatant, extract pellet immediately. |
Store at −80 °C; ship on dry ice |
| Conditioned Culture Medium |
≥ 200 μL matched supernatant |
Sample matched culture supernatant across labeling time points; clarify by centrifugation (4 °C) to quantify boundary exchange rates. |
Store at −80 °C; ship on dry ice |
Deliverables & Quantitative Reporting from Mammalian Cell MFA
- Deconvoluted Intracellular MID Matrix: Natural-abundance-corrected fractional labeling (M+0 to M+n) across glycolytic, TCA, amino acid, and lipid intermediates (.csv / Excel).
- Extracellular Boundary Exchange Rates: Quantified glucose, glutamine, and amino acid consumption alongside lactate and byproduct excretion rates.
- Compartmental Model Specifications: Reaction network definitions, carbon atom transition mappings, boundary constraints, and project configuration files.
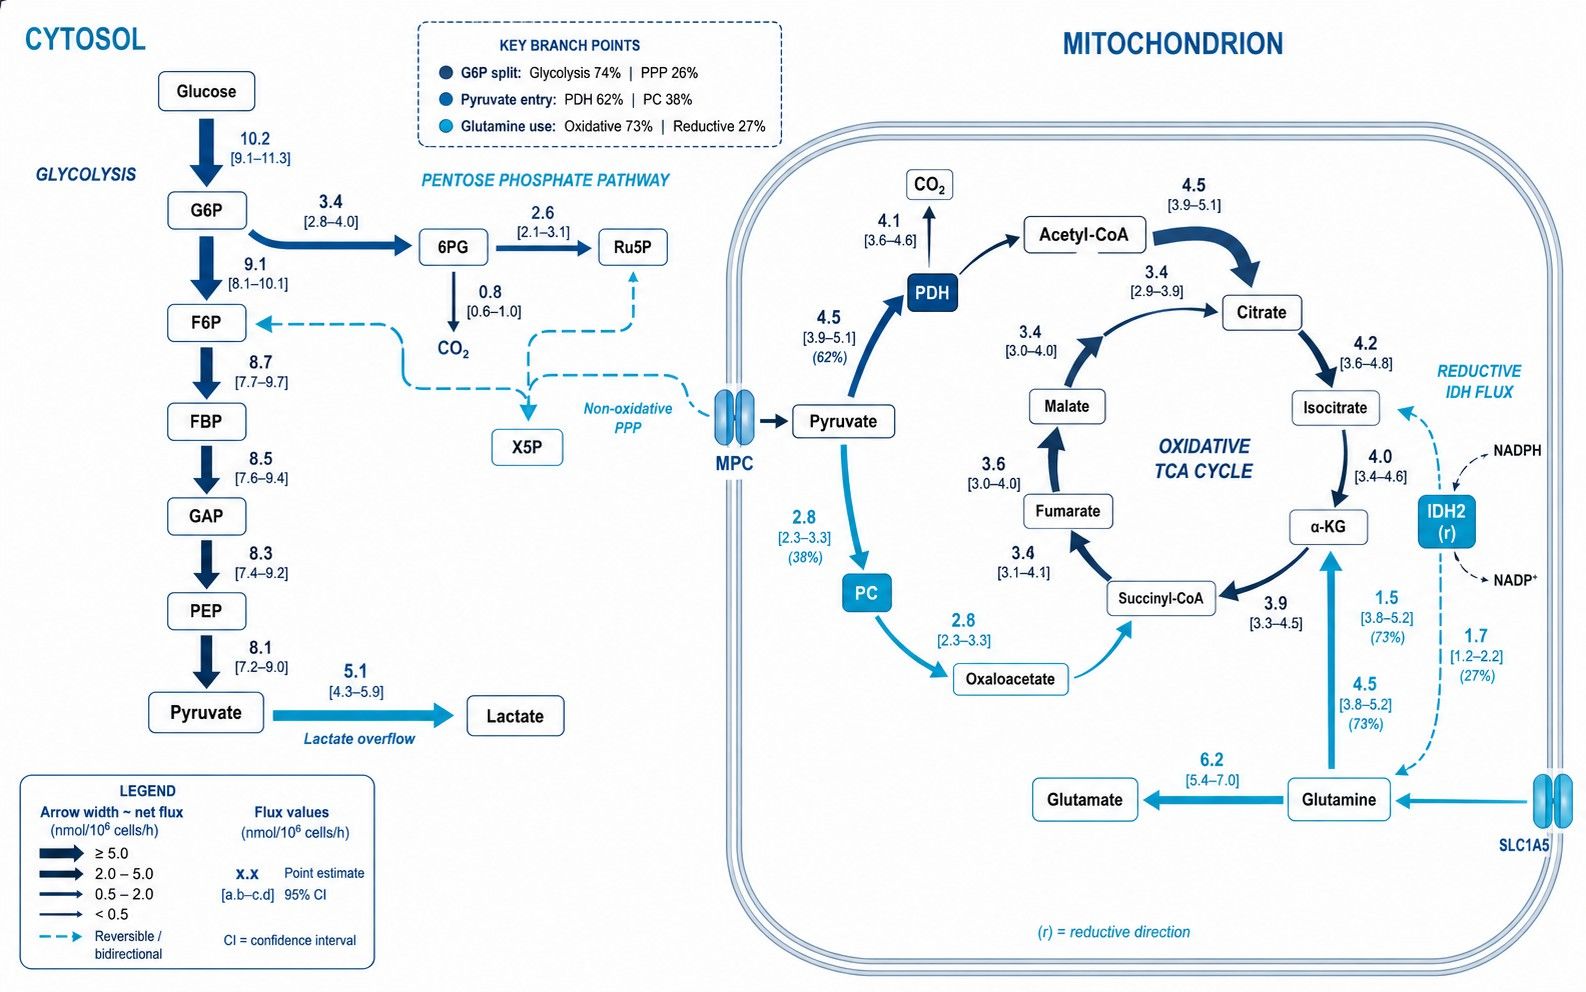
- Calculated Reaction Rates & Split Ratios: Absolute net fluxes (vnet) and exchange velocities (vxch) with 95% confidence intervals and branch-point ratios.
- Statistical Fit Diagnostics: Sum of squared residuals (SSR), Chi-square goodness-of-fit evaluation, and residual diagnostic plots.
- Publication-Ready Pathway Maps: High-resolution vector diagrams (PDF/SVG) illustrating mammalian cell metabolic flux partitioning.
How We Scope Mammalian Cell MFA Studies: Contribution Tracing, Flux Estimation, and Dynamic Perturbation
Mammalian cell flux projects vary significantly in biological complexity, sampling feasibility, and mathematical requirements. We review the following four scoping options during project feasibility assessment to align the experimental design with your exact research objective:
| Study Scoping Option |
Core Requirements & Experimental Feasibility |
Deliverable Scope & Modeling Approach |
| Option 1: Substrate Carbon / Nitrogen Contribution & MID Profiling |
Ideal for initial comparative screening, verifying nutrient uptake preferences, or confirming pathway entry. Requires stable isotope incubation and cell harvesting at steady state; does not require extracellular boundary rate measurements. |
Tracer-Derived Fractional Contribution: Deconvoluted mass isotopologue distributions (MIDs), percent enrichment, and qualitative pathway contribution bar charts across experimental cohorts. |
| Option 2: Absolute Net & Exchange Flux Estimation (Steady-State 13C-MFA) |
Requires true metabolic and isotopic steady state during labeling. Strict prerequisite: Synchronized cell growth curves, dry cell weight or cell count / protein normalization, and matched extracellular uptake and secretion rates (glucose, glutamine, lactate, amino acids). |
Stoichiometric 13C-MFA Model: Calculated in vivo reaction velocities (nmol/106 cells/h), branch-point split ratios, and profile likelihood 95% confidence intervals. |
| Option 3: Acute Drug Treatment, Hypoxia & Dynamic State Transitions |
Designed for acute perturbations (e.g. 0–6 h post-drug exposure), hypoxia induction, or rapid differentiation where metabolic or isotopic steady state cannot be assumed. Requires rapid time-course sampling (multiple time points). |
Isotopically Non-Stationary MFA (INST-MFA): Ordinary differential equation (ODE) modeling resolving transient labeling kinetics, intermediate pool sizes, and non-steady-state flux redistribution. |
| Option 4: Co-Cultures, Organoids & Heterogeneous Cell Mixtures |
For multi-cell systems (e.g. neuron-astrocyte co-cultures, tumor-stroma models, 3D organoids). Requires physical cell sorting (FACS/MACS), cell-type-specific metabolic reporters, or spatial sampling to resolve cell-specific fluxes; otherwise, results represent average bulk tissue readouts. |
Cell-Resolved vs. Bulk Flux Analysis: Clearly documented cell-type-specific flux deconvolution where sorting/reporters permit, or explicitly defined bulk system flux balance modeling. |


 Contact Us



