Glycolytic Pathway Metabolic Flux Analysis — Resolving Dynamic Reaction Velocities
Glycolysis serves as the primary route for glucose catabolism, generating cellular ATP, NADH, and
biosynthetic precursors. However, static intermediate pool sizes (e.g. FBP, PEP) cannot determine whether
high concentrations stem from accelerated pathway throughput or downstream enzymatic bottlenecks at pyruvate
kinase (PKM2) or lactate dehydrogenase (LDHA).
As a specialized pathway Spoke within our central
carbon metabolic flux analysis and broader metabolic
flux analysis service, Glycolytic Pathway MFA tracks 13C-glucose transit to resolve
critical branch-point fluxes:
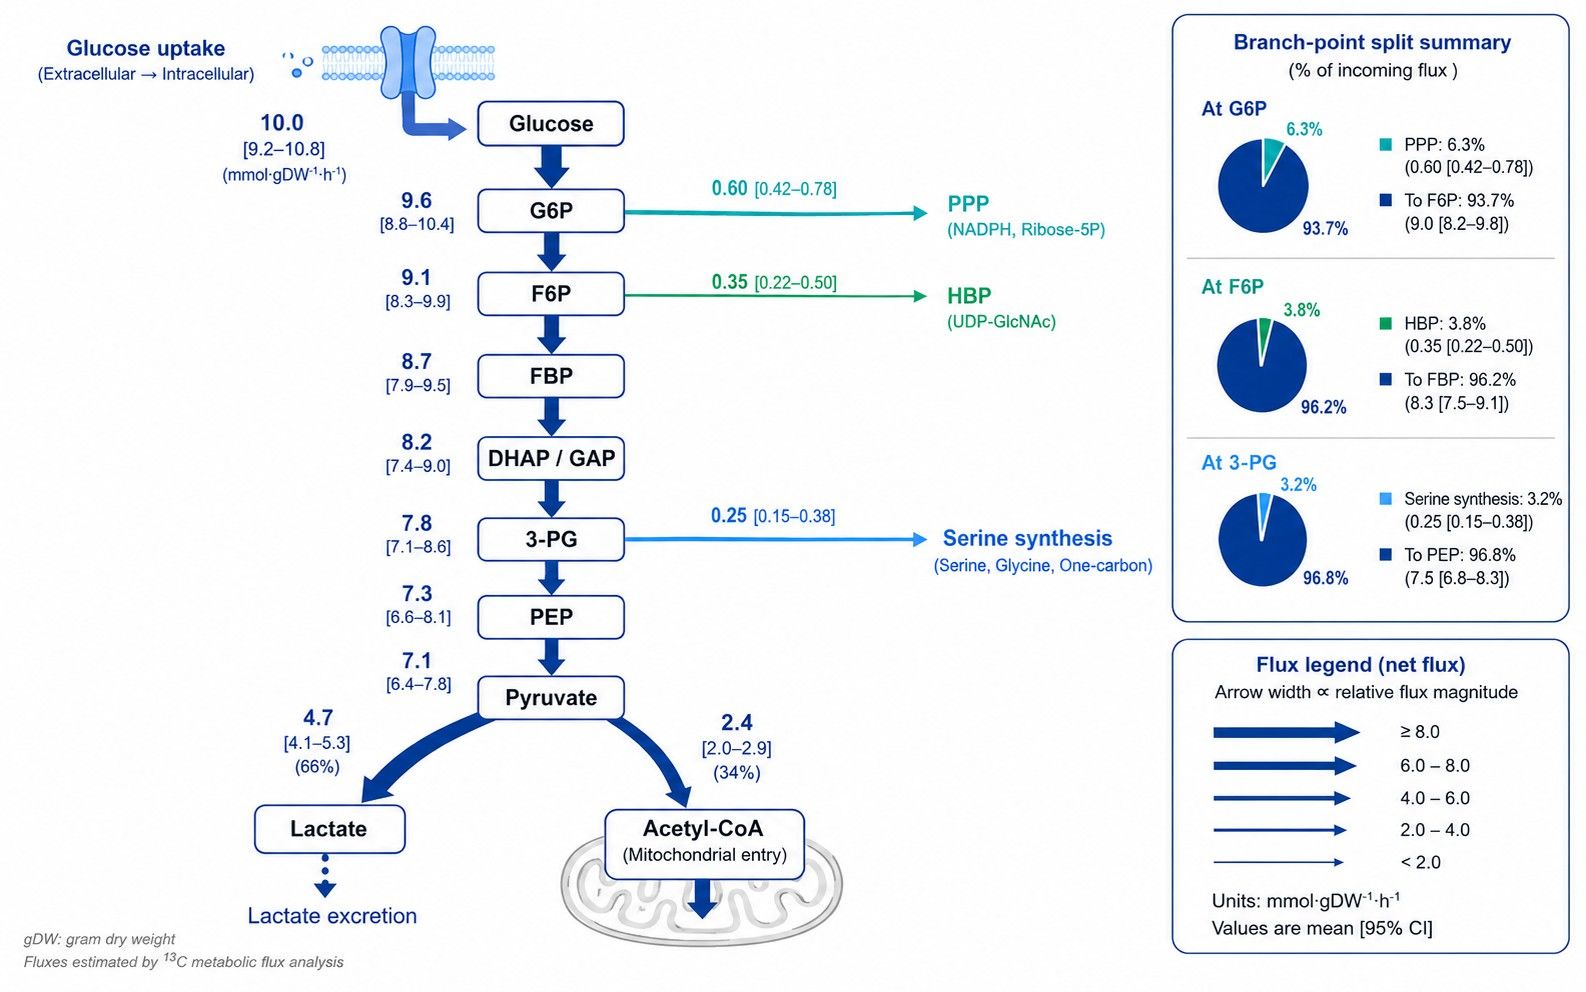
(i) G6P Branch Point: The relative split between forward glycolysis (PGI) and the
oxidative pentose phosphate pathway (G6PDH), detailed in our pentose phosphate pathway metabolic flux
analysis.
(ii) F6P Branch Point: Carbon diversion into the hexosamine biosynthetic pathway (GFAT)
for UDP-GlcNAc and protein glycosylation.
(iii) DHAP/GAP Branch Point: Carbon shunting via glycerol-3-phosphate dehydrogenase (GPDH)
into lipid backbones.
(iv) 3-PG Branch Point: Serine and glycine de novo biosynthesis via phosphoglycerate
dehydrogenase (PHGDH), fueling one-carbon folate pools.
(v) Pyruvate Branch Point: Cytosolic lactate fermentation (LDHA) versus mitochondrial
entry via PDH or PC into the TCA cycle, evaluated in our TCA cycle metabolic flux
analysis.
Looking for metabolite concentration measurements? If your project requires absolute or
relative quantification of glycolytic intermediate pool sizes (μmol/g or ng/mL) without stable isotope
tracing, please explore our Glycolysis Metabolism Service.
Analytical Considerations in High-Resolution Glycolytic Fluxomics
Quantifying glycolytic fluxes requires tailored bioanalytical strategies to capture polar, rapid-turnover
phosphorylated intermediates:
- Rapid Low-Temperature Metabolic Arrest: Phosphorylated trioses (DHAP, GAP, 1,3-BPG)
have rapid intracellular turnover kinetics. Pre-cooled organic solvent extraction halts post-harvest
enzymatic interconversion.
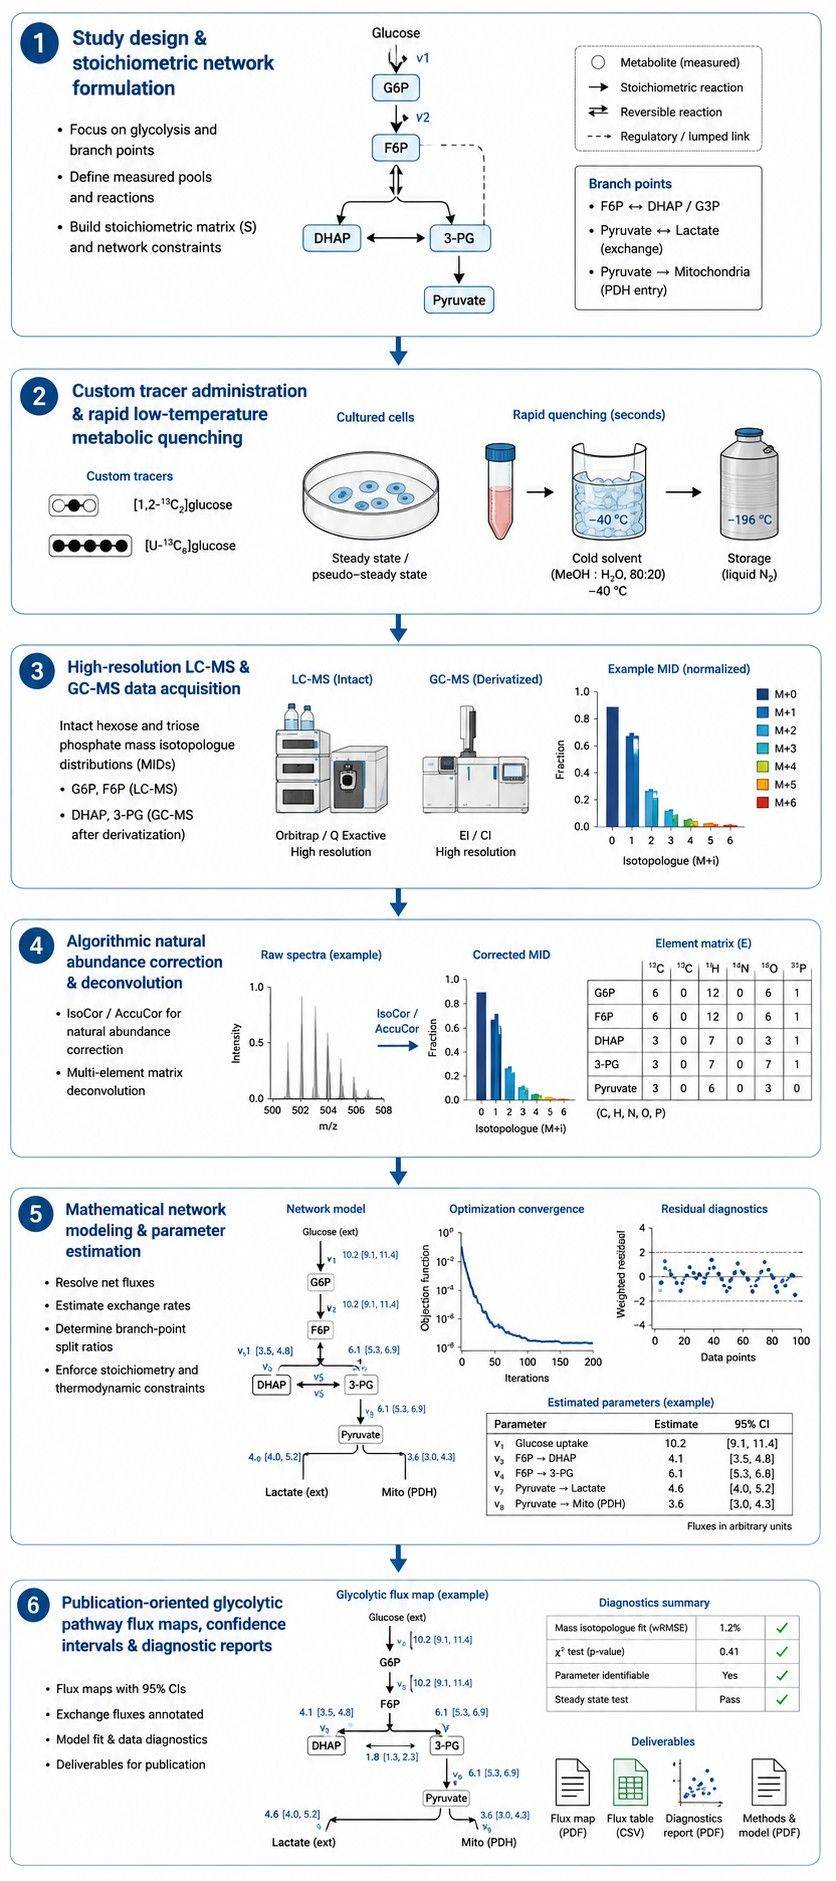
- Direct Phosphorylated Intermediate Profiling: We utilize high-resolution liquid
chromatography-mass spectrometry to separate isobaric hexose and triose phosphates (e.g. G6P vs. F6P, 3-PG
vs. 2-PG) without chemical derivatization.
- Orthogonal Fragment MID Confirmation: For downstream organic acids (pyruvate, lactate)
and amino acids (alanine, serine), complementary GC-MS-based metabolic flux analysis provides
fragment-specific carbon constraints via electron ionization (EI).
- Multi-Element Background Correction: Algorithmic matrix deconvolution (IsoCor /
AccuCor) corrects raw mass spectra for natural 13C, 15N, 18O, and silyl
tag isotopic abundances.
13C Tracer Selection Strategies for Glycolytic Branch-Point Resolution
The choice of isotope tracer dictates which glycolytic reactions and branch points can be mathematically
identified:
| Tracer Strategy |
Target Glycolytic Node |
Diagnostic MID Readout & Interpretation |
| [1,2-13C2]Glucose |
Glycolysis vs. Oxidative PPP (oxPPP) split ratio |
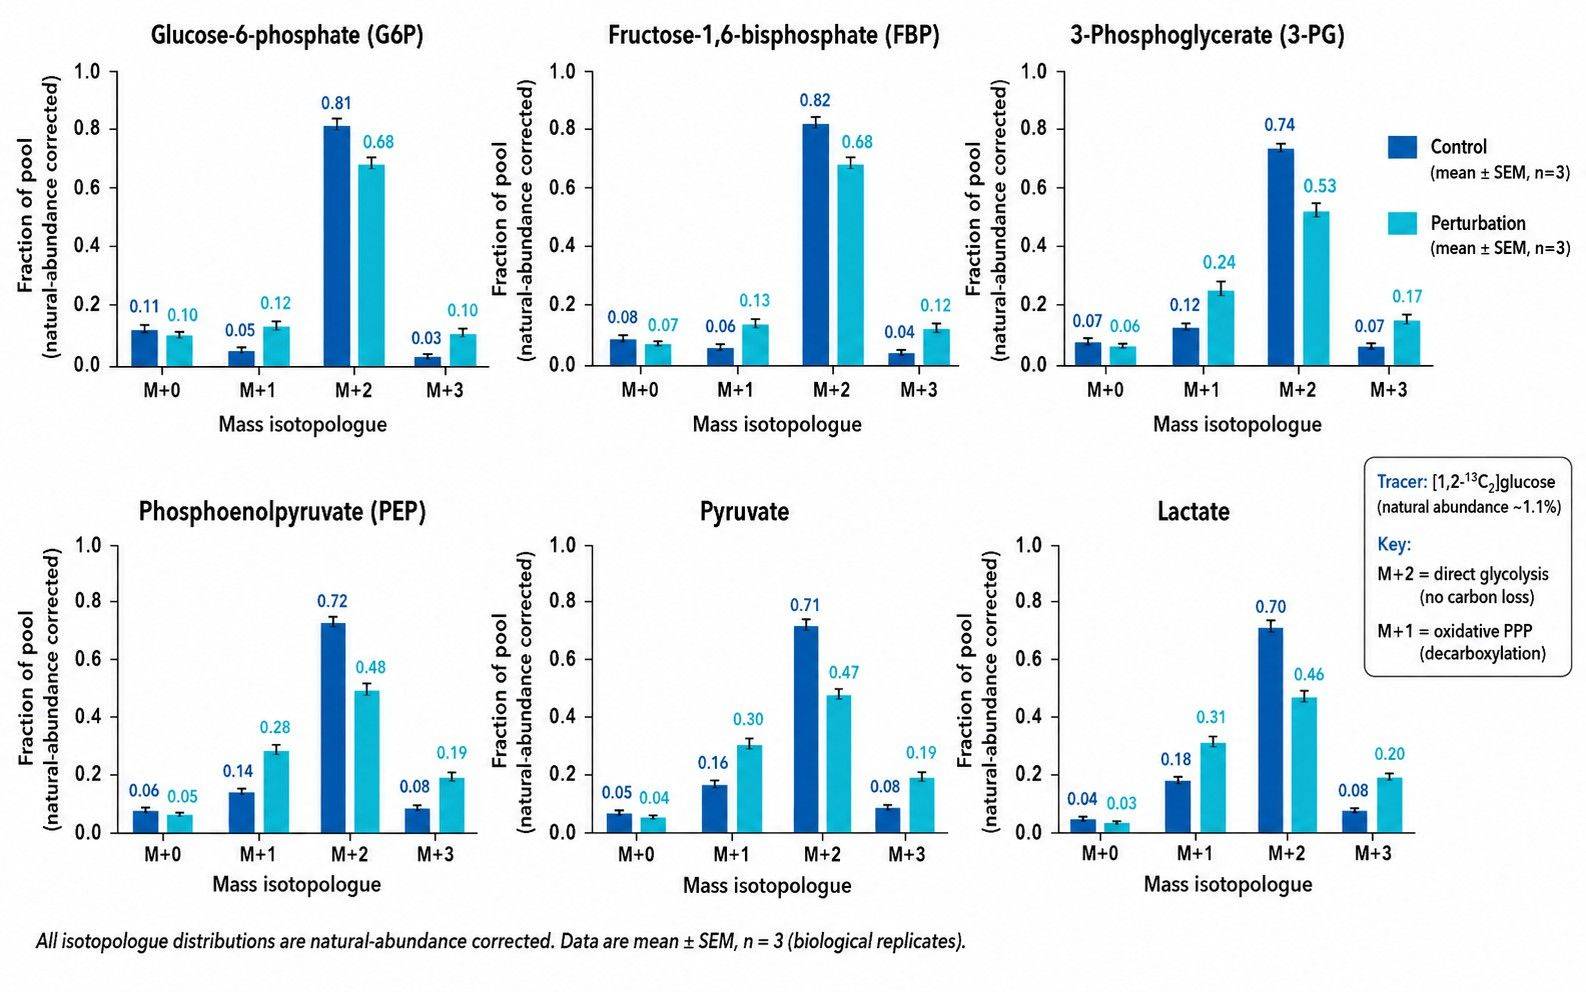
Direct glycolysis yields M+2 downstream triose phosphates and lactate (retaining C1-C2 intact),
whereas oxPPP decarboxylation of C1 yields M+1 pentose phosphates and downstream M+1 lactate.
Provides diagnostic labeling contrast that can support estimation of glycolytic and oxidative PPP
routing when incorporated into an appropriately constrained network model. |
| [U-13C6]Glucose |
Total glycolytic flux, pyruvate kinase velocity, and serine biosynthesis |
Uniformly labels glycolytic intermediates (M+3 trioses, M+3 3-PG, M+3 PEP, M+3 pyruvate/lactate).
Enables direct calculation of net glycolytic throughput and fractional contribution to mitochondrial
acetyl-CoA (M+2). |
| [1-13C]Glucose |
Triosephosphate isomerase (TPI) exchange and non-oxidative PPP reversibility |
Labels C1 of G6P. Aldolase cleaves F1,6BP into [1-13C]DHAP and unlabeled GAP. Rapid TPI
exchange equilibrates the label between DHAP and GAP, yielding M+1 downstream intermediates used in
our 13C metabolic flux analysis. |
| [3-13C]Glucose |
Serine pathway drainage & methylglyoxal bypass |
Yields [1-13C]GAP and unlabeled DHAP, selectively tracing the carbon-3 position through
3-PG into serine (M+1) and pyruvate (M+1). |
Technical Capabilities for Comprehensive Glycolysis Flux Analysis
- High-Resolution LC-MS & GC-MS Platforms: Sensitive detection of labile mono-, di-,
and bis-phosphate esters alongside fragment-resolved organic acids.
- Steady-State and Non-Stationary INST-MFA: Compatible with classic steady-state
13C-MFA as well as rapid time-course dynamic and INST metabolic flux analysis for
transient stimuli or nutrient switches.
- Statistical Identifiability and Uncertainty Analysis: Mathematical network modeling
with goodness-of-fit testing and parameter confidence interval estimation to verify well-constrained
fluxes.
- Orthogonal Positional Validation: High-field NMR-based metabolic flux analysis available for
resolving position-specific isotopomers in complex biofluids.
End-to-End Glycolytic Pathway MFA Workflow
Sample Preparation & Quenching Guidelines for Glycolytic MFA
Sample amounts and quenching procedures are finalized during feasibility review based on intermediate
abundance and matrix type:
| Sample Type |
Typical Input Guidelines |
Harvesting & Quenching Principles
|
Storage & Shipping |
| Adherent Mammalian Cells |
Typically 1–5 × 10⁶ cells (60 mm dish), confirmed by pilot assessment |
Aspirate tracer medium rapidly, add pre-chilled organic extraction solvent, cell detachment on dry
ice/ice. Avoid trypsin or warm PBS washes. |
Store at −80 °C; ship on dry ice |
| Suspension Mammalian Cells |
Typically 2–10 × 106 cells, adjusted to cell density |
Fast centrifugation or direct cold solvent quenching, aspirate supernatant, extract pellet
immediately in cold solvent. |
Store at −80 °C; ship on dry ice |
| Microbial / Fermentation Cultures |
Biomass volume determined by pilot extraction and target coverage |
Rapid vacuum filtration followed by immediate liquid nitrogen plunge, or fast methanol quenching.
Collect spent medium for extracellular rates. |
Store at −80 °C; ship on dry ice |
| Animal & Tumor Tissues |
20–50 mg wet weight, depending on metabolic activity |
Instant freeze-clamping or flash freezing in liquid nitrogen upon excision; cryo-pulverize under
liquid nitrogen without thawing. |
Store at −80 °C; ship on dry ice |
| Conditioned Culture Medium |
≥ 200 μL matched supernatant |
Sample matched culture supernatant across labeling time points; clarify by centrifugation (4
°C) to remove debris. |
Store at −80 °C; ship on dry ice |
Deliverables & Quantitative Reporting from Glycolytic MFA
- Deconvoluted Glycolytic MID Matrix: Natural-abundance-corrected fractional labeling
(M+0 to M+n) for G6P, F6P, FBP, DHAP, GAP, 3-PG, 2-PG, PEP, pyruvate, and lactate.
- Extracellular Boundary Rates: Quantified glucose consumption, lactate secretion, and
byproduct accumulation rates providing boundary constraints.
- Mathematical Model Specifications: Full stoichiometric reactions, carbon atom
transitions, and project configuration files.
- Calculated Reaction Rates & Split Ratios: Net and exchange fluxes with accompanying
sensitivity analysis and confidence intervals.
- Statistical Fit Diagnostics: Sum of squared residuals (SSR), goodness-of-fit
evaluation, and residual diagnostic plots.
- Publication-Ready Pathway Maps: Vector graphics (PDF/SVG) illustrating glycolytic
carbon routing with flux-scaled annotations.
Research Applications of Glycolytic Pathway Flux Analysis & Warburg Tracing
- Oncology & Warburg Effect Quantification: Measure aerobic glycolysis rates, PKM2
flux modulation, and small-molecule glycolytic inhibitor efficacy.
- Immunometabolism: Quantify glycolytic reprogramming and hexosamine pathway activation
during immune cell activation.
- Bioprocess & Metabolic Engineering: Identify pathway bottlenecks, eliminate
overflow acetate/lactate secretion, and maximize carbon yield in recombinant hosts.
- Cardiometabolic & Ischemia Studies: Track compensatory glycolysis activation and
substrate switching under hypoxic or metabolic stress.


 Contact Us



