

In Vivo Stable-Isotope Tracing Experimental Design: Bolus vs Infusion, Time Courses, Tissue Harvest, and Pool-Size Interpretation
Submit Your InquiryAn in vivo tracer study can produce clear isotopologue peaks and still fail to answer its metabolic question. The decisive variables are often set before LC-MS analysis begins: how the tracer enters the circulation, whether it perturbs the substrate pool, when plasma enrichment is measured, how quickly each tissue is quenched, and whether fractional labeling is interpreted together with metabolite abundance. These factors determine whether the result supports substrate incorporation, tissue contribution, turnover, or a quantitative flux claim.
Animal tracer studies should connect the delivery protocol to the rodent plasma and tissue collections used in animal metabolomics. The same design principles can be adapted to other research models, but tracer dose, infusion rate, fasting interval, and collection time must be established for the tracer, tissue, phenotype, and analytical objective; no single protocol is valid for every in vivo study.
In Vivo Stable-Isotope Tracing Objectives and Required Measurements
The first design decision is not which labeled substrate to purchase. It is the claim the experiment must support. A single tissue collected after labeled glucose administration may show that glucose carbon reached lactate, citrate, or amino acids. It does not, by itself, quantify glycolytic rate, pyruvate dehydrogenase flux, or net TCA-cycle turnover. Different claims require different input functions, sampling schedules, and mathematical assumptions.
Four common study objectives should be separated at the planning stage:
- Substrate incorporation: Does carbon or nitrogen from the administered tracer appear in a specified downstream metabolite?
- Fractional contribution: What fraction of a tissue metabolite pool was derived from the labeled precursor during the observation window?
- Turnover or synthesis: How rapidly is a pool replaced or synthesized over time?
- Quantitative metabolic flux: What is the rate of a reaction or pathway in amount per unit time, estimated under an explicit model?
The same LC-MS isotopologue table can contribute to all four questions, but it is not sufficient for all four. Incorporation may be supported by corrected mass isotopologue distributions (MIDs). Fractional contribution additionally requires precursor enrichment measured over the relevant interval. Turnover requires time-resolved labeling and pool-size information. Absolute flux generally requires an input function, concentration or pool measurements, model structure, and assumptions about steady state, exchange, recycling, and compartmentation. A metabolic flux analysis project should therefore be scoped around the intended inference rather than the visibility of one labeled product.
| Intended conclusion | Minimum design elements | Appropriate primary output | Main limitation if collected at one endpoint |
|---|---|---|---|
| The administered nutrient enters a pathway | Labeled tracer, unlabeled control, natural-abundance correction, product identity | Product MID and total labeled fraction | Does not quantify pathway rate |
| The tracer contributes differently between groups | Comparable plasma precursor enrichment, tissue MID, metabolite abundance | Precursor-normalized fractional contribution plus pool size | Group differences may reflect unequal tracer exposure |
| A pool turns over faster or more slowly | Pilot-informed time course, precursor enrichment at each interval, pool size | Labeling trajectory and fitted turnover parameter | A higher endpoint enrichment may reflect earlier exposure rather than faster turnover |
| A pathway flux changes | Time-resolved tracer data, extracellular or circulating inputs, pool sizes, explicit network model | Flux estimate with uncertainty and model diagnostics | Labeling alone cannot distinguish exchange from net flux |
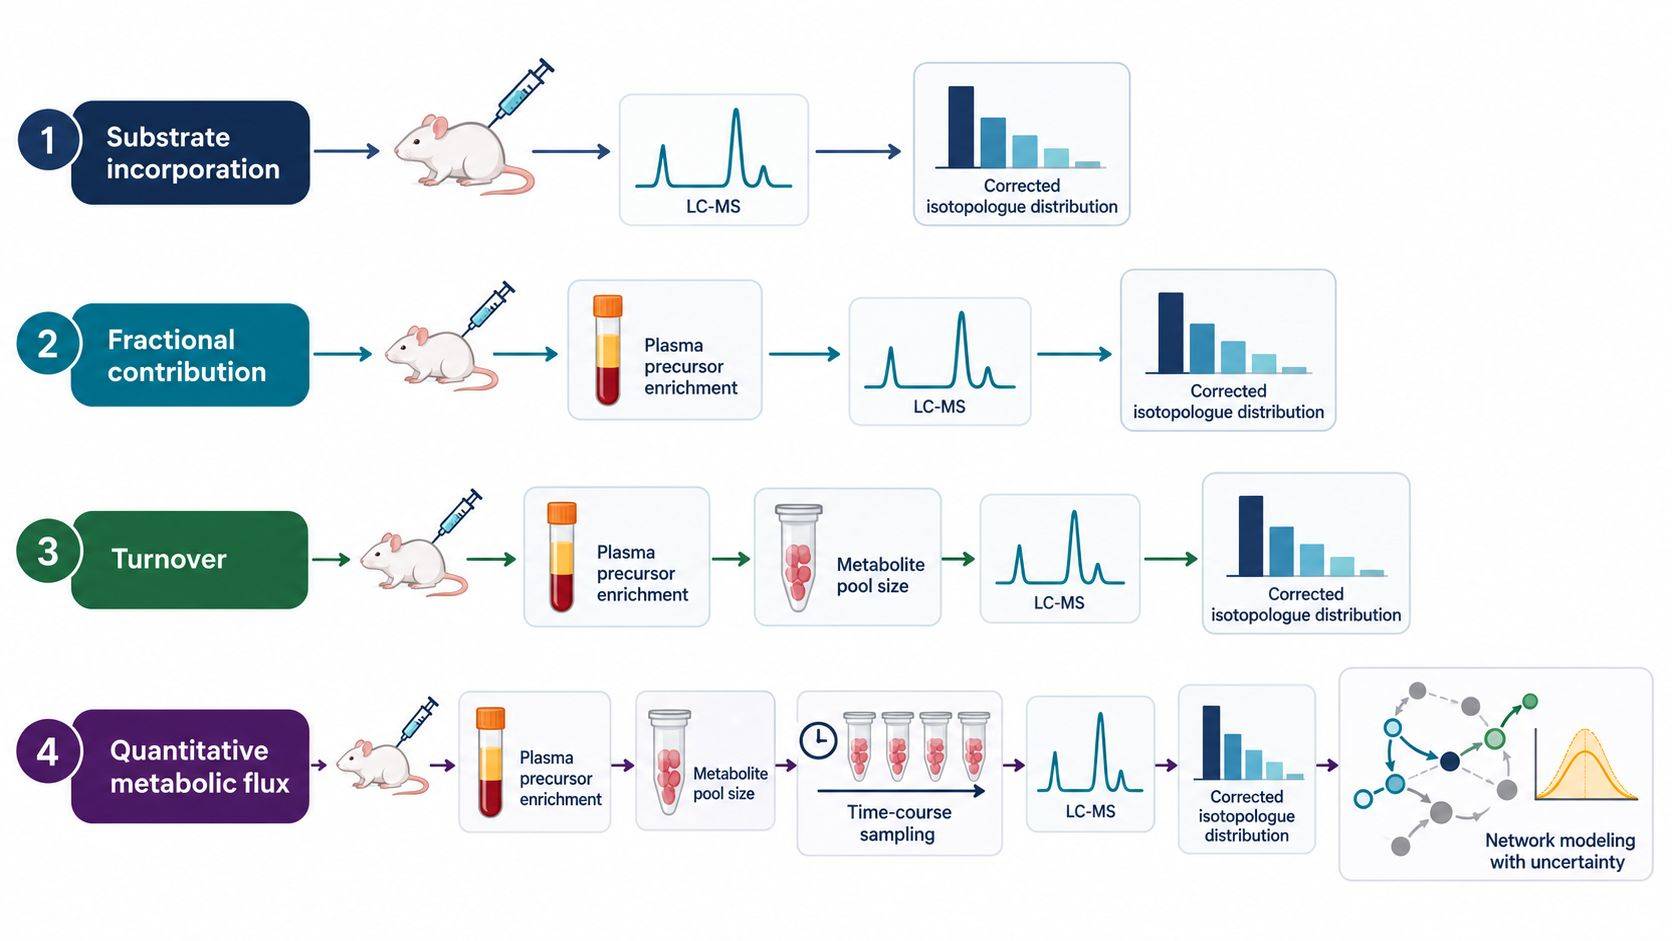 Figure 1. The metabolic claim determines the experiment. Substrate incorporation can be supported by corrected isotopologue data, whereas turnover and quantitative flux require time-resolved precursor exposure, pool-size measurements, and an explicit model.
Bolus, Repeated Bolus, and Primed Continuous Infusion
Tracer administration defines the precursor input function seen by every tissue. Route selection must account for how rapidly enrichment rises, whether substrate concentration is perturbed, how long the desired exposure can be maintained, and how much procedural stress the animal model can tolerate.
Single Bolus
A single intravenous bolus generates a sharp increase in circulating tracer enrichment followed by dilution, distribution, metabolism, and clearance. This design is useful for short pulse experiments, early pathway entry, rapid metabolite exchange, and situations in which a defined transient input is part of the model. It is operationally simpler than a long infusion, but the tissue collected at one time point integrates a rapidly changing plasma input. Small differences in injection duration, circulation time, or collection timing can therefore become apparent biological differences.
Intraperitoneal injection and oral gavage introduce additional absorption and first-pass variables. They may be appropriate when the research question includes intestinal absorption, portal delivery, or a physiologically relevant oral challenge. They are less suitable when a tightly controlled systemic input is required. Route cannot be treated as a convenience variable: intravenous, intraperitoneal, and oral administration generate different concentration and enrichment curves even when the nominal dose is identical.
Repeated Bolus
Repeated injections can prolong exposure without an implanted catheter and are used in some mouse studies. They also create a saw-tooth input profile, and each injection can introduce handling stress, volume load, and timing variation. The design should record every administration time and pair the tissue endpoint with measured circulating enrichment. Averaging the nominal dose over the experiment does not convert repeated boluses into a constant infusion.
Constant and Primed Continuous Infusion
Continuous intravenous infusion is used when the aim is to maintain a more stable circulating enrichment or estimate whole-body appearance and disappearance rates. A priming bolus can reduce the time required for the circulating pool to approach the intended enrichment, followed by a lower constant infusion. The required prime-to-infusion ratio depends on distribution volume, endogenous production, clearance, diet, phenotype, anesthesia, and tracer. A value taken from another model is a starting hypothesis, not a validated input function.
Continuous delivery is not automatically non-perturbative. If tracer administration substantially increases the total substrate concentration, the experiment measures the response to a substrate load as well as basal metabolism. Plasma concentration and enrichment should therefore be assessed together. A stable enrichment plateau with hyperglycemia, for example, is not equivalent to a stable enrichment plateau under euglycemic conditions.
| Delivery design | Strength | Principal risk | Evidence needed before interpretation |
|---|---|---|---|
| Single bolus | Simple transient input; useful for early kinetics and pulse-chase questions | Rapidly changing precursor enrichment and timing sensitivity | Dense pilot sampling of plasma concentration and enrichment |
| Repeated bolus | Extends exposure without continuous pump delivery | Saw-tooth enrichment, handling effects, injection-to-injection variation | Exact dosing record and plasma samples spanning the dosing cycle |
| Constant infusion | Supports a controlled input over a defined interval | Slow approach to plateau; catheter, restraint, or anesthesia effects | Serial plasma enrichment and concentration; line-patency documentation |
| Primed continuous infusion | Reaches target enrichment more rapidly | An excessive prime can perturb the substrate pool | Pilot optimization of both prime and maintenance rate |
| Oral or intraperitoneal delivery | Useful for absorption, portal, feeding, or practical model questions | Variable absorption and first-pass metabolism | Route-specific input curve rather than assumed systemic exposure |
Pilot Time Courses and Circulating Precursor Enrichment
An endpoint should be selected from the labeling kinetics of the actual system, not from the most convenient collection time. Glucose labels glycolytic intermediates quickly, whereas incorporation into downstream amino acids, lipids, nucleotides, or storage pools may require substantially longer exposure. Brain, liver, heart, muscle, adipose tissue, and tumor can also reach different apparent plateaus because their blood flow, transport, pool size, pathway activity, and compartmentation differ.
A pilot time course should answer three questions:
- Does circulating tracer enrichment reach the intended range without materially altering total substrate concentration?
- At which times do the selected tissue products show measurable, unsaturated labeling?
- Is the planned endpoint before, during, or after the relevant precursor or product plateau?
Because tissue collection is terminal in most rodent experiments, a tissue time course normally requires independent animals at each interval. This cross-sectional structure must be included in sample-size planning and randomization. Serial plasma microsamples may be obtained from the same animal when the collection method and allowable blood volume support it, but blood removal, restraint, and repeated anesthesia can themselves change physiology. The sampling plan should therefore balance temporal resolution against the perturbation introduced by sampling.
At minimum, plasma collected during the tracer period should measure the labeled precursor MID and the total precursor concentration. For [U-13C6]glucose, reporting tissue citrate or lactate labeling without plasma glucose enrichment leaves a major ambiguity: a group with higher tissue labeling may simply have received a higher effective precursor enrichment. If labeled lactate or other secondary metabolites accumulate in circulation, their MIDs can also be necessary to distinguish direct use of the infused nutrient from indirect delivery through systemic interconversion.
The pilot does not need to reproduce every biological comparison in the main study. Its purpose is to characterize input and response kinetics, identify a useful sampling window, evaluate detectable isotopologues, and reveal whether the proposed administration perturbs the metabolic state. Biological effects and formal group comparisons should remain reserved for the adequately powered study.
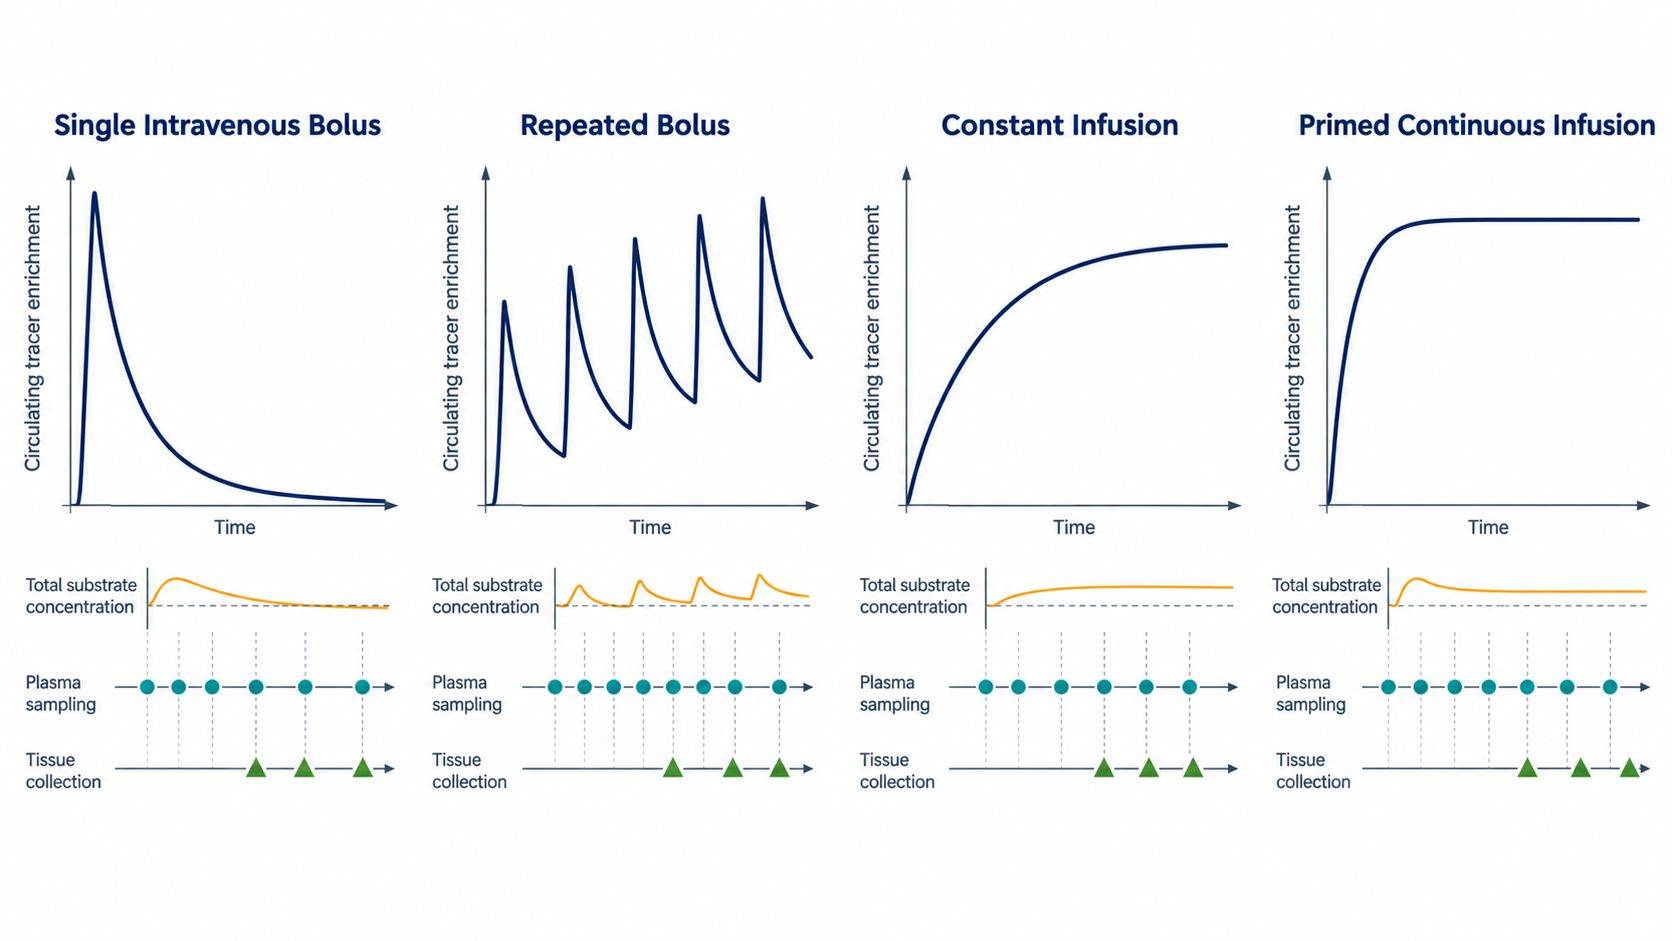 Figure 2. Tracer delivery produces different circulating input functions. Serial plasma sampling defines the exposure actually seen by tissues, while independent terminal cohorts provide tissue labeling trajectories without treating nominal dose as a surrogate for precursor enrichment.
Physiological Control During Tracer Administration
In vivo labeling measures metabolism under the experimental state created by the full procedure. Feeding status, handling, anesthesia, temperature, and circadian timing can change both circulating substrate supply and tissue pathway activity. These variables should be balanced and documented with the same care as genotype or treatment.
Feeding State and Circadian Time
Fasting suppresses dietary input but activates endogenous substrate mobilization, gluconeogenesis, fatty-acid oxidation, and hormonal responses. A longer fast is not inherently better. The interval should match the biological question, animal age, body size, tissue, and welfare constraints. Fed studies should control meal timing and composition because recent carbohydrate, lipid, and amino-acid intake changes both unlabeled dilution and endogenous substrate cycling. Collection at a consistent Zeitgeber time reduces avoidable circadian variation.
Anesthesia, Restraint, and Sampling Stress
Isoflurane, injectable anesthetics, restraint, catheter surgery, and repeated blood collection can alter glucose, lactate, free fatty acids, corticosterone, blood flow, and body temperature. The practical question is not whether all perturbation can be eliminated, but whether the procedure is consistent across groups and compatible with the metabolic endpoint. If anesthesia is required, concentration, duration, maintenance temperature, and time from induction to tissue quenching should be standardized. An awake infusion may reduce anesthetic exposure but introduces its own catheterization, habituation, and line-management requirements.
Infusion Volume, Osmolality, and Substrate Load
Tracer solutions should be prepared under controlled sterility, pH, concentration, and isotopic-purity conditions. Infusion volume and osmolarity must be compatible with the species and duration. More importantly, the combined labeled and unlabeled substrate concentration should be compared with the physiological pool. A tracer is analytically distinguishable from the tracee, but it remains chemically active substrate. Excess delivery can activate insulin secretion, alter substrate competition, or change the very pathway being measured.
Randomization should cover dosing order, pump position where relevant, tissue-collection order, extraction batch, and LC-MS injection sequence. If all controls are collected before all treated animals, collection-time drift becomes inseparable from treatment. The study manifest should retain animal ID, body mass, sex, age, diet, fasting start, tracer lot and purity, administration times, plasma collection times, anesthesia, body temperature, euthanasia time, tissue excision time, and freezing time.
Tissue Harvest, Blood Contamination, and Rapid Quenching
Metabolism continues during ischemia and dissection. ATP and phosphocreatine fall, glycolytic intermediates shift, lactate rises, redox couples change, and labile metabolites may be synthesized or degraded after circulation stops. The interval between loss of blood supply and freezing is therefore part of the measured phenotype.
The harvest plan should specify the anatomical region, order of dissection, maximum handling steps, quenching method, and person responsible for time recording. Pre-labeling tubes, arranging instruments in collection order, rehearsing the dissection, and assigning parallel operators can reduce variability more effectively than attempting to correct a poorly controlled delay during data analysis.
Freeze-clamping can provide rapid metabolic arrest for accessible tissues such as heart, liver, or skeletal muscle when the technique is compatible with the model. Liquid-nitrogen snap freezing is practical for many tissues, but a large intact specimen may cool slowly at its center. Thin pieces, precooled metal tools, and consistent tissue geometry improve reproducibility. Brain regions present a particular compromise between anatomical resolution and postmortem delay; the chosen dissection strategy must be consistent with the lability of the metabolites under study.
Residual blood is another source of ambiguity. Highly perfused tissue may contain labeled plasma precursor and circulating products that contribute to the extract. A brief cold rinse, blotting, perfusion, or vascular flushing may reduce blood contamination, but these operations consume time and can wash out diffusible metabolites or alter pools. They should not be imposed as a universal step. The protocol should instead define whether the endpoint concerns whole-organ exposure, tissue-cell metabolism, or a specific compartment and validate the selected approach. When tissue labeling could plausibly be dominated by blood, matched terminal plasma data and blood-associated markers provide essential context for tissue metabolomics.
Tissue mass, region, freeze time, storage history, thaw events, and extraction ratio should be captured in the sample manifest. Randomly varying the amount of tissue while using a fixed solvent volume changes extraction efficiency and matrix load. Cryogenic pulverization of a larger specimen before aliquoting can reduce regional heterogeneity, but it also removes spatial information; that trade-off should be decided before collection.
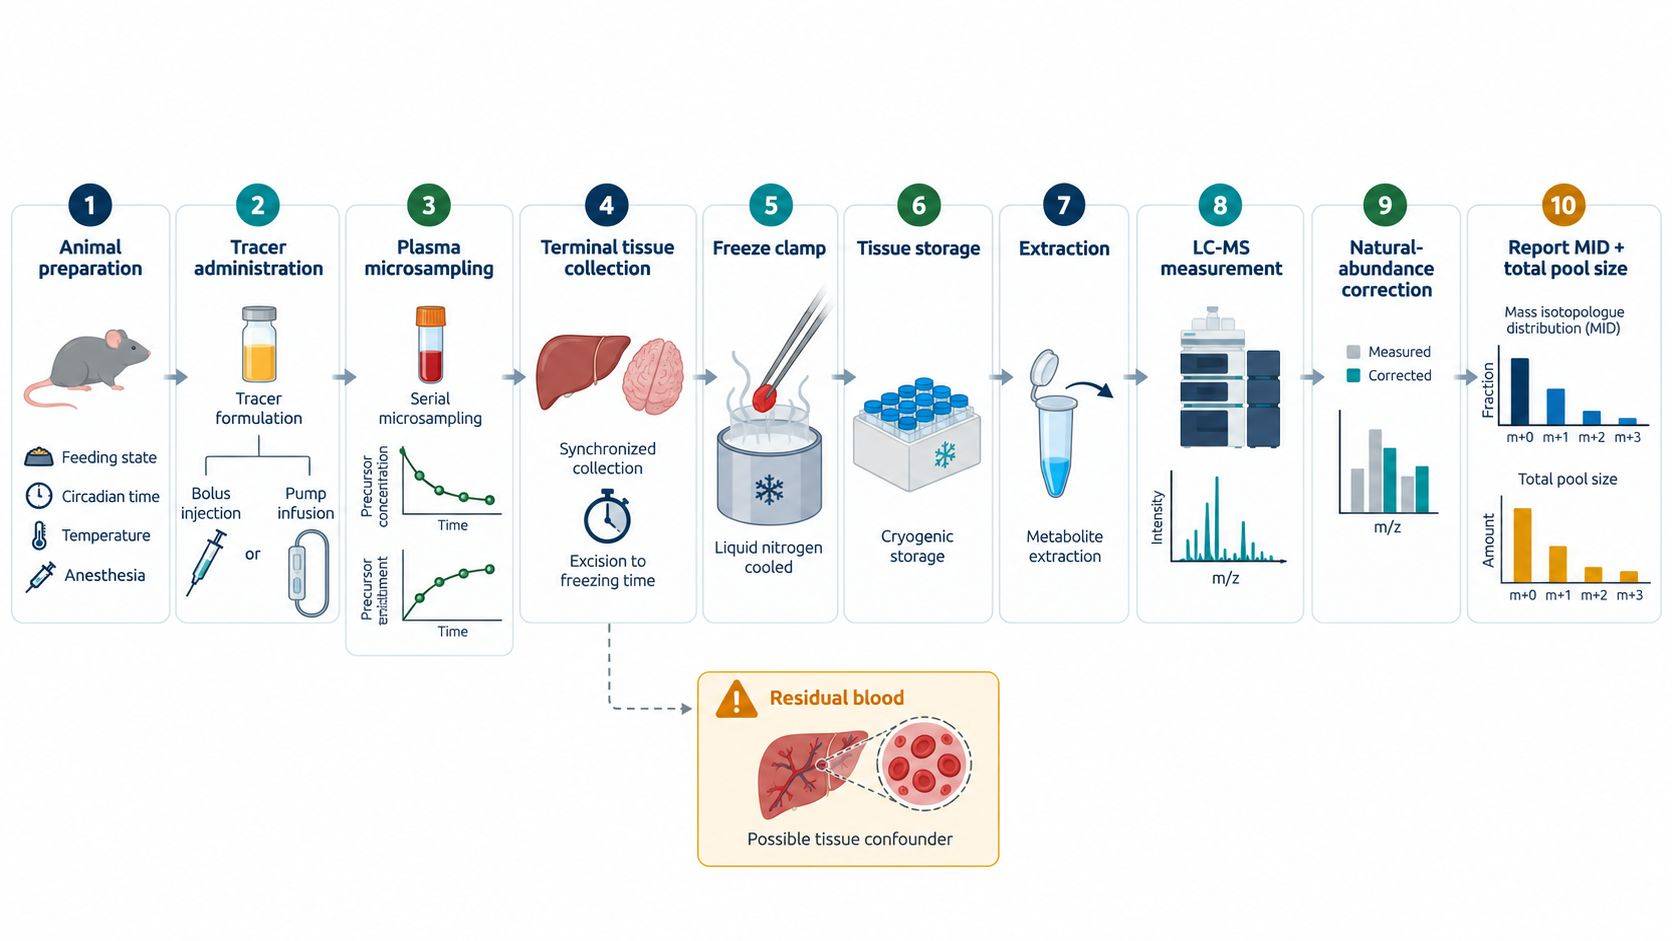 Figure 3. An interpretable in vivo tracing experiment preserves the complete timeline. Tracer input, physiological state, serial plasma enrichment, terminal tissue handling, and isotopologue measurement are linked by time-stamped metadata rather than treated as independent laboratory steps.
LC-MS Isotopologue Quantification and Quality Control
Stable-isotope experiments add analytical requirements beyond conventional metabolite profiling. The workflow must quantify the unlabeled isotopologue and each relevant labeled isotopologue across a wider dynamic range while distinguishing true tracer incorporation from natural abundance, overlapping ions, and background signals.
An unlabeled biological matrix is required to characterize natural isotopic envelopes and endogenous interference. Tracer isotopic purity and chemical purity should be documented by lot. Natural-abundance correction must reflect the elemental formula, tracer element, derivatization where applicable, and the isotopic purity of the administered material. Applying a generic correction matrix without checking formula and derivative composition can redistribute signal among M+0 through M+n.
Chromatographic resolution remains important even when exact mass is available. Coeluting isomers can have different labeling patterns, and in-source fragments may mimic the mass of a downstream metabolite. Identity should be supported by authentic retention time and appropriate MS/MS evidence for the claim. Integration should use consistent peak boundaries across isotopologues, with review of low-abundance peaks, saturation, carryover, and detector response. Isotopologues below the validated detection capability should not be converted into small positive values by imputation.
The tracer and the extraction internal standard serve different purposes. The administered tracer reports biological carbon or nitrogen transfer. A stable-isotope internal standard added during extraction or before injection monitors recovery, ionization, and analytical variation. Its labeling pattern must be chosen so it does not overlap the biological isotopologues being measured.
A suitable analytical sequence includes extraction blanks, solvent blanks, unlabeled biological samples, pooled QC material where available, and study samples randomized across the batch. Dilution or linearity checks are particularly useful when M+0 is abundant but high-order isotopologues approach the detection limit. QC review should evaluate retention-time stability, peak shape, internal-standard response, blank contribution, carryover, and MID reproducibility—not only total peak-area CV.
For each metabolite, the processed dataset should retain total signal or concentration, corrected abundance of every isotopologue, MID fractions, total labeled fraction, formula, retention time, identification evidence, and flags for integration or quantification limitations. Collapsing all labeled species into one percentage before QC removes information needed to recognize multiple pathway entries and later TCA-cycle turns.
Fractional Labeling, Pool Size, and Flux Interpretation
The most common interpretive error is to treat a higher fractional labeling value as proof of higher flux. Fractional labeling describes the composition of the measured pool. Its value depends on precursor enrichment, exposure time, pool size, unlabeled inputs, exchange reactions, recycling, and pathway rates.
Consider two tissues with the same amount of newly labeled product but different pre-existing unlabeled pools. The tissue with the smaller pool can show a larger labeled fraction even though synthesis is identical. Conversely, a rapidly expanding unlabeled pool can reduce fractional enrichment while absolute labeled product increases. Reporting both the corrected MID and the total pool abundance prevents these biologically distinct situations from appearing equivalent.
Precursor normalization must also be biologically appropriate. Plasma tracer enrichment is often the most accessible input measurement, but the immediate intracellular precursor may differ because of transport, dilution, compartmentation, or conversion through another circulating metabolite. Dividing every product by terminal plasma enrichment is therefore not a universal correction. The report should state which precursor pool is used, when it was sampled, why it approximates the relevant input, and how rapidly it changed over the labeling interval.
The distinction between metabolic and isotopic steady state is essential. A system can maintain stable metabolite concentrations while isotope enrichment is still changing. It can also reach an apparent labeling plateau while the biological state changes because of fasting, anesthesia, treatment, or substrate loading. Stationary 13C-MFA, isotopically nonstationary MFA, and descriptive tracer analysis make different assumptions; the analytical model should be selected according to the steady-state, sampling, and compartment assumptions supported by the experiment.
Cyclic pathways require additional restraint. In the first turn of the TCA cycle, [U-13C6]glucose-derived acetyl-CoA can produce characteristic M+2 labeling. Subsequent turns, exchange reactions, pyruvate carboxylation, labeled lactate recirculation, and other anaplerotic inputs create additional isotopologues. A bar chart of citrate M+2 alone may support glucose-carbon entry, but it does not isolate one enzyme flux unless positional information or a validated network model resolves competing routes.
Whole-tissue extracts are also mixtures of cell types and subcellular compartments. A change in labeling may reflect altered cellular composition, perfusion, substrate transport, or compartment-specific metabolism rather than uniform pathway regulation within every cell. Histology, cell-type markers, spatial sampling, or complementary assays may be needed when the biological claim is cell specific.
| Reported metric | What it describes | What it does not establish alone |
|---|---|---|
| Isotopologue abundance | Measured amount or signal for M+0, M+1…M+n | Relative composition of the whole pool unless normalized |
| Mass isotopologue distribution | Fraction of the measured pool represented by each isotopologue | Absolute pool amount or pathway flux |
| Total labeled fraction | Fraction containing at least one tracer-derived heavy atom | Which pathway or cycle generated the label |
| Precursor-normalized labeling | Product labeling relative to a defined precursor enrichment | Absolute rate without time and pool-size information |
| Fractional synthesis or turnover estimate | Fraction of a pool replaced per unit time under stated assumptions | Absolute synthesis rate unless multiplied by an independently measured pool size |
| Model-estimated flux | Reaction rate consistent with measurements and network assumptions | A model-independent truth; uncertainty and identifiability remain essential |
Data Reporting and Interpretation for Tissue-Specific Metabolism
An in vivo tracing report should preserve the chain from administered material to biological conclusion. At the study level, it should document tracer identity and purity, formulation, delivery route, prime and infusion schedule where applicable, physiological preparation, serial plasma concentration and enrichment, terminal collection times, tissue-specific quenching, and extraction batch. At the metabolite level, it should provide corrected isotopologue abundances, MIDs, total pool measurements, identification evidence, missingness, and analytical flags.
Interpretation should then match the strength of the evidence:
- Substrate incorporation is supported when tracer-derived isotopologues exceed the unlabeled background and analytical interference has been excluded.
- Comparative tissue contribution requires comparable precursor exposure, tissue pool measurements, and evaluation of labeled circulating intermediates.
- Turnover requires a time course that captures informative labeling kinetics and a stated precursor model.
- Quantitative flux requires a defined network, input and output measurements, pool-size or concentration information where required, model diagnostics, and uncertainty intervals.
Results should be reported at the highest inference level supported by the measurements. If plasma input, time-course, or pool-size data are absent, interpretation should remain limited to substrate incorporation or contribution. Collecting these measurements prospectively permits turnover or flux modeling without relying on post hoc assumptions.
References
- Fernández-García, J., Altea-Manzano, P., Pranzini, E., & Fendt, S.-M. (2020). Stable Isotopes for Tracing Mammalian-Cell Metabolism In Vivo. Trends in Biochemical Sciences, 45(3), 185–201. doi:10.1016/j.tibs.2019.12.002
- Faubert, B., Tasdogan, A., Morrison, S. J., et al. (2021). Stable isotope tracing to assess tumor metabolism in vivo. Nature Protocols, 16, 5123–5145. doi:10.1038/s41596-021-00605-2
- Yuan, M., Kremer, D. M., Huang, H., et al. (2019). Ex vivo and in vivo stable isotope labelling of central carbon metabolism and related pathways with analysis by LC-MS/MS. Nature Protocols, 14, 313–330. doi:10.1038/s41596-018-0102-x
- Buescher, J. M., Antoniewicz, M. R., Boros, L. G., et al. (2015). A roadmap for interpreting 13C metabolite labeling patterns from cells. Current Opinion in Biotechnology, 34, 189–201. doi:10.1016/j.copbio.2015.02.003
- Hui, S., Cowan, A. J., Zeng, X., et al. (2020). Quantitative Fluxomics of Circulating Metabolites. Cell Metabolism, 32(4), 676–688.e4. doi:10.1016/j.cmet.2020.07.013
- Schnelle, M., Chong, M., Zoccarato, A., et al. (2020). In vivo [U-13C]glucose labeling to assess heart metabolism in murine models of pressure and volume overload. American Journal of Physiology-Heart and Circulatory Physiology, 319(2), H422–H431. doi:10.1152/ajpheart.00219.2020
- Overmyer, K. A., Thonusin, C., Qi, N. R., Burant, C. F., & Evans, C. R. (2015). Impact of anesthesia and euthanasia on metabolomics of mammalian tissues: studies in a C57BL/6J mouse model. PLOS ONE, 10(2), e0117232. doi:10.1371/journal.pone.0117232
- Arnold, M., & Langhans, W. (2010). Effects of anesthesia and blood sampling techniques on plasma metabolites and corticosterone in the rat. Physiology & Behavior, 99(5), 592–598. doi:10.1016/j.physbeh.2010.01.021
- Dienel, G. A. (2021). Stop the rot. Enzyme inactivation at brain harvest prevents artifacts: A guide for preservation of the in vivo concentrations of brain constituents. Journal of Neurochemistry, 158(5), 1007–1031. doi:10.1111/jnc.15293
- Lane, A. N., Yan, J., & Fan, T. W.-M. (2015). 13C tracer studies of metabolism in mouse tumor xenografts. Bio-protocol, 5(22), e1650. doi:10.21769/BioProtoc.1650

 Contact Us


