Fluxomics & Metabolic Flux Data Analysis — From Raw Spectra to Biological Insight
Stable isotope tracing experiments generate complex mass isotopologue distributions (MIDs) that reflect intracellular carbon and nitrogen atom transitions. However, raw mass spectra, chromatographic peak areas, and fractional labeling patterns cannot directly reveal absolute in vivo reaction rates (μmol/gDW/h), pathway branch-point split ratios, or rate-limiting metabolic bottlenecks without rigorous mathematical modeling and statistical parameter estimation.
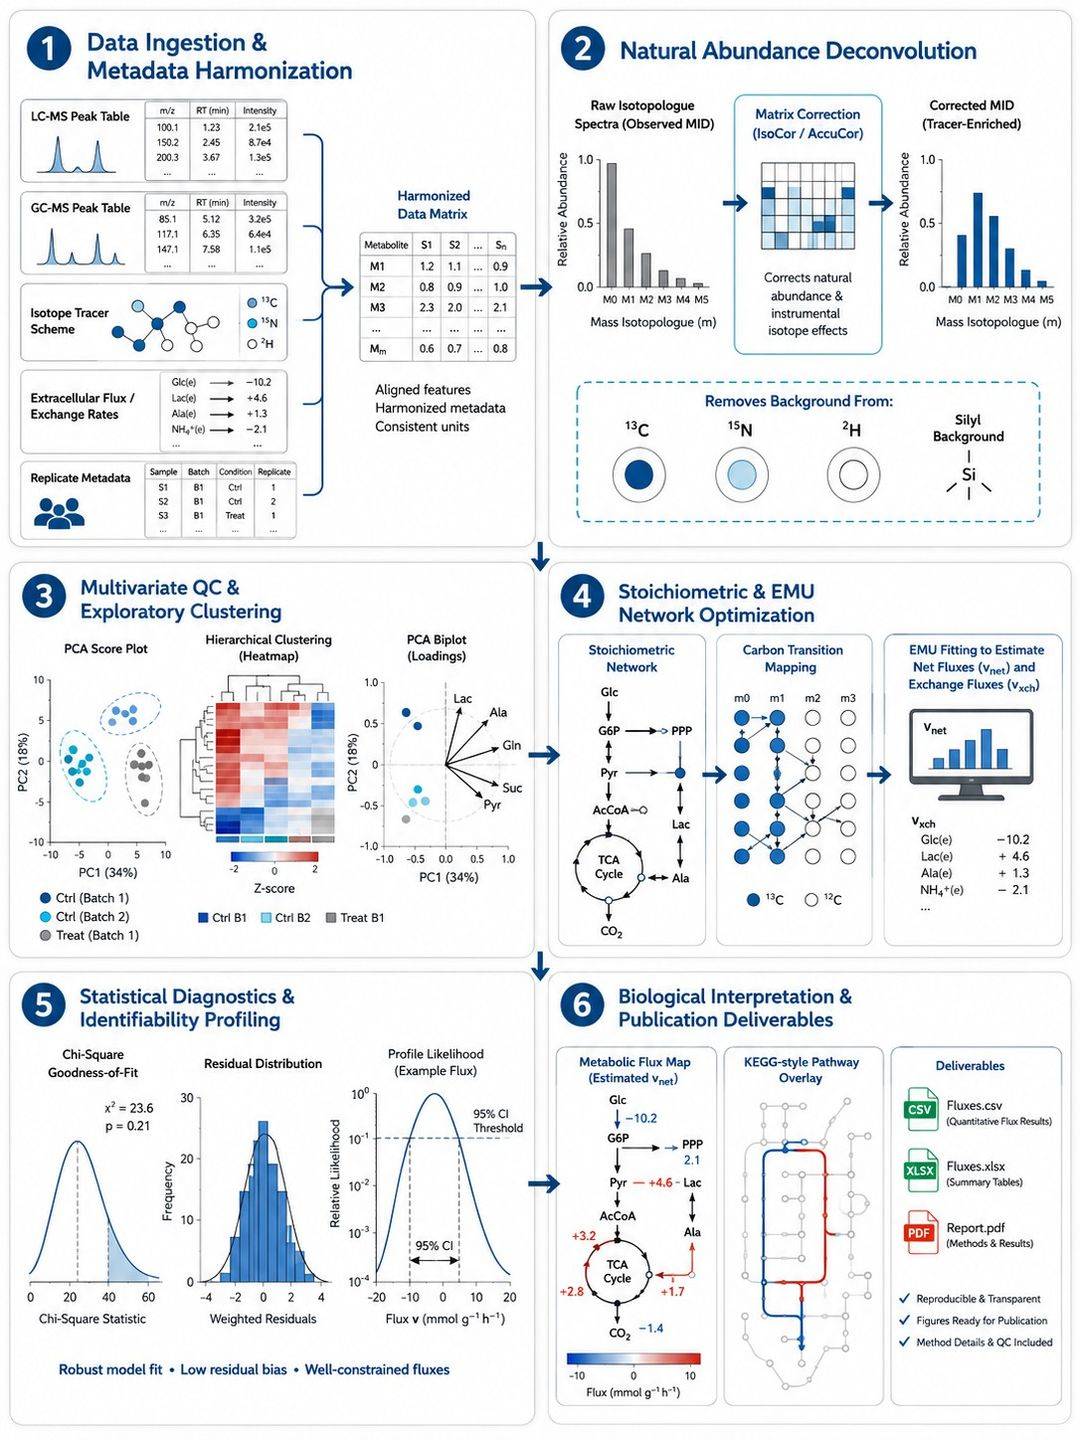
As the central computational engine supporting our broader metabolic flux analysis service, our Fluxomics Data Analysis Service provides comprehensive bioinformatics and biostatistical pipelines to decode metabolic kinetics across five core analytical pillars:
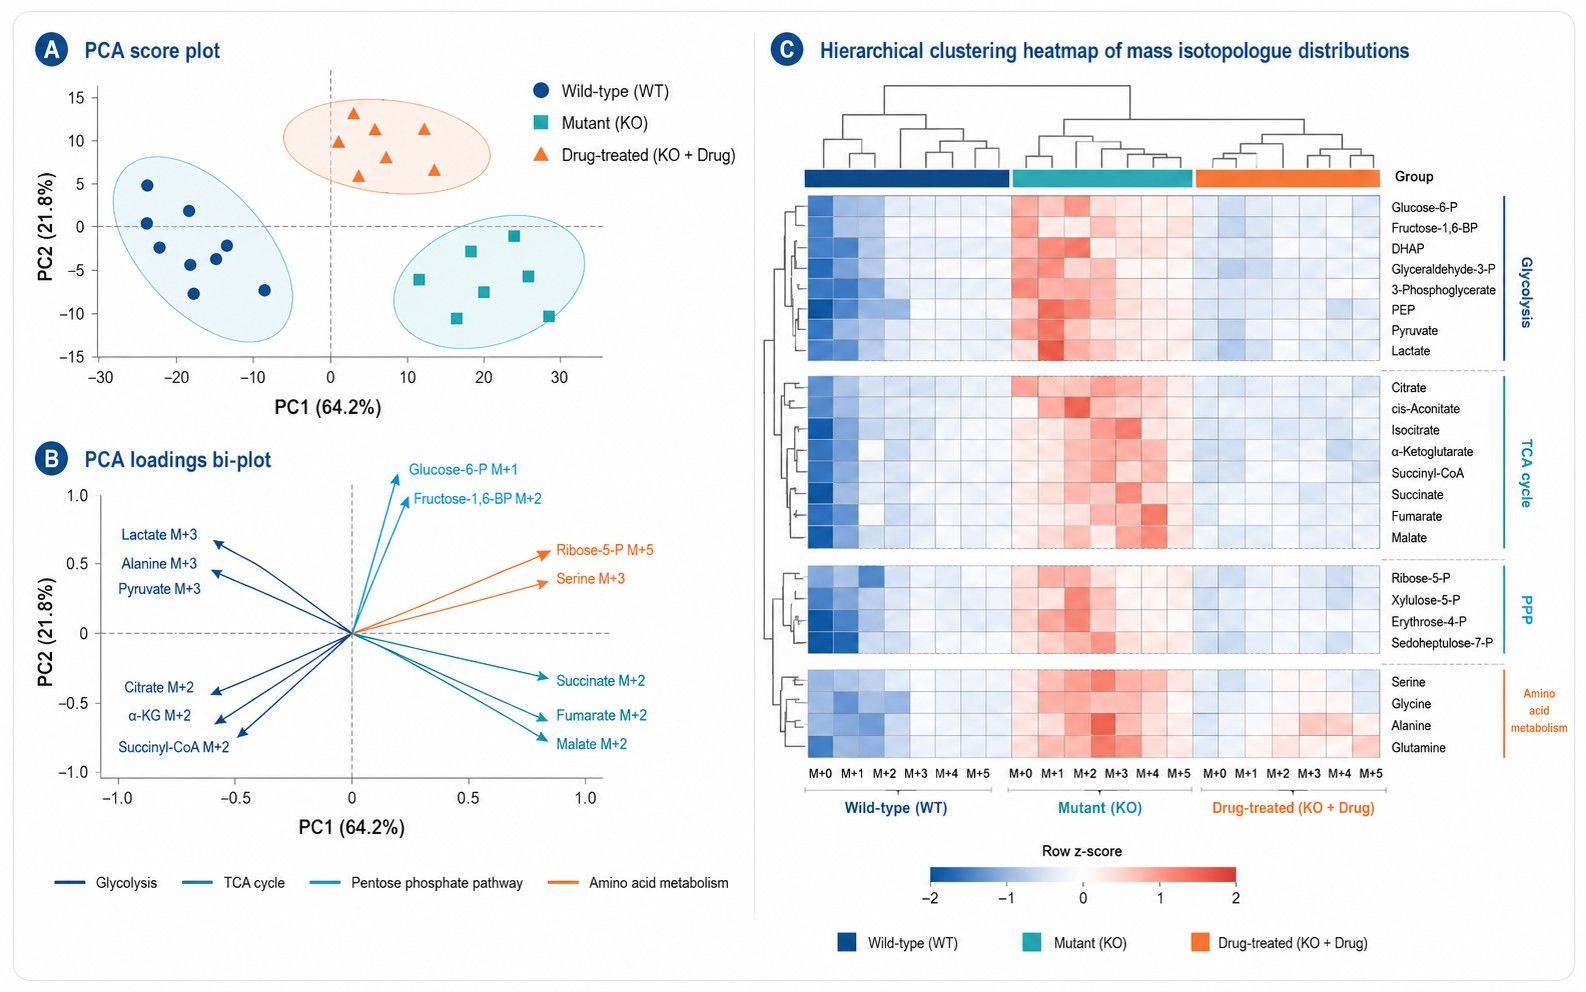
(i) Isotopic Deconvolution & Multivariate QC: Algorithmic correction for natural isotopic abundance (13C, 15N, 2H, 18O, and silyl tags) followed by unsupervised Principal Component Analysis (PCA), Hierarchical Cluster Analysis (HCA), and Bi-plot mapping to audit sample clustering and tracer labeling trajectories.
(ii) Stoichiometric 13C-MFA & EMU Network Modeling: Mathematical fitting of carbon atom transition matrices to calculate net and exchange fluxes (vnet, vxch) across central metabolism, powering our 13C metabolic flux analysis and central carbon metabolic flux analysis.
(iii) Analytical Flux Ratio Analysis: Probabilistic evaluation of intact versus cleaved carbon skeleton routing (e.g. PDH vs. PC entry, oxPPP fraction, transketolase reversibility) to quantify local branch-point ratios independent of global network optimization.
(iv) Genome-Scale Flux Balance Analysis (FBA): Integrating experimentally measured extracellular boundary fluxes and isotope constraints into genome-scale metabolic models (GEMs) to simulate pathway optimizations (pFBA, MOMA) and evaluate metabolic engineering yields.
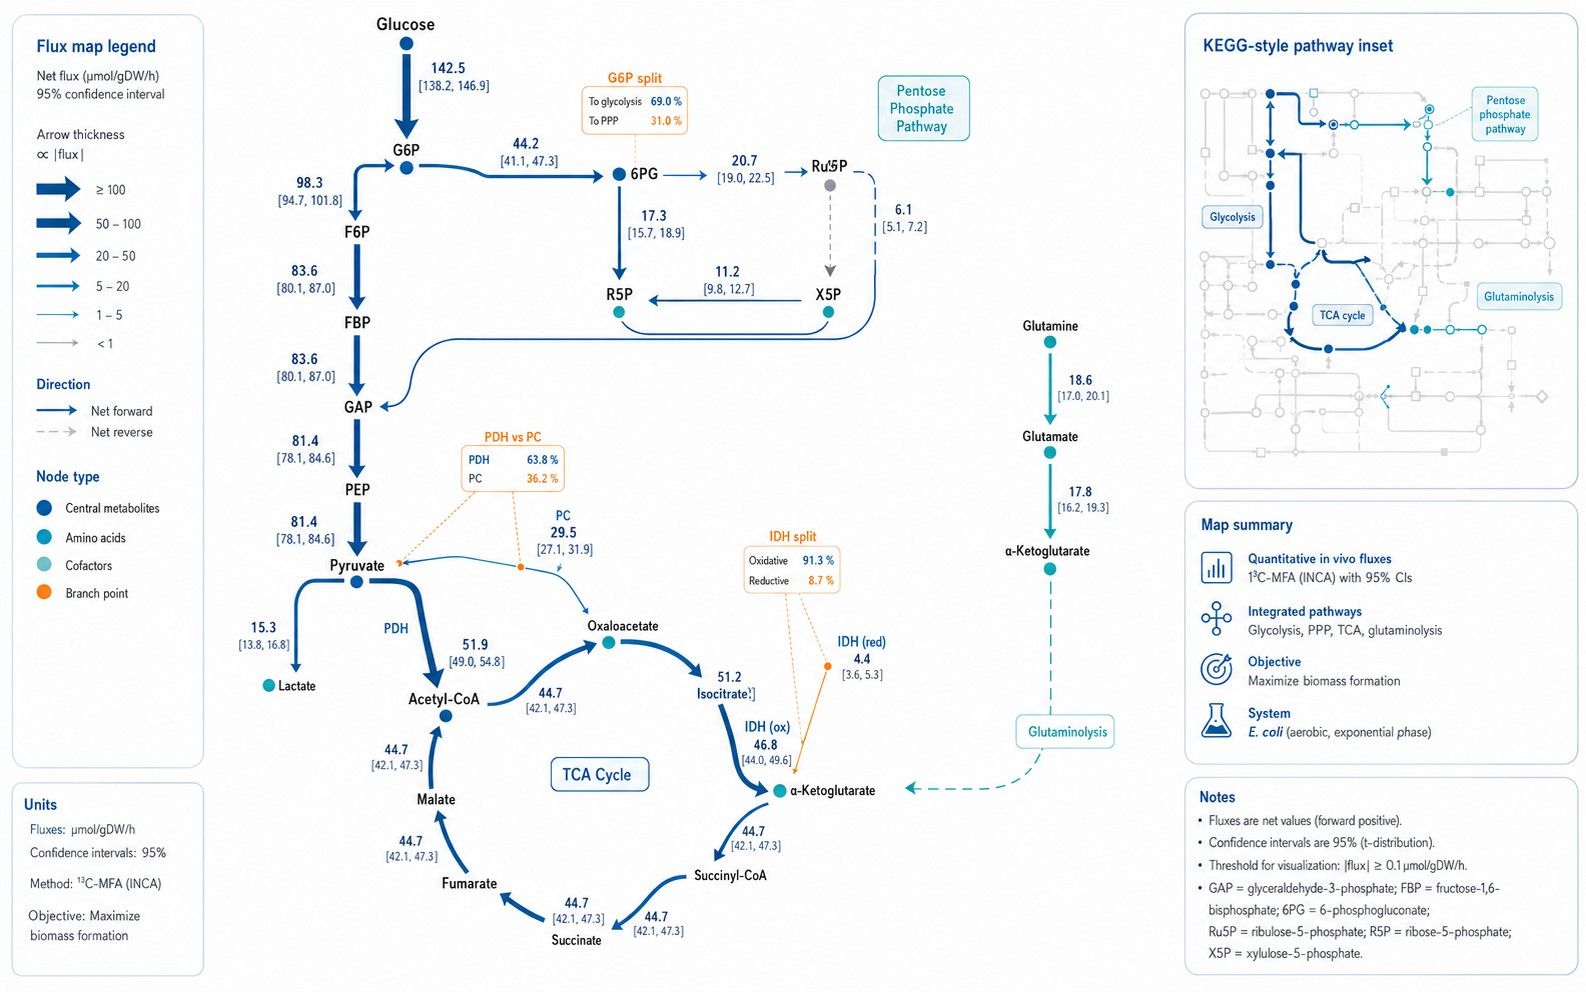
(v) Functional KEGG Pathway Mapping & Interpretation: Projecting computed reaction velocities onto high-resolution KEGG pathway architectures to contextualize multi-pathway flux rewiring under genetic, pharmacological, or disease perturbations.
Looking for standard metabolomics statistical analysis? If your project requires univariate and multivariate statistical analysis (fold change, volcano plots, PLS-DA, VIP scores) for static metabolite concentrations without stable isotope flux modeling, please explore our Metabolomics Bioinformatics Service.
How We Scope Existing Isotope-Tracing Data for Analysis
To establish a defensible modeling strategy, we evaluate incoming dataset structures across four analytical tiers, matching available isotope constraints with appropriate computational depth:
| Analytical Tier |
Input Data Requirements |
Deliverables & Biological Value |
| Tier 1: Isotope Pattern & QC Verification |
Raw or centroided LC-MS/GC-MS peak tables, unlabelled control samples, tracer purity information. |
Natural-abundance-corrected MIDs (IsoCor/AccuCor), analytical precision audits, replicate consistency plots, and baseline noise deconvolution. |
| Tier 2: Analytical Flux Ratio Calculation |
Steady-state MIDs from position-specific tracers (e.g. [1,2-13C2]glucose, [U-13C5]glutamine). |
Direct algebraic resolving of key metabolic branch points (oxPPP vs. EMP split, PDH vs. PC entry, reductive IDH fraction) with statistical confidence intervals. |
| Tier 3: Compartmental 13C-MFA Network Modeling |
Complete central carbon MIDs, measured extracellular rates (substrate uptake, byproduct excretion), specific growth rate. |
Global stoichiometric reaction rates (vnet, vxch), Chi-square (χ2) goodness-of-fit testing, profile likelihood 95% confidence intervals, and vector pathway maps. |
| Tier 4: Genome-Scale Flux Balance Analysis (FBA) |
Extracellular exchange fluxes, biomass composition, optional 13C-MFA flux constraints, organism-specific GEM model. |
Genome-scale metabolic flux distribution, shadow price sensitivity analysis, gene knockout phenotype predictions, and carbon yield optimization. |
Core Computational Modules in Fluxomics Data Analysis
Our bioinformatic suite integrates dedicated modules tailored to distinct isotopic modeling and statistical requirements:
| Analysis Module |
Methodology & Computational Engine |
Deliverable & Biological Value |
| Mass Isotopologue Distribution (MID) Deconvolution |
Matrix-based correction algorithms (IsoCor, AccuCor, ChemStation/Xcalibur parser) resolving natural isotopic backgrounds across LC-MS and GC-MS platforms. |
Delivers pure, tracer-derived fractional labeling vectors (M+0 to M+n) across all target intermediates with analytical variance estimates. |
| Multivariate QC & Pattern Recognition (PCA, HCA, Bi-plot) |
Unsupervised dimensionality reduction and clustering on corrected MID matrices; score plots, loadings, hierarchical dendrograms, and simultaneous sample-variable Bi-plots. |
Evaluates experimental reproducibility across biological replicates, identifies batch outliers, and reveals primary metabolic clustering trends across experimental groups. |
| Stoichiometric 13C-MFA Network Modeling |
Non-linear least squares minimization (INCA, 13C-FLUX2, OpenFLUX) solving stoichiometric and EMU balance equations at isotopic steady state. |
Calculates absolute in vivo net fluxes (vnet) and reversible exchange fluxes (vxch) across glycolysis, PPP, TCA cycle, amino acids, and one-carbon metabolism. |
| Isotopically Non-Stationary MFA (INST-MFA) |
Ordinary differential equation (ODE) modeling tracking transient isotopologue accumulation over rapid time courses. |
Quantifies metabolic fluxes and intracellular metabolite pool sizes in autotrophic organisms, slow-growing systems, or acute pharmacological transitions within our dynamic and INST metabolic flux analysis framework. |
| Analytical Flux Ratio Analysis |
Probabilistic equations evaluating intact versus cleaved bond patterns from position-specific tracers (e.g. [1,2-13C2]glucose, [U-13C5]glutamine). |
Directly resolves localized pathway split ratios (e.g. PDH vs. PC entry into the TCA cycle, oxidative PPP fraction, reductive IDH fraction) independent of global network assumptions. |
| Genome-Scale Flux Balance Analysis (FBA / pFBA / MOMA) |
Constraint-based linear and quadratic programming utilizing curated genome-scale reconstructions (Recon3D, Human-GEM, iML1515, Yeast9). |
Predicts optimal biomass yields, pathway capacity limits, gene knockout phenotypes, and metabolic overflow across thousands of compartmentalized reactions. |
| Functional KEGG Pathway Mapping & Enrichment |
Integration of calculated flux vectors with KEGG, BioCyc, and Reactome pathway databases; statistical overrepresentation and flux-weighted topology analysis. |
Translates mathematical flux values into intuitive, publication-ready biological visualizations, highlighting significantly reprogrammed metabolic cascades. |
Statistical Validation, Identifiability & Confidence Interval Assessment
- Goodness-of-Fit & Chi-Square (χ2) Diagnostics: Global model validity is evaluated by comparing the sum of squared residuals (SSR) against the theoretical Chi-square distribution at the corresponding degrees of freedom, ensuring the model fits experimental data within measurement noise.
- Profile Likelihood & Parameter Identifiability: Non-linear profile likelihood estimation systematically evaluates whether each estimated flux is mathematically identifiable, distinguishing well-constrained reactions from practically or structurally unidentifiable parameters.
- Monte Carlo Error Propagation: Multi-run stochastic parameter sampling generates rigorous 95% confidence intervals for all calculated net and exchange fluxes, reflecting experimental measurement variance.
- Sensitivity & Shadow Price Analysis: Linear programming dual variable (shadow price) and sensitivity matrix calculations identify rate-limiting enzymatic steps and critical metabolic constraints.
End-to-End Fluxomics Data Analysis Pipeline
Input Data Requirements & Supported File Formats
Our fluxomics computational engine accepts data generated across all major mass spectrometry instruments (Thermo Scientific, Agilent, Waters, Sciex, Bruker) and external research pipelines:
| Input Category |
Accepted File Formats |
Required Data Fields |
Quality Requirements |
| Raw or Integrated MS Data |
.csv, .xlsx, .tsv, .mzML, .mzXML, ChemStation / Xcalibur export |
Metabolite ID, formula/derivative, retention time, m/z values, raw peak areas for M+0 to M+n envelopes across all replicates. |
Minimum 3 biological replicates recommended; baseline peak resolution without detector saturation. |
| Extracellular Rate Measurements |
.csv, .xlsx, text tables |
Specific growth rate (μ, h−1), substrate consumption rates (e.g. glucose, glutamine), byproduct secretion rates (e.g. lactate, acetate) in mmol/gDW/h or nmol/106 cells/h. |
Matched culture time points; cell count or dry cell weight normalization data. |
| Tracer & Network Specifications |
.sbml, .json, .xlsx, INCA model (.m), text reaction lists |
Tracer isotopic purity and atom labeling positions (e.g. [U-13C6]glucose, 99 atom %); customized stoichiometric reaction list and carbon transitions if applicable. |
Well-defined atom mappings across reversible and irreversible network nodes. |
| Experimental Metadata |
.xlsx, .csv, structured text |
Sample group labels, treatment conditions, time points, biological vs. technical replicate hierarchy. |
Clearly labeled comparative cohorts for statistical contrast. |
Deliverables & Comprehensive Reporting Package
- Deconvoluted & Corrected MID Matrices: Fully corrected fractional labeling distributions (M+0 to M+n) with analytical standard deviations (.csv / Excel).
- Multivariate Quality Control Report: Publication-quality 2D/3D PCA score and loading plots, Hierarchical Clustering dendrograms/heatmaps, and Bi-plot visualizations.
- Quantified Flux Distribution Tables: Absolute net reaction rates (vnet) and exchange velocities (vxch) with 95% confidence intervals and split ratios.
- Statistical Fit & Identifiability Diagnostics: Sum of squared residuals (SSR), Chi-square test statistics, residual distribution plots, and profile likelihood curves.
- Constraint-Based FBA Simulation Results: Predicted genome-scale flux distributions, shadow prices, gene essentiality predictions, and yield optimization tables.
- Publication-Ready Vector Pathway Maps: High-resolution vector diagrams (PDF, SVG, EPS) illustrating metabolic network flux partitioning with flux-scaled arrow widths.
Research Applications of Fluxomics & In Silico Metabolic Modeling
- Bioprocess & Industrial Strain Engineering: Identify metabolic bottlenecks, eliminate overflow byproduct secretion (e.g. acetate/lactate), and maximize target product yield in bacterial, yeast, and CHO bioproduction platforms.
- Oncology & Tumor Metabolic Reprogramming: Map shifts between aerobic glycolysis (Warburg effect) and oxidative phosphorylation, quantify glutamine addiction, and discover novel metabolic vulnerabilities.
- Drug Target Discovery & Mechanism-of-Action (MoA): Quantify systemic pathway rewiring and identify downstream target inhibition in response to small-molecule enzyme inhibitors.
- Immunometabolism & Cellular Activation: Track dynamic nutrient partitioning, pentose phosphate pathway activation, and one-carbon donor utilization during immune cell differentiation and polarization.
- Multi-Omics Data Integration: Combine transcriptomic, proteomic, and metabolomic datasets with constraint-based genome-scale models to construct context-specific metabolic simulations.


 Contact Us



