Pentose Phosphate Pathway MFA — Resolving Oxidative & Non-Oxidative Fluxes
The pentose phosphate pathway (PPP) branches at glucose-6-phosphate into an oxidative branch that decarboxylates glucose-6-phosphate and a non-oxidative branch that returns pentose carbon to glycolysis. Concentrations of 6-phosphogluconate or sedoheptulose-7-phosphate do not indicate which branch is active, or in which direction it runs. Stable-isotope labeling separates the two branches, because each leaves a different mass isotopologue signature in the metabolites downstream.
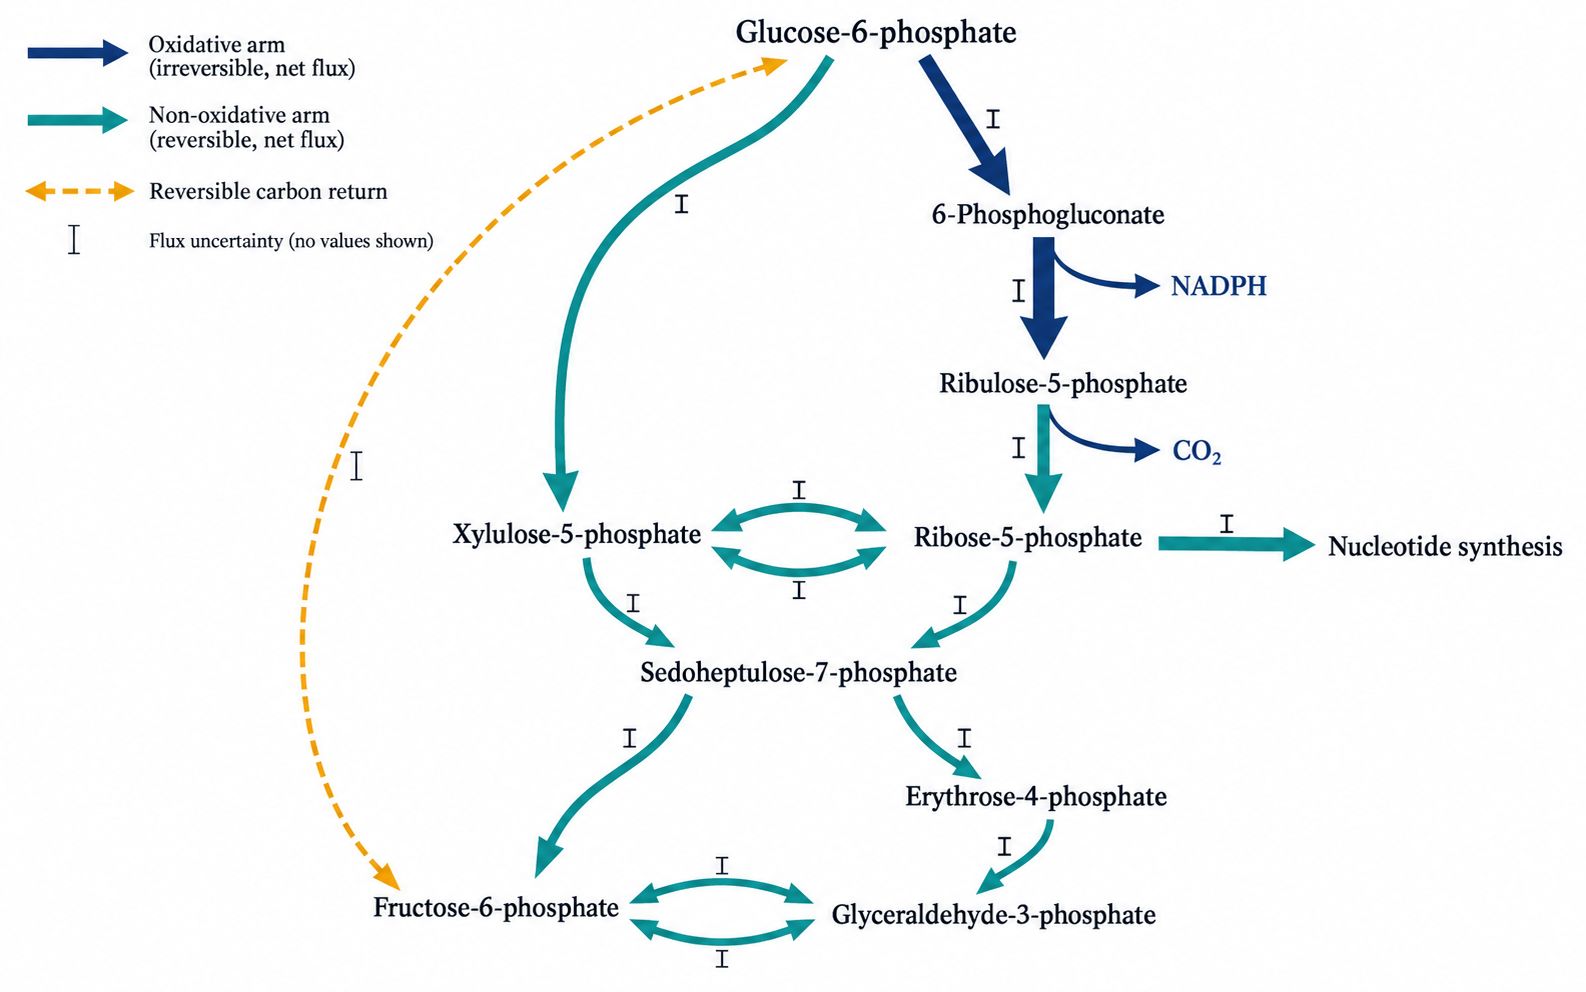
The two branches cannot be quantified independently. Transketolase and transaldolase return pentose carbon to fructose-6-phosphate and glyceraldehyde-3-phosphate, so the pentose phosphate pool is continuously exchanged with the glycolytic pathway metabolic flux analysis network, and both branches are fitted in one stoichiometric model rather than estimated separately. The same model is used for central carbon metabolic flux analysis and for the wider scope of the metabolic flux analysis service, which covers amino acid and one-carbon fluxes. Four quantities are reported:
(i) Oxidative Branch Flux: G6PDH and 6PGD net flux, including the decarboxylation step that releases carbon-1 as CO2 and the NADPH yield coupled to it, separated from isotopic exchange at the same reactions.
(ii) Non-Oxidative Branch Flux and Exchange: Ribose-5-phosphate isomerase, ribulose-5-phosphate epimerase, transketolase, and transaldolase reactions, reported as net flux through the branch and as reversible exchange that returns carbon to fructose-6-phosphate and glyceraldehyde-3-phosphate.
(iii) Branch Directionality Under NADPH Demand: Reversal of the non-oxidative branch when NADPH demand exceeds ribose demand, which redistributes pentose phosphates into glycolysis without a measurable change in pool size.
(iv) Precursor Supply to Biosynthesis: Ribose-5-phosphate supply for phosphoribosyl pyrophosphate and nucleotide synthesis, erythrose-4-phosphate supply for aromatic amino acid synthesis, and the sedoheptulose-7-phosphate pool turnover supporting both.
Metabolite concentrations: Where the study objective is absolute or relative quantification of sugar phosphates (μg/g or ng/mL) rather than reaction rates, the same samples are quantified by pentose phosphate pathway metabolism service.
Analytical Considerations in Pentose Phosphate Fluxomics
Pentose phosphate fluxomics is limited mainly by isomer separation, intermediate stability during extraction, target abundance, and reaction reversibility:
- Isomer Resolution of Pentose Phosphates: Ribose-5-phosphate, ribulose-5-phosphate, and xylulose-5-phosphate share the formula C5H11O8P (m/z 229.0119) and an identical isotopologue envelope, and each occupies a different position in the pathway. Ion-pairing and porous graphitic carbon conditions assign each isomer its own isotopologue distribution.
- Alkaline Quenching for Labile Intermediates: 6-Phosphogluconate, sedoheptulose-7-phosphate, and erythrose-4-phosphate degrade under acidic extraction. We use pre-cooled alkaline and organic quenching validated for each sample matrix rather than a single default protocol across cell, tissue, and microbial samples.
- Low-Abundance Targets and Fragment Constraints: Pentose phosphates sit at a small fraction of the glucose-6-phosphate pool, so acquisition combines sensitive isotope-resolved LC-MS/MS with silylation-based GC-MS, in which fragment ions constrain the position of the label rather than its mass alone.
- Reversible Reactions and Identifiability: Transketolase and transaldolase operate close to equilibrium, so a single tracer leaves net and exchange flux mathematically entangled. Parallel tracer regimes and joint fitting separate them, and we report a reversibility index instead of a single averaged rate.
13C Tracer Selection Matrix for Oxidative & Non-Oxidative PPP Flux
The tracer determines which branch is identifiable; the table lists the readouts the model fits:
| Tracer Substrate |
Target Pentose Phosphate Reaction |
Diagnostic MID Readout & Value |
| [1,2-13C2]Glucose |
Oxidative versus non-oxidative origin of pentose phosphates |
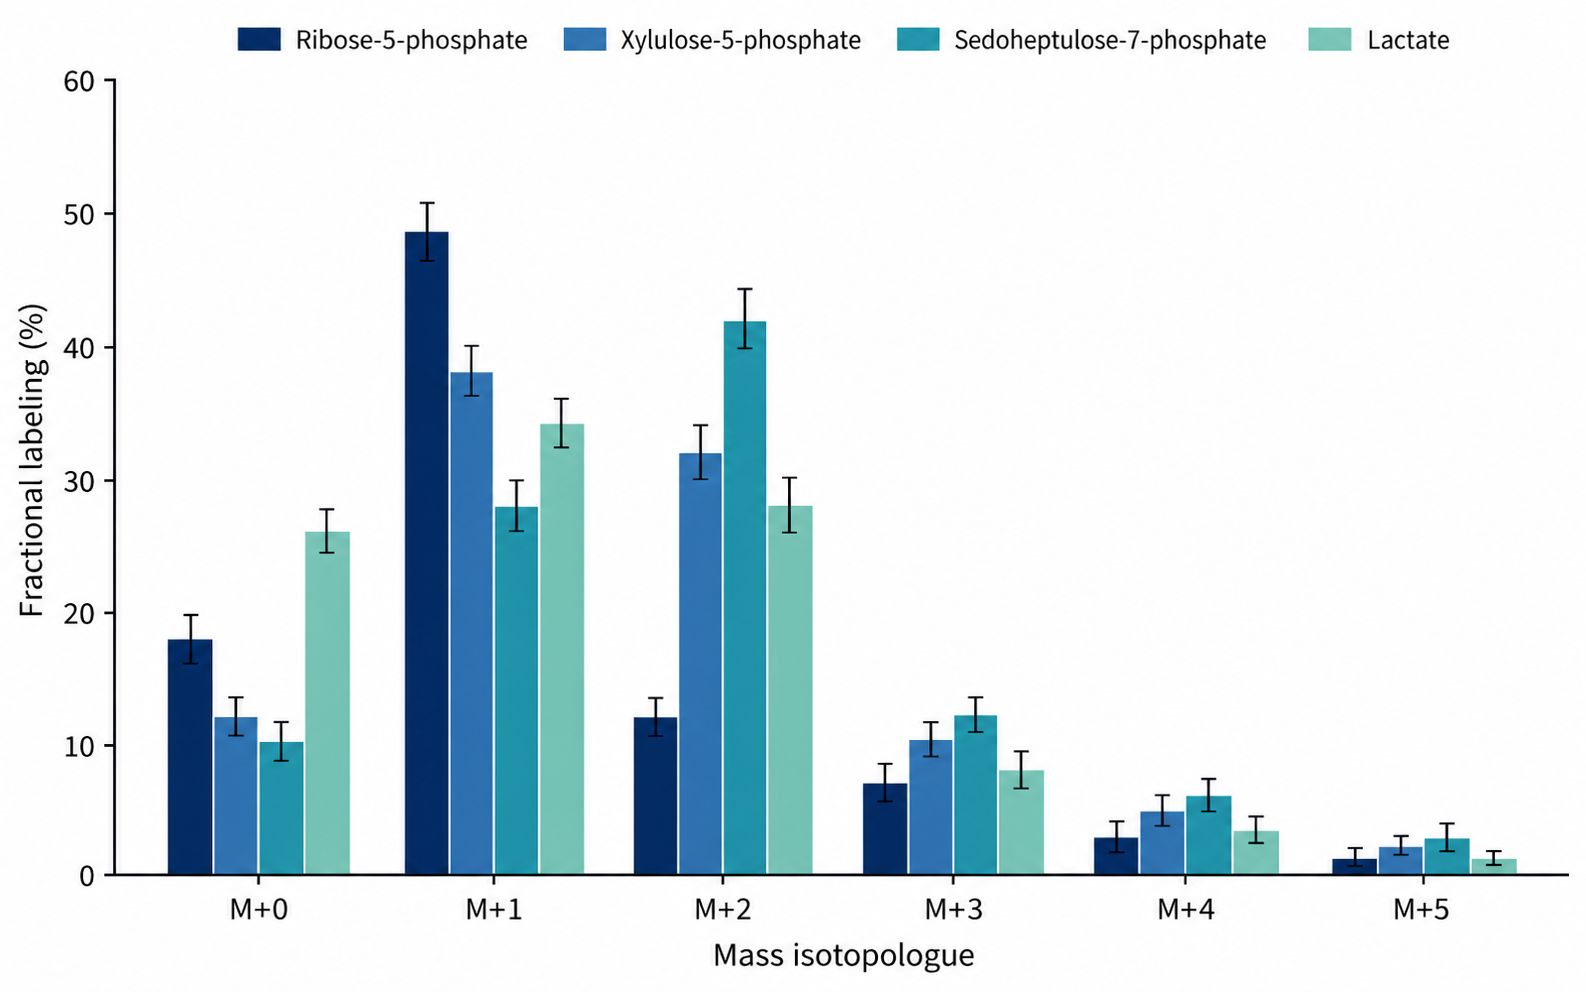
Oxidative decarboxylation of carbon-1 yields M+1 pentose phosphates and M+1 lactate/pyruvate, while transfer from M+2 fructose-6-phosphate by transketolase and transaldolase returns M+2 pentose phosphates. The M+1:M+2 ratio separates oxidative branch output from carbon recycled through the non-oxidative branch. |
| [1-13C]Glucose |
Net oxidative decarboxylation at G6PDH and 6PGD |
Carbon-1 leaves as 13CO2. Combining the 13CO2 evolution rate with M+1 6-phosphogluconate and ribulose-5-phosphate quantifies net oxidative flux, a rate the non-oxidative branch cannot produce. |
| [U-13C6]Glucose |
PPP carbon return to glycolysis and precursor supply |
The oxidative branch produces M+5 pentose phosphates, whereas recombination through transketolase and transaldolase produces M+2, M+3, and M+4 pentoses. Fitting these envelopes together with ribose-5-phosphate supply against phosphoribosyl pyrophosphate demand connects to nucleotide metabolic flux analysis. |
| Parallel position-specific + uniform tracers |
Net versus exchange flux through the reversible branch |
A single tracer cannot separate net non-oxidative flux from exchange at near-equilibrium reactions. Fitting two tracer regimes to the same network constrains both, and the exchange-to-net ratio is reported as the reversibility index. |
Technical Capabilities for Pentose Phosphate Flux Resolution
- Position-Specific Tracer Design: Tracer and sampling time are matched to the biological question through 13C metabolic flux analysis, so that carbon-1 and carbon-2 of glucose report different branches.
- Isotope-Resolved Separation: Ion-pairing and porous graphitic carbon LC-MS/MS resolve the pentose phosphate isomers, and GC-MS-based metabolic flux analysis supplies fragment-level positional constraints where they are needed.
- Carbon Dioxide Release Measurement: Parallel 13CO2 determination for studies where oxidative branch flux must be tied to the decarboxylation step itself.
- Dynamic and Non-Stationary Options: Sampling at early labeling times, using dynamic and INST metabolic flux analysis, for oxidative stress or inhibitor experiments where the flux distribution between the two branches shifts before isotopic steady state.
- Positional Cross-Validation: High-field NMR-based metabolic flux analysis where stereospecific carbon routing in the pentose pool requires an orthogonal physical measurement.
- Uncertainty Reporting: Every reported rate carries a confidence interval from goodness-of-fit and sensitivity analysis, so branch comparisons rest on differences the measurement can resolve.
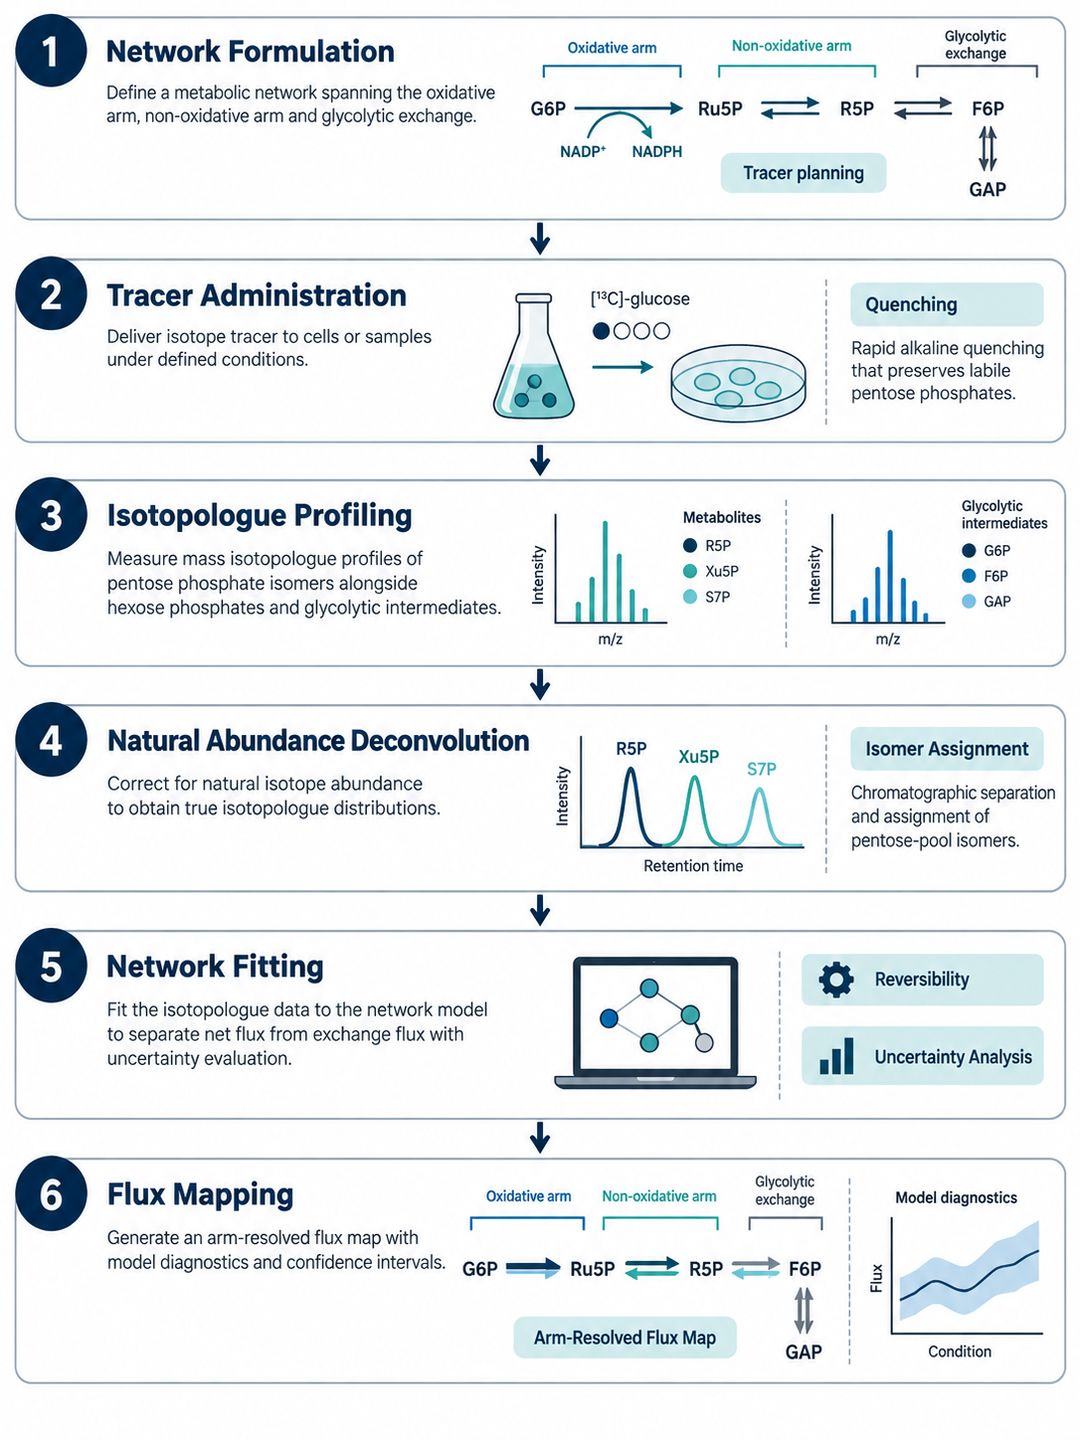
End-to-End Pentose Phosphate Pathway MFA Workflow
Sample Preparation & Quenching Guidelines for Pentose Phosphate MFA
Input amounts and quenching are finalized during feasibility review, because pentose phosphate intermediates tolerate acid extraction poorly:
| Sample Type |
Typical Input Guidelines |
Harvesting & Quenching Principles |
Storage & Transport |
| Adherent Cultured Cells |
Typically 1–5 × 10⁶ cells (60 mm dish), confirmed by pilot assessment |
Aspirate tracer medium rapidly, quench with pre-cooled alkaline or organic solvent, detach on dry ice/ice. Avoid aqueous washes that drain the pentose pool. |
Store at −80 °C; ship on dry ice |
| Suspension Cultured Cells |
Typically 2–10 × 106 cells, adjusted to cell density |
Short pre-cooled centrifugation or direct cold quenching, aspirate supernatant, extract the pellet immediately in cold alkaline solvent. |
Store at −80 °C; ship on dry ice |
| Microbial / Fermentation Pellets |
Biomass volume determined by pilot extraction and target coverage |
Fast filtration or direct quenching into pre-chilled solvent to arrest fast-turnover pentose pools, with spent broth retained for extracellular rates. |
Store at −80 °C; ship on dry ice |
| Plant & Animal Tissue Specimens |
20–50 mg wet weight, depending on metabolic activity |
Freeze-clamping or liquid nitrogen immersion immediately on excision, then cryogenic pulverization without intermediate thawing. |
Store at −80 °C; ship on dry ice |
| Conditioned Culture Medium |
≥ 200 μL matched supernatant |
Sample matched supernatant across labeling time points, clarify by centrifugation (4 °C), and pair with 13CO2 collection where oxidative flux is a target. |
Store at −80 °C; ship on dry ice |
| Extracellular CO2 Trap |
Headspace or alkali trap matched to labeling duration |
Collect the trap over a defined labeling interval so that carbon-1 decarboxylation is integrated rather than sampled at a single point. |
Seal immediately; ship at ambient in sealed vials |
Deliverables & Quantitative Reporting from Pentose Phosphate MFA
- Deconvoluted Pentose Phosphate MID Matrix: Natural-abundance-corrected fractional labeling (M+0 to M+n) for glucose-6-phosphate, fructose-6-phosphate, 6-phosphogluconate, ribulose-5-phosphate, ribose-5-phosphate, xylulose-5-phosphate, sedoheptulose-7-phosphate, and erythrose-4-phosphate, with linked glycolytic intermediates.
- Oxidative Branch Flux Estimates: Net G6PDH and 6PGD rates with confidence intervals, reconciled against measured 13CO2 evolution where that measurement was included.
- Non-Oxidative Branch Flux Estimates: Net and exchange flux for ribose-5-phosphate isomerase, ribulose-5-phosphate epimerase, transketolase, and transaldolase, reported with a reversibility index for the branch.
- Carbon Exchange With Glycolysis: Fractional return of pentose-derived carbon into fructose-6-phosphate and glyceraldehyde-3-phosphate, expressed as a share of glycolytic influx.
- Precursor Supply Estimates: Ribose-5-phosphate availability relative to phosphoribosyl pyrophosphate demand, and erythrose-4-phosphate supply for aromatic biosynthesis.
- Model Specifications and Fit Diagnostics: Reaction network definitions, carbon transition mappings, sum of squared residuals, Chi-square goodness-of-fit, and parameter sensitivity output.
- Publication-Ready Flux Maps: Vector graphics (PDF/SVG) of the two PPP branches with flux-scaled arrow widths and uncertainty annotations.
Research Applications of Pentose Phosphate Pathway Flux Analysis
- Oncology & Proliferative Metabolism: Measure how proliferating tumor cells divide PPP output between NADPH-generating oxidative flux and ribose-5-phosphate supply for nucleotide synthesis, and whether the flux distribution between the two branches shifts with oncogenic background.
- Oxidative Stress & Ferroptosis Research: Quantify oxidative branch flux as the NADPH source supporting glutathione and thioredoxin recycling, and track how the non-oxidative branch compensates when oxidative flux is limiting.
- Immunometabolism: Characterize PPP flux in activated T cells and macrophages, where ribose-5-phosphate demand and NADPH demand rise together but not always in the same branch.
- Metabolic Engineering & Strain Design: Determine how carbon is redistributed between glycolysis and the PPP in microbial and plant systems engineered for NADPH-dependent biosynthesis, using flux data to guide pathway or cofactor engineering.
- Redox-Linked Network Modeling: Combine branch-specific PPP flux with NADPH metabolic flux analysis where the study question concerns how reductant production and consumption balance across compartments.


 Contact Us



