Why Mitochondrial Metabolomics Matters for Drug Toxicity and Metabolic Disease
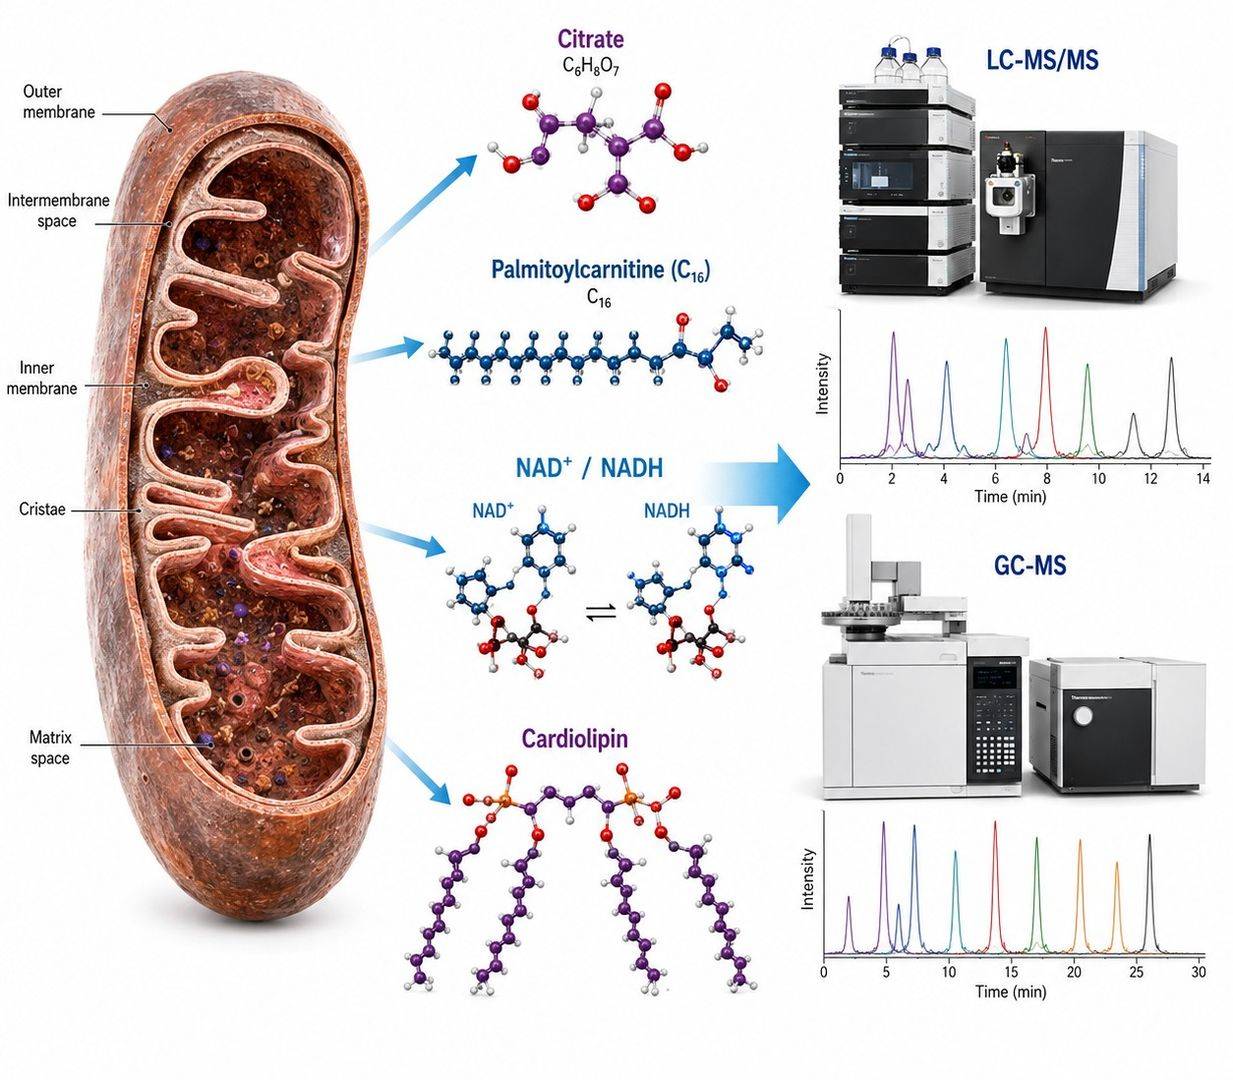
Mitochondria house the TCA cycle, oxidative phosphorylation (OXPHOS), and fatty acid beta-oxidation. When drugs, toxins, or genetic mutations disrupt these processes, metabolic changes appear first at the organelle level — often before whole-cell or biofluid metabolomics shows detectable shifts. However, whole-cell metabolomics dilutes mitochondrial-specific signals below detection limits, because mitochondria occupy only 10 to 25 percent of cell volume. Our service combines mitochondrial isolation with targeted LC-MS/MS, untargeted LC-HRMS, and GC-MS profiling to deliver organelle-resolved metabolic data for drug toxicity assessment, metabolic disease research, and cancer metabolism studies.
Targeted mitochondrial metabolomics by LC-MS/MS and GC-MS enables you to:
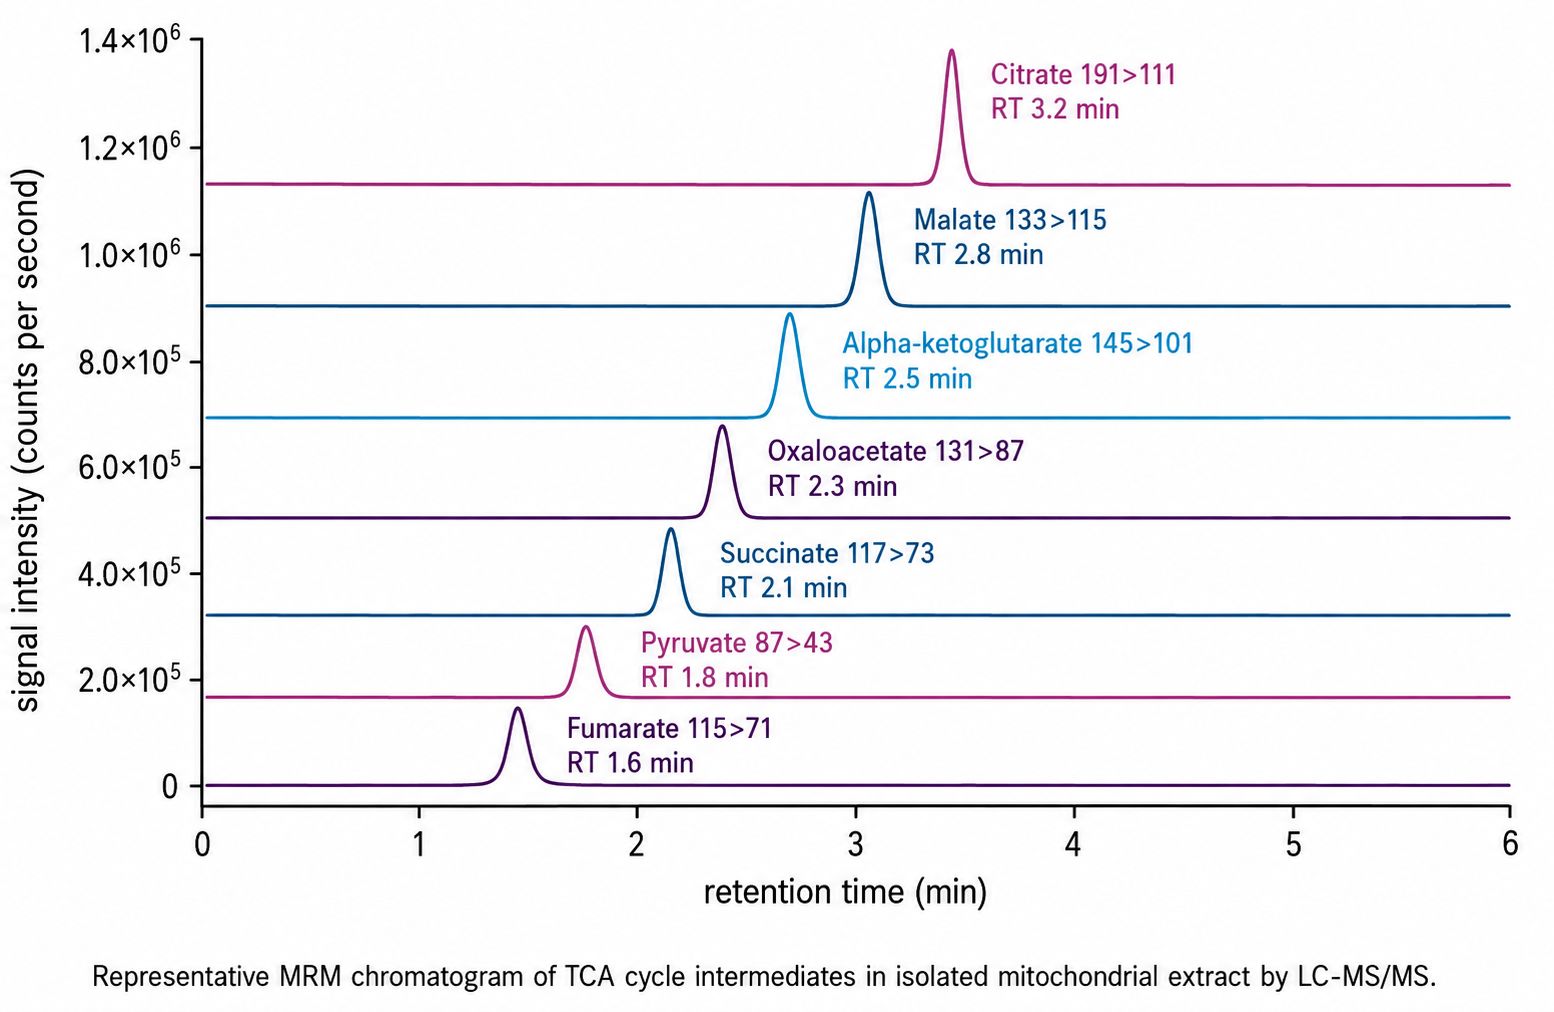
- Quantify TCA cycle intermediates — citrate, isocitrate, alpha-ketoglutarate, succinate, fumarate, malate, and oxaloacetate — as individual metabolites, not a summed pool, to identify enzymatic bottleneck points
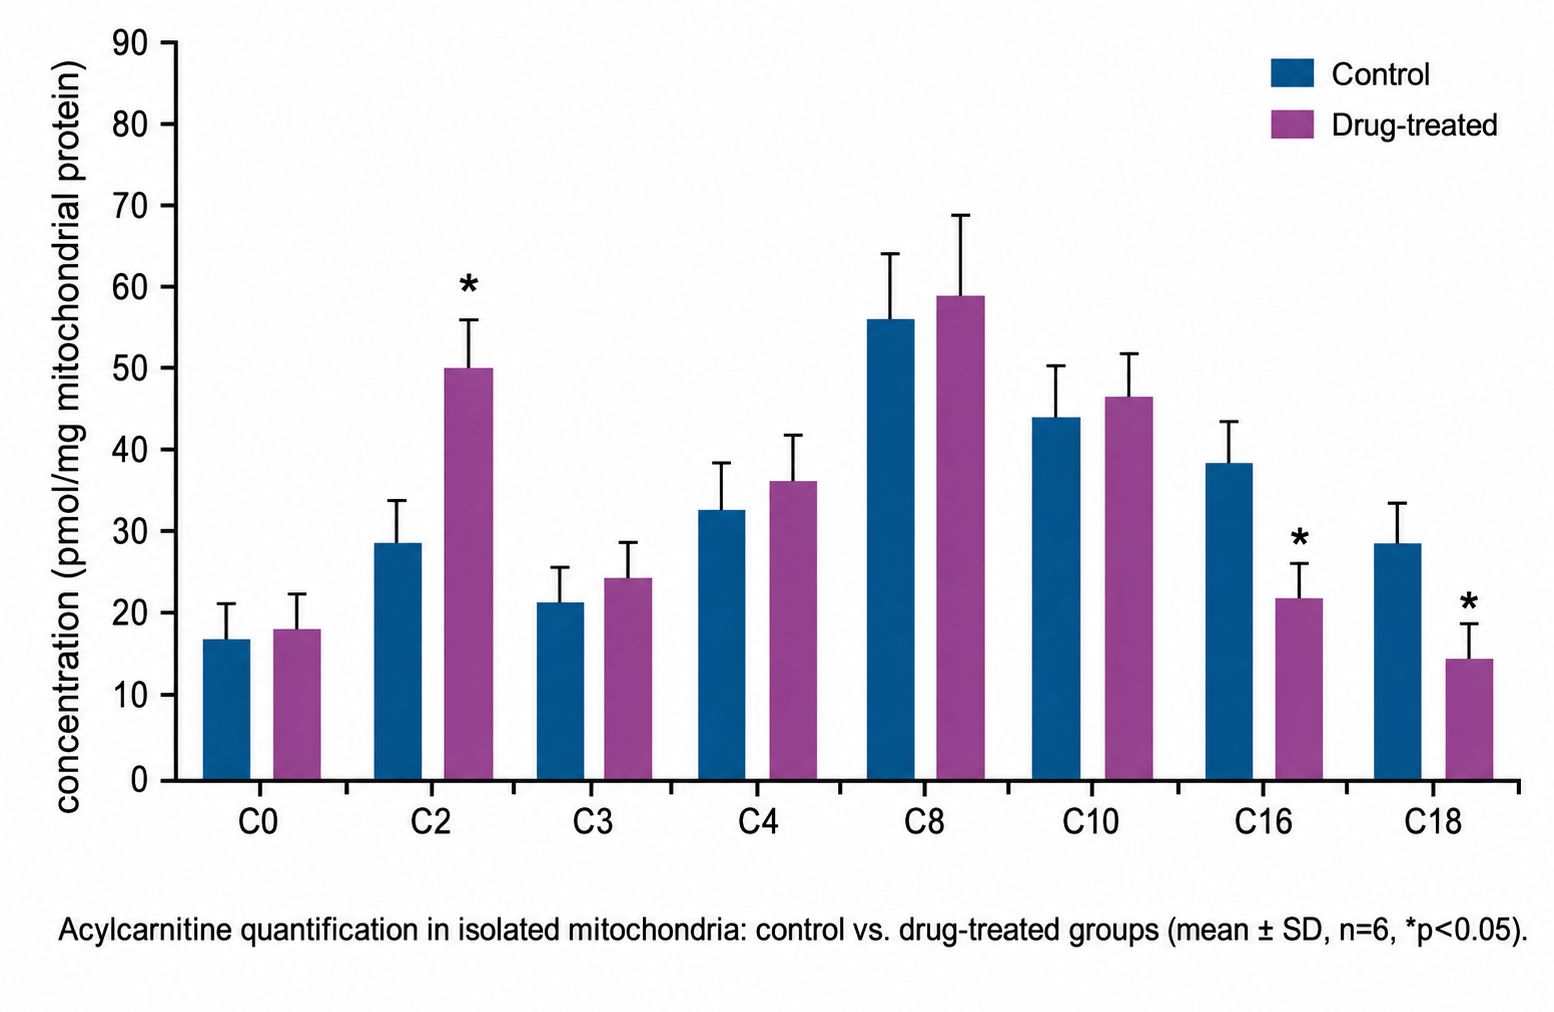
- Profile acylcarnitines — from acetylcarnitine (C2) to palmitoylcarnitine (C16) and stearoylcarnitine (C18) — as direct readouts of CPT1/CPT2 activity and mitochondrial fatty acid oxidation flux
- Measure redox metabolites — NAD+, NADH, NADP+, NADPH, FAD, and reduced glutathione — to assess electron transport chain function and oxidative stress at the metabolite level
- Detect drug-induced mitochondrial toxicity — citrate accumulation, acylcarnitine depletion, and NAD+/NADH ratio shifts are early biomarkers of complex I inhibition, beta-oxidation blockade, and OXPHOS uncoupling
Mitochondrial Metabolomics Challenges — Organelle Resolution vs Whole-Cell Averaging
Most metabolomics services profile whole-cell or whole-tissue extracts — which averages mitochondrial signals with the far more abundant cytoplasmic pool. If a drug inhibits complex I and acylcarnitines accumulate inside mitochondria, this signal is diluted below significance in a whole-cell extract, making acylcarnitine profiling unreliable without mitochondrial isolation. Creative Proteomics resolves this with a mitochondrial isolation-first approach combined with targeted LC-MS/MS panels:
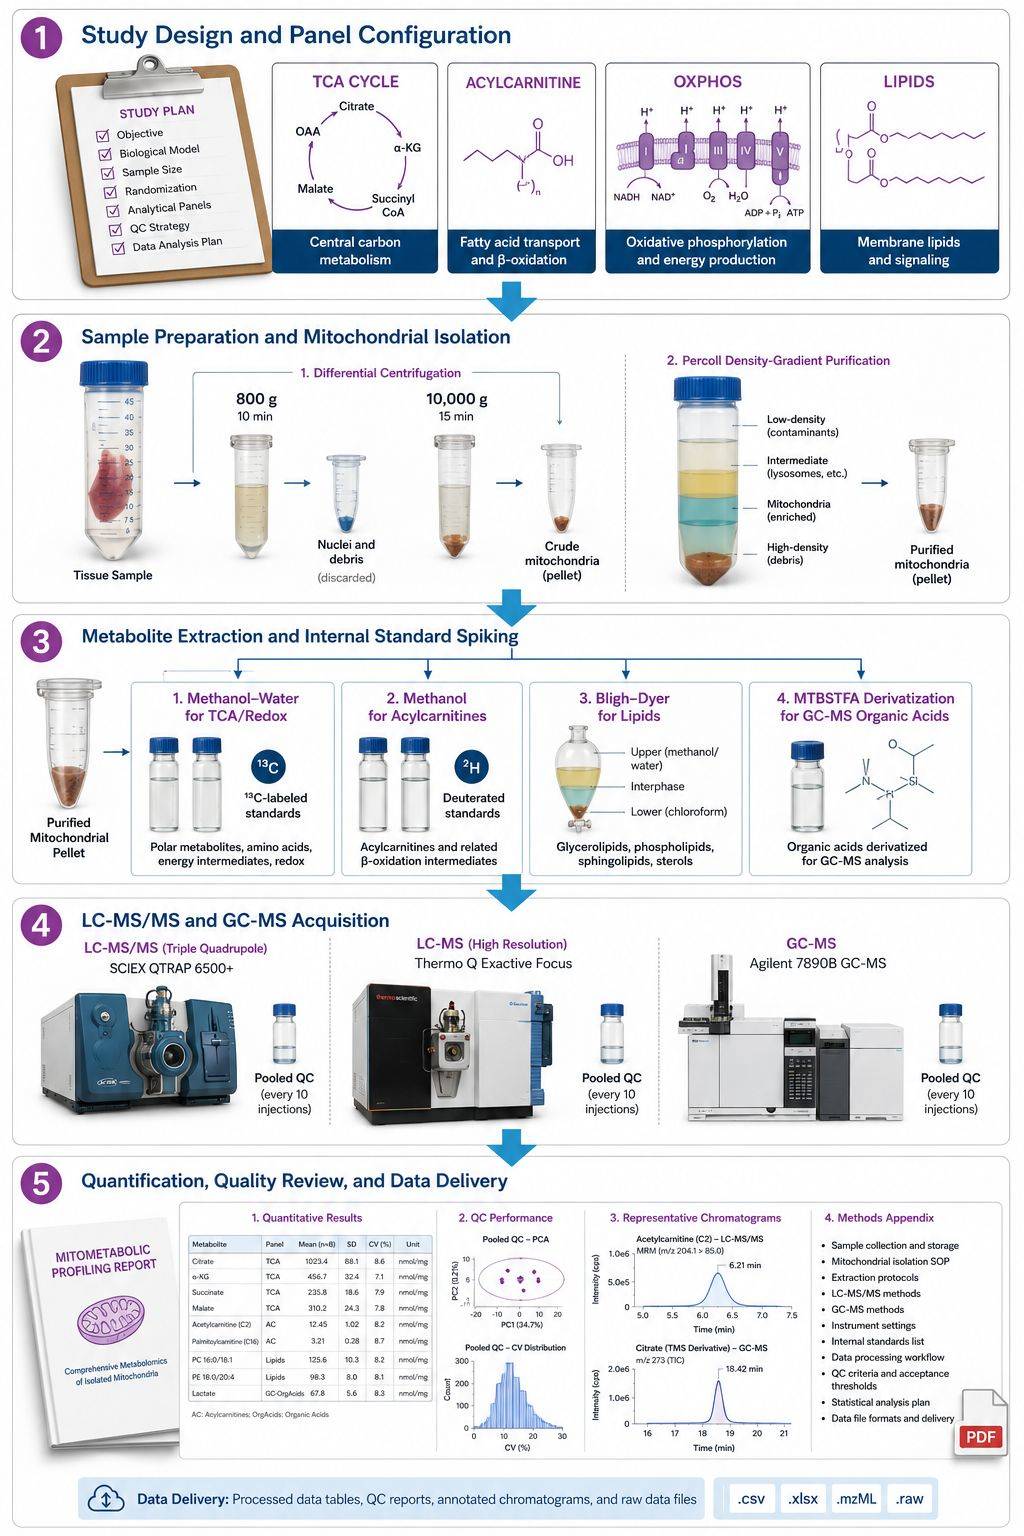
- Organelle-resolved, not whole-cell averaged: We isolate mitochondria from tissue or cells using differential centrifugation with density gradient purification, then extract metabolites directly from the mitochondrial pellet. This enriches mitochondrial-specific metabolites 5 to 20 fold compared to whole-cell extracts, depending on the analyte.
- Four complementary panels from one isolation: Your mitochondrial sample is split into four targeted LC-MS/MS and GC-MS panels — TCA cycle, acylcarnitine/carnitine, OXPHOS and redox, and mitochondrial lipids — providing comprehensive organelle-level coverage without duplicate sample submissions.
- Drug toxicity biomarker focus: Our panels are designed around the metabolite shifts most commonly reported in drug-induced mitochondrial toxicity studies — citrate accumulation (TCA cycle bottleneck), acylcarnitine depletion (CPT1 inhibition), NAD+/NADH ratio collapse (complex I inhibition), and cardiolipin remodeling (membrane damage).
Mitochondrial Metabolite Detection Panels
Our mitochondrial metabolomics service offers four complementary panels — deployable independently or together from a single mitochondrial isolation. Each panel includes class-specific isotopically labeled internal standards and per-analyte multi-point calibration for TCA cycle metabolite analysis, acylcarnitine profiling, OXPHOS metabolite quantification, and mitochondrial lipid characterization.
Panel 1: TCA Cycle Intermediates (LC-MS/MS)
| Metabolite |
Pathway Position |
Biological Context |
| Pyruvate |
Glycolysis to TCA entry point |
Pyruvate dehydrogenase (PDH) substrate; accumulates when PDH is inhibited |
| Citrate |
TCA entry; condensation product |
Accumulates when isocitrate dehydrogenase or aconitase is inhibited; exported for lipogenesis |
| Isocitrate |
TCA; citrate isomer |
Substrate of isocitrate dehydrogenase (IDH); mutated in gliomas and AML |
| Alpha-ketoglutarate |
TCA; oxidative decarboxylation |
IDH product; glutaminolysis anaplerotic input; cofactor for dioxygenases |
| Succinate |
TCA; SDH (Complex II) substrate |
Accumulates when complex II is inhibited; oncometabolite in SDH-deficient tumors |
| Fumarate |
TCA; hydration product |
Accumulates in fumarate hydratase-deficient tumors; epigenetic modifier |
| Malate |
TCA; pre-oxaloacetate |
Malate-aspartate shuttle; gluconeogenic substrate |
| Oxaloacetate |
TCA; condensation partner |
Condenses with acetyl-CoA to form citrate; rapidly decarboxylated, requires specialized extraction |
| Acetyl-CoA |
TCA fuel; PDH and beta-oxidation product |
Primary carbon entry into TCA; depleted when PDH or beta-oxidation is inhibited |
Panel 2: Acylcarnitine and Carnitine Profile (LC-MS/MS)
| Acylcarnitine |
Chain Length |
FAO Pathway Position |
Toxicological Significance |
| Free carnitine (C0) |
Free base |
Carnitine shuttle substrate |
Depleted when dietary carnitine deficiency or OCTN2 transporter defect; C0/acetylcarnitine ratio indicates FAO flux |
| Acetylcarnitine (C2) |
Short-chain |
Acetyl-CoA export product |
Elevated in TCA cycle bottleneck (citrate accumulation); primary product of acetyl-CoA carboxylase feedback |
| Propionylcarnitine (C3) |
Short-chain |
Odd-chain FAO product |
Elevated in propionic acidemia and BCAA catabolism defects; gut microbiome marker |
| Butyrylcarnitine (C4) |
Short-chain |
Even-chain FAO product |
Elevated in short-chain acyl-CoA dehydrogenase (SCAD) deficiency |
| Octanoylcarnitine (C8) |
Medium-chain |
MCAD substrate |
Diagnostic marker for medium-chain acyl-CoA dehydrogenase (MCAD) deficiency; drug-induced medium-chain FAO inhibition |
| Decanoylcarnitine (C10) |
Medium-chain |
MCAD product |
Accumulates when MCAD is inhibited; valproic acid toxicity marker |
| Palmitoylcarnitine (C16) |
Long-chain |
CPT1 substrate |
Accumulates when CPT2 is inhibited; depleted when CPT1 is blocked by malonyl-CoA (drug-induced) |
| Stearoylcarnitine (C18) |
Long-chain |
CPT1 substrate |
Long-chain FAO marker; ratio C16/C18 indicates enzyme specificity shifts |
Custom panels: add specific acylcarnitine species (e.g., C5-OH, C3-DC, C4-DC, C5-DC, C12-DC, C14-DC, C16-OH, C18-OH), integrate with fatty acid metabolism profiling, or combine with metabolic flux analysis using 13C-labeled substrates. Contact us with your target list during study design.
Panel 3: OXPHOS and Redox Metabolites (LC-MS/MS)
| Metabolite |
Role in OXPHOS |
Disease and Toxicity Relevance |
| NAD+ and NADH |
Electron carrier for Complex I |
NAD+/NADH ratio collapses in Complex I inhibition (rotenone, metformin); aging biomarker |
| NADP+ and NADPH |
Reductive biosynthesis and antioxidant defense |
NADPH depletion impairs glutathione recycling; oxidative stress marker |
| FAD and FADH2 |
Electron carrier for Complex II (SDH) |
FADH2 accumulates when Complex II is inhibited; succinate dehydrogenase deficiency |
| CoQ10 (ubiquinone/ubiquinol) |
Electron shuttle between Complex I/II and Complex III |
Depleted by statins (HMG-CoA reductase inhibitors); redox status indicates ETC function |
| Glutathione (GSH/GSSG) |
Mitochondrial antioxidant defense |
GSH/GSSG ratio indicates mitochondrial oxidative stress; depleted in acetaminophen toxicity |
| ATP, ADP, AMP |
Energy charge and adenylate kinase flux |
ATP/ADP ratio collapses in OXPHOS uncoupling; AMPK activation signal |
Panel 4: Mitochondrial Lipid Signaling (LC-MS/MS)
| Lipid Class |
Representative Species |
Mitochondrial Role |
| Cardiolipins |
TMCL, MLCL (C18:2-rich) |
Inner membrane structural lipid; required for Complex IV and ATP synthase assembly; remodeled in apoptosis and Barth syndrome |
| Monolysocardiolipins |
MLCL (C18:2) |
Cardiolipin remodeling intermediate; accumulates in Barth syndrome (TAZ deficiency) |
| Phosphatidylglycerol |
PG (C18:0, C18:1) |
Cardiolipin biosynthetic precursor; marker of mitochondrial membrane biogenesis |
| Lyso-phospholipids |
LPC, LPE, LPA |
Membrane damage markers; accumulate when phospholipase A2 is activated during mitochondrial dysfunction |
Targeted vs Untargeted Mitochondrial Profiling — Which Approach Fits Your Study?
Researchers have two primary approaches for mitochondrial metabolomics — but they answer different questions. The table below clarifies which approach fits your research goal.
| Dimension |
Targeted Panels (LC-MS/MS MRM) |
Untargeted Discovery (LC-HRMS) |
| What is measured |
Pre-defined panel of 40 to 60 mitochondrial metabolites with confirmed identities |
Unbiased detection of all detectable features in mitochondrial extracts, including unknowns |
| Quantification |
Absolute (nmol/mg protein, pmol per million cells) with isotopically labeled internal standards and per-analyte calibration curves |
Relative (fold change, normalized intensity); absolute quantification requires follow-up targeted validation |
| Sensitivity |
Higher for targeted analytes (scheduled MRM, optimized transitions); LOD 0.01 to 1 pmol on-column |
Lower for individual analytes (full-scan HRMS splits dwell time across all masses); better for discovering unexpected metabolites |
| Annotation confidence |
Confirmed — retention time and MRM transitions matched to authentic standards |
Level 2 to 4 — mass and isotope matching, library search; requires validation |
| Biological question answered |
"Is this drug inhibiting Complex I or CPT1?" — mechanism, pathway-specific, biomarker quantification |
"What mitochondrial metabolites change in this disease model?" — discovery, hypothesis generation |
| Best for |
Drug toxicity screening, biomarker validation, pathway mechanistic studies, clinical translation |
Early-stage discovery, novel pathway identification, untargeted metabolomics hypothesis generation |
Not sure which approach fits your study? Most drug toxicity projects benefit from the targeted panels first (mechanism, biomarkers) followed by untargeted discovery to identify unexpected metabolic perturbations. Contact us during study design and we will recommend the optimal configuration for your sample type and research question.
Why Choose Our Mitochondrial Metabolomics Service?
- Mitochondrial Isolation, Not Whole-Cell Averaging
We isolate mitochondria from your tissue or cell samples using differential centrifugation with density gradient purification before metabolite extraction. This enriches mitochondrial-specific metabolites 5 to 20 fold compared to whole-cell extracts, providing organelle-level resolution that whole-cell metabolomics cannot achieve.
- Four Complementary Panels from One Isolation
Your mitochondrial sample is split into four LC-MS/MS and GC-MS panels — TCA cycle, acylcarnitine/carnitine, OXPHOS and redox, and mitochondrial lipids. Comprehensive organelle-level coverage without duplicate sample submissions.
- Drug Toxicity Biomarker Focus
Our panels are designed around the metabolite shifts most commonly reported in drug-induced mitochondrial toxicity: citrate accumulation (TCA bottleneck), acylcarnitine depletion (CPT1 inhibition by malonyl-CoA), NAD+/NADH ratio collapse (Complex I inhibition), and cardiolipin remodeling (membrane damage). Every analyte maps to a specific mechanistic readout.
- Per-Analyte Calibration with Isotopically Labeled Standards
Every analyte is quantified against its own multi-point calibration curve with class-matched isotopically labeled internal standards. Your citrate data is calibrated against a citrate standard curve — not estimated from a surrogate. Acylcarnitines are quantified with deuterated C2, C3, C8, and C16 internal standards.
- Professional Deliverables for Collaborators and Reviewers
Quantitative tables with per-analyte concentrations and QC flags, calibration and QC reports, extracted ion chromatograms with peak assignments, raw data files, and a methods appendix formatted for direct inclusion in your manuscript.
Mitochondrial Metabolomics Instrumentation and LC-MS/MS Method Performance
Our mitochondrial metabolomics platform integrates LC-MS/MS for polar metabolites — TCA cycle intermediates, acylcarnitines, OXPHOS metabolites, and redox cofactors — with GC-MS for organic acids and fatty acid derivatives. All instruments are configured for high-sensitivity quantification from low microgram mitochondrial protein inputs.
Analytical Platform
LC-MS/MS (Polar Metabolites — TCA, Acylcarnitines, Redox)
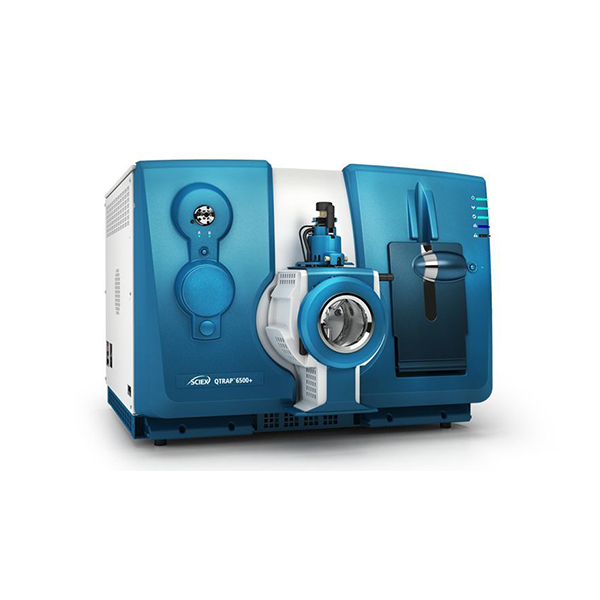
Mass Spectrometer: SCIEX QTRAP 6500+ triple quadrupole with scheduled MRM
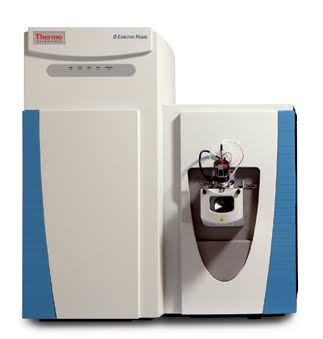
High-Resolution MS: Thermo Q Exactive Focus Orbitrap for untargeted discovery
LC System: Waters ACQUITY UPLC I-Class with HILIC and reversed-phase columns
Ionization: ESI positive and negative mode with polarity switching
GC-MS (Organic Acids and Fatty Acid Derivatives)
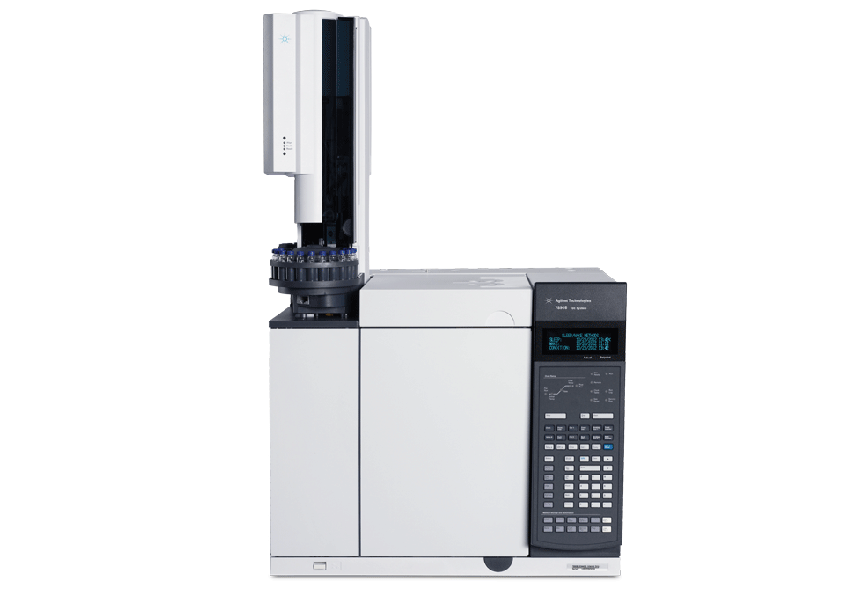
Mass Spectrometer: Agilent 7890B GC coupled to 5977A MSD
Column: DB-5MS (30 m x 0.25 mm x 0.25 micrometers) for organic acid profiling
Derivatization: MTBSTFA for organic acids; BF3/MeOH for fatty acid methyl esters
Method Performance
| Parameter |
Typical Range |
| Linearity (R squared) |
Greater than or equal to 0.992 (LC-MS/MS); greater than or equal to 0.995 (GC-MS) |
| LOD (LC-MS/MS) |
0.01 to 1 pmol on-column (analyte-dependent) |
| LOD (GC-MS) |
0.1 to 5 ng on-column (analyte-dependent) |
| Intraday Precision |
CV less than or equal to 10% for the majority of analytes |
| Interday Precision |
CV less than or equal to 15% across qualified matrices |
| Recovery (Spike) |
80 to 120% for most analytes in qualified matrices |
Internal Standards and Calibration Strategy
- TCA cycle panel: 13C6-citrate, 13C4-succinate, 13C4-fumarate, 13C4-malate, and D5-alpha-ketoglutarate as isotopically labeled internal standards spiked at extraction; 6 to 8 point calibration curves per analyte in surrogate matrix.
- Acylcarnitine panel: D3-acetylcarnitine (C2), D3-propionylcarnitine (C3), D3-octanoylcarnitine (C8), D3-palmitoylcarnitine (C16), and D3-carnitine (C0) as deuterated internal standards spiked at extraction; per-analyte calibration in methanol-water matrix.
- OXPHOS and redox panel: 13C5-NAD+, 13C5-NADH, 13C5-ATP, and 13C5-ADP as isotopically labeled internal standards; NAD+/NADH ratio reported per sample with method-specific extraction to minimize interconversion.
- QC Monitoring: Pooled QC every 8 injections; mitochondrial purity marker (citrate synthase activity) reported per isolation batch; Westgard multi-rule evaluation; LOESS signal drift correction; flagged analytes (RSD greater than 30%) reported.
Mitochondrial Metabolomics Workflow — From Isolation to Quantification
Mitochondrial Metabolomics Sample Collection and Isolation Guidelines
Proper sample handling is critical for mitochondrial metabolomics — mitochondrial metabolites are labile and mitochondrial membrane potential must be preserved during isolation. The following guidelines ensure metabolic integrity from collection through analysis.
| Sample Type |
Minimum Amount |
Preparation |
Storage and Shipping |
| Tissue (liver, heart, brain, muscle) |
Greater than or equal to 100 mg wet weight |
Snap-freeze in liquid N2 immediately after collection. For mitochondrial isolation, fresh tissue is preferred — flash-frozen tissue can be used but may yield lower intact mitochondria. Record wet weight before freezing |
Fresh on wet ice (within 2 h); or -80 degrees C; ship on dry ice |
| Cultured Cells |
Greater than or equal to 5 x 10 to the 7th cells (50 mg pellet) |
Wash twice with cold PBS; harvest by trypsinization or scraping. For mitochondrial isolation, collect live cells in cold isolation buffer. Snap-freeze a parallel aliquot for whole-cell comparison |
Fresh on wet ice (within 1 h); or -80 degrees C; ship on dry ice |
| Isolated Mitochondria (customer-prepared) |
Greater than or equal to 200 micrograms mitochondrial protein |
If you prefer to isolate mitochondria yourself, follow our protocol guide (provided upon request). Include cytosolic fraction for comparison. Purity must be confirmed by citrate synthase activity and marker protein Western blot |
-80 degrees C; ship on dry ice |
| Plasma / Serum (acylcarnitine panel only) |
Greater than or equal to 100 microliters |
Collect in EDTA tube, centrifuge at 4 degrees C within 30 min, aliquot. Acylcarnitines are stable but avoid hemolysis. Fasting samples recommended for acylcarnitine profiling |
-80 degrees C; ship on dry ice |
| Whole-Cell or Tissue Extract (comparator) |
Greater than or equal to 30 mg tissue or 1 x 10 to the 7th cells |
Parallel sample for whole-cell metabolomics comparison. Snap-freeze at collection. Useful for calculating mitochondrial enrichment factor for each analyte |
-80 degrees C; ship on dry ice |
Critical Notes:
- Oxaloacetate and pyruvate are extremely labile — oxaloacetate spontaneously decarboxylates to pyruvate at physiological pH. Samples must be quenched and extracted at low temperature (4 degrees C or below) with acidic conditions to preserve oxaloacetate. If oxaloacetate is critical to your study, discuss specialized quenching protocols during study design.
- NAD+ and NADH interconvert rapidly — acid-base extraction methods are required to separate NAD+ (acid-stable) from NADH (base-stable). We use a dual-extraction approach: acid extraction for NAD+ and base extraction for NADH from parallel aliquots. Do not freeze-thaw samples before NAD extraction.
- Acylcarnitines in plasma reflect whole-body mitochondrial FAO status — for tissue-specific drug toxicity studies, mitochondrial isolation from the target organ is strongly recommended. Energy metabolism profiling from plasma alone may miss organ-specific dysfunction.
- Mitochondrial purity matters — cytosolic contamination (lactate dehydrogenase activity greater than 5 percent of total) dilutes mitochondrial-specific signals. We report purity metrics for every isolation batch and flag samples below threshold.
Mitochondrial Metabolomics Data Deliverables and Reporting
Our mitochondrial metabolomics deliverables are designed for direct integration into drug toxicity studies, manuscript preparation, and regulatory submissions. Every data package includes per-analyte absolute quantification, QC documentation, and raw data files for independent verification.
Quantitative Data Tables (.xlsx/.csv)
Absolute concentrations (nmol/mg mitochondrial protein, pmol per million cells, or nmol/mL for biofluids), per-analyte values for all four panels, QC flags, and calculated ratios — NAD+/NADH, ATP/ADP, acylcarnitine/free carnitine, and short-chain/long-chain acylcarnitine ratio.
QA/QC Report
Calibration linearity, internal standard recovery, pooled QC RSD, batch trend plots, Westgard rule compliance summary, mitochondrial purity metrics (citrate synthase activity, marker protein Western blot densitometry).
Chromatograms with Peak Assignments
Annotated MRM chromatograms (LC-MS/MS) showing peak identification for TCA intermediates and acylcarnitines. GC-MS chromatograms for organic acids with NIST library confirmation.
Raw Data Files
Vendor-native files (.wiff for SCIEX, .raw for Thermo, .d for Agilent) and open formats (.mzML, .csv) upon request.
Methods Appendix
Mitochondrial isolation protocol, extraction conditions, LC and GC parameters, MRM transitions, internal standard list — formatted for direct inclusion in your manuscript methods section.
Applications of Mitochondrial Metabolomics
Our mitochondrial metabolomics service supports researchers across disciplines where organelle-level metabolic data drives decisions:
- Drug-Induced Mitochondrial Toxicity — Screen compounds for Complex I to V inhibition, CPT1 blockade, and OXPHOS uncoupling using TCA cycle, acylcarnitine, and redox metabolite shifts as mechanistic biomarkers
- Metabolic Disease Research — Profile mitochondrial dysfunction in diabetes, NAFLD, obesity, and inborn errors of metabolism using TCA intermediate quantification and acylcarnitine panels
- Cancer Metabolism — Quantify oncometabolites (succinate, fumarate, 2-hydroxyglutarate), assess TCA cycle rewiring, OXPHOS metabolite shifts, and mitochondrial lipid remodeling in tumor samples
- Neurodegeneration and Aging — Measure NAD+/NADH decline, CoQ10 depletion, and cardiolipin remodeling in brain tissue mitochondria for Alzheimer, Parkinson, and aging studies
- Clinical Biomarker Discovery — Validate plasma acylcarnitine panels as non-invasive biomarkers of mitochondrial FAO disorders and drug toxicity in cohort-scale studies
Case Study: Volatile Anesthetic-Induced Mitochondrial TCA Cycle Disruption in Neonatal Mice
Mechanisms underlying neonate-specific metabolic effects of volatile anesthetics
Stokes, J., Freed, A., Bornstein, R., Su, K. N., Snell, J., Pan, A., Sun, G. X., Park, K. Y., Jung, S., Worstman, H., Johnson, B. M., Morgan, P. G., Sedensky, M. M., and Johnson, S. C. | eLife, 2021, 10, e65400
DOI: 10.7554/eLife.65400
Background
Volatile anesthetics (isoflurane, sevoflurane, halothane) are known to interfere with mitochondrial electron transport chain function, but the specific metabolic consequences — particularly in neonates — were poorly understood. Neonatal mice exposed to isoflurane experience acute depletion of beta-hydroxybutyrate (beta-HB), the primary ketone body fueling the neonatal brain, but the mechanism was unknown.
Challenge: Identify the mitochondrial metabolic pathway by which volatile anesthetics disrupt ketone body production in neonatal mice, using targeted metabolomics of TCA cycle intermediates and acylcarnitines to pinpoint the enzymatic bottleneck.
Key Findings
| Metric | Finding |
| Blood beta-HB (P7 neonates, baseline) | Approximately 2 mM |
| Blood beta-HB (P7, 30 min isoflurane) | Dropped to approximately 1 mM; effect half-life less than 12 minutes |
| P30 (adolescent) mice beta-HB response | Unaffected by isoflurane at any dose tested — unlike neonates, insensitive to malonyl-CoA |
| Liver citrate (30 min isoflurane) | Increased 100 percent compared to control |
| Malonyl-CoA response | Significantly increased; inhibits CPT1 and blocks fatty acid oxidation |
| Plasma and liver acylcarnitines | Broadly reduced, confirming CPT1 blockade and impaired fatty acid oxidation |
| Sub-anesthetic dose (0.2 percent isoflurane) | Caused equal or greater beta-HB depletion than 1.5 percent |
| ACC inhibitor ND-646 rescue | Partially prevented beta-HB decline, confirming citrate to ACC to malonyl-CoA to CPT1 axis |
What This Means for Your Drug Toxicity Research
- Citrate accumulation is an early biomarker of TCA cycle disruption. The 100 percent increase in liver citrate within 30 minutes of anesthetic exposure occurred before any clinical phenotype was visible. Our TCA cycle panel detects this shift at the organelle level — in isolated mitochondria — with absolute quantification.
- Acylcarnitine depletion confirms CPT1 inhibition without enzyme assays. The broadly reduced acylcarnitine profile directly demonstrates that fatty acid oxidation was blocked at the CPT1 step. Our acylcarnitine panel provides this readout from a single mitochondrial extraction.
- The TCA cycle to ACC to malonyl-CoA to CPT1 axis is a single connected pathway. Drug-induced mitochondrial toxicity often cascades through multiple metabolite classes simultaneously. Our four-panel approach captures all shifts in one isolation — citrate (TCA panel), acylcarnitines (acylcarnitine panel), and NAD+/NADH (redox panel) — providing a comprehensive mechanistic profile of mitochondrial dysfunction.
- Sub-anesthetic doses can cause maximum metabolic disruption. The 0.2 percent isoflurane dose — below the minimum on a clinical vaporizer — caused equal or greater beta-HB depletion than the full anesthetic dose. This means mitochondrial metabolomics can detect toxicity at doses that do not produce visible phenotypic effects.
Conclusion
This study demonstrates that targeted mitochondrial metabolomics — profiling TCA cycle intermediates and acylcarnitines from tissue samples — can identify the exact enzymatic bottleneck in drug-induced metabolic disruption. Our mitochondrial metabolomics service delivers the same quantitative rigor: per-analyte concentrations by LC-MS/MS with isotopically labeled internal standards, from isolated mitochondria, with mechanistic biomarker readouts for drug toxicity assessment.
Metabolomic profiling implicates mitochondrial and immune dysfunction in disease syndromes of the critically endangered black rhinoceros
Corder, M. L., Petricoin, E. F., Li, Y., et al.
Journal: Scientific Reports, 2023, 13, Article 41508
Untargeted metabolomics of black rhinoceros serum identified 636 metabolites and revealed that mitochondrial and immune dysfunction underlies disease syndromes in captive populations. Perturbations in arachidonic acid metabolism, bile acid biosynthesis, and pentose phosphate pathway were linked to mitochondrial ROS production. Seven candidate biomarkers (AUC greater than 0.7) were identified for distinguishing healthy from inflamed animals.
Multi-omics identify xanthine as a pro-survival metabolite for nematodes with mitochondrial dysfunction
Shen, Y., et al.
Journal: The EMBO Journal, 2019, 38(8), e99558
Multi-omics analysis of C. elegans mitochondrial dysfunction mutants identified xanthine as a pro-survival metabolite. Lipidomics and metabolomics revealed that xanthine supplementation rescued survival in mitochondrial complex I and III mutants, demonstrating that metabolomics can identify compensatory metabolic pathways when mitochondrial function is impaired.
The role of carnitine palmitoyl transferase 2 in the progression of salt-sensitive hypertension
Dissanayake, L. V., Smith, B. A., Zietara, A., et al.
Journal: American Journal of Physiology-Cell Physiology, 2025, 329(4)
CRISPR/Cas9-generated CPT2-deficient Dahl salt-sensitive rats exhibited altered long-chain acylcarnitine accumulation and blood pressure regulation under high-salt ketogenic diet. Demonstrates the direct link between mitochondrial fatty acid oxidation (via CPT2) and hypertension progression, with acylcarnitine profiling as the key metabolic readout.
Metabolites and Genes behind Cardiac Metabolic Remodeling in Mice with Type 1 Diabetes Mellitus
Kambis, T. N., Shahshahan, H. R., and Mishra, P. K.
Journal: International Journal of Molecular Sciences, 2022, 23(3), 1392
LC-MS metabolomics of Akita mouse hearts revealed NADH upregulation alongside TCA cycle disruption — decreased acetyl-CoA, citrate, and oxaloacetate, with increased fumarate, malate, and ATP. Demonstrates mitochondrial metabolic remodeling in diabetic cardiomyopathy with NAD+/NADH ratio shifts as a key biomarker.
Teriflunomide/leflunomide synergize with chemotherapeutics by decreasing mitochondrial fragmentation via DRP1 in SCLC
Mirzapoiazova, T., Tseng, L., Mambetsariev, B., et al.
Journal: iScience, 2024, 27(6), 110132
Targeted nucleotide metabolomics in SCLC cells showed that teriflunomide/leflunomide decreased mitochondrial fragmentation via DRP1 phosphorylation inhibition, synergizing with carboplatin and lurbinectedin. Nucleotide pool shifts (ATP, GTP, UTP depletion) reflected mitochondrial bioenergetic dysfunction, demonstrating metabolomics as a drug synergy readout in cancer.


 Contact Us



