Why Dynamic and INST Metabolic Flux Analysis Matters
Conventional isotope-based metabolic flux analysis is most informative when a biological system and its isotope labeling have both reached a stable state. Many important studies do not meet that condition: cells may be adapting to a nutrient switch, responding to a perturbation, progressing through a fed-batch phase, or accumulating label slowly in large metabolic pools. Dynamic and isotopically nonstationary metabolic flux analysis (INST-MFA) recover pathway information from the trajectory of isotope incorporation rather than waiting for a single endpoint measurement.
Our metabolic flux analysis service can be extended to time-resolved studies when the central question is not only where carbon is routed, but when that routing changes. We design the experiment around biologically meaningful sampling windows, tracer atom transitions, and the model constraints needed to distinguish true flux changes from dilution, pool-size effects, or incomplete enrichment.
INST-MFA or Dynamic MFA: Selecting the Correct Modeling Framework
| Study condition | Recommended framework | What is estimated |
| Cell growth and extracellular rates are approximately constant during labeling, but intracellular label enrichment is evolving | INST-MFA | Constant intracellular fluxes, reversible exchange fluxes, and—where supported by the data—metabolite pool sizes |
| Substrate uptake, secretion, biomass formation, metabolite pools, or pathway activity change over the experimental window | Dynamic MFA | Time-varying flux profiles and concentration-dependent pathway behavior across defined phases |
| A short pulse experiment is intended to identify early label propagation or pathway ordering | Tracer kinetic profiling or reduced dynamic model | Relative pathway activity, labeling kinetics, and evidence for model refinement before full flux estimation |
INST-MFA does not remove every steady-state assumption. It is appropriate when metabolic fluxes and pool sizes can reasonably be treated as stable over the labeling window while isotopic enrichment is transient. Dynamic MFA is used when the biological state itself changes and time-dependent flux functions must be fitted. We document this distinction during feasibility review so that a transient-labeling data set is not overinterpreted as a dynamic-flux result.
Why Choose Creative Proteomics for Time-Resolved Fluxomics
- Study design begins with identifiability.
We map the question, tracer positions, accessible metabolites, expected enrichment speed, and available time points before selecting a network. This prevents collecting an elegant time course that cannot constrain the intended branch point.
- Sampling is treated as an analytical variable.
For transient labeling, a delay of seconds can alter the earliest isotopologue measurements. Our workflow plans culture replication, staggered collection, quenching sequence, and extraction batches together rather than treating sample preparation as a downstream task.
- Model assumptions are made visible.
We specify compartment treatment, biomass and exchange constraints, tracer purity, natural-abundance correction, pool-size handling, and any excluded reactions. Residual patterns and confidence intervals are reviewed with the fitted flux map.
- Outputs are built for interpretation.
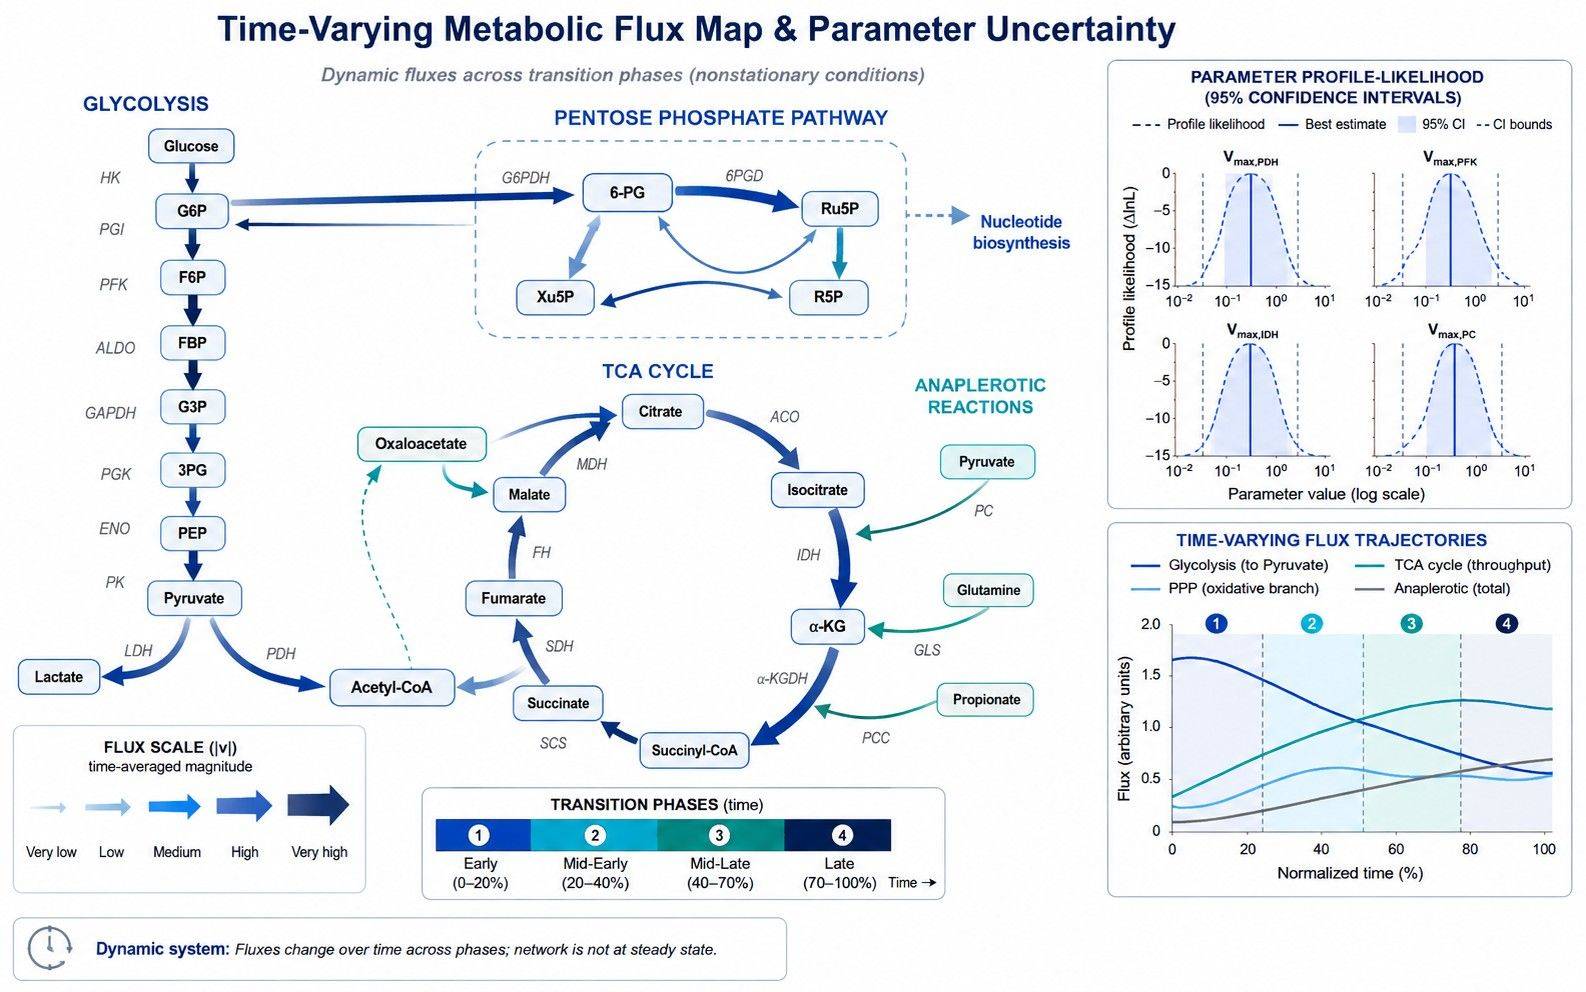
You receive time-course enrichment tables, model-versus-measurement comparison plots, estimated parameter tables with statistical limits, and publication-ready vector figures illustrating pathway fluxes over time.
Tracer Strategies for Nonstationary and Dynamic Studies
| Tracer configuration | Typical application | Transient readout |
| [U-13C6]Glucose step feed | Glycolysis, PPP, and early TCA cycle entry | M+3 triose and pyruvate accumulation versus delayed M+2 or M+4 TCA cycle labeling |
| [1,2-13C2]Glucose pulse | Glycolytic vs. oxidative PPP routing | Early appearance of M+1 vs. M+2 downstream intermediates before secondary label scrambling occurs |
| [U-13C5,15N2]Glutamine pulse | Anaplerosis, transamination, and reductive cycling | Coupled carbon and nitrogen entry into α-ketoglutarate, glutamate, aspartate, and citrate |
| Parallel position-labeled tracer scheme | Resolving network reversibility and exchange fluxes | Complementary label propagation rates across parallel cultures modeled with a joint network formulation |
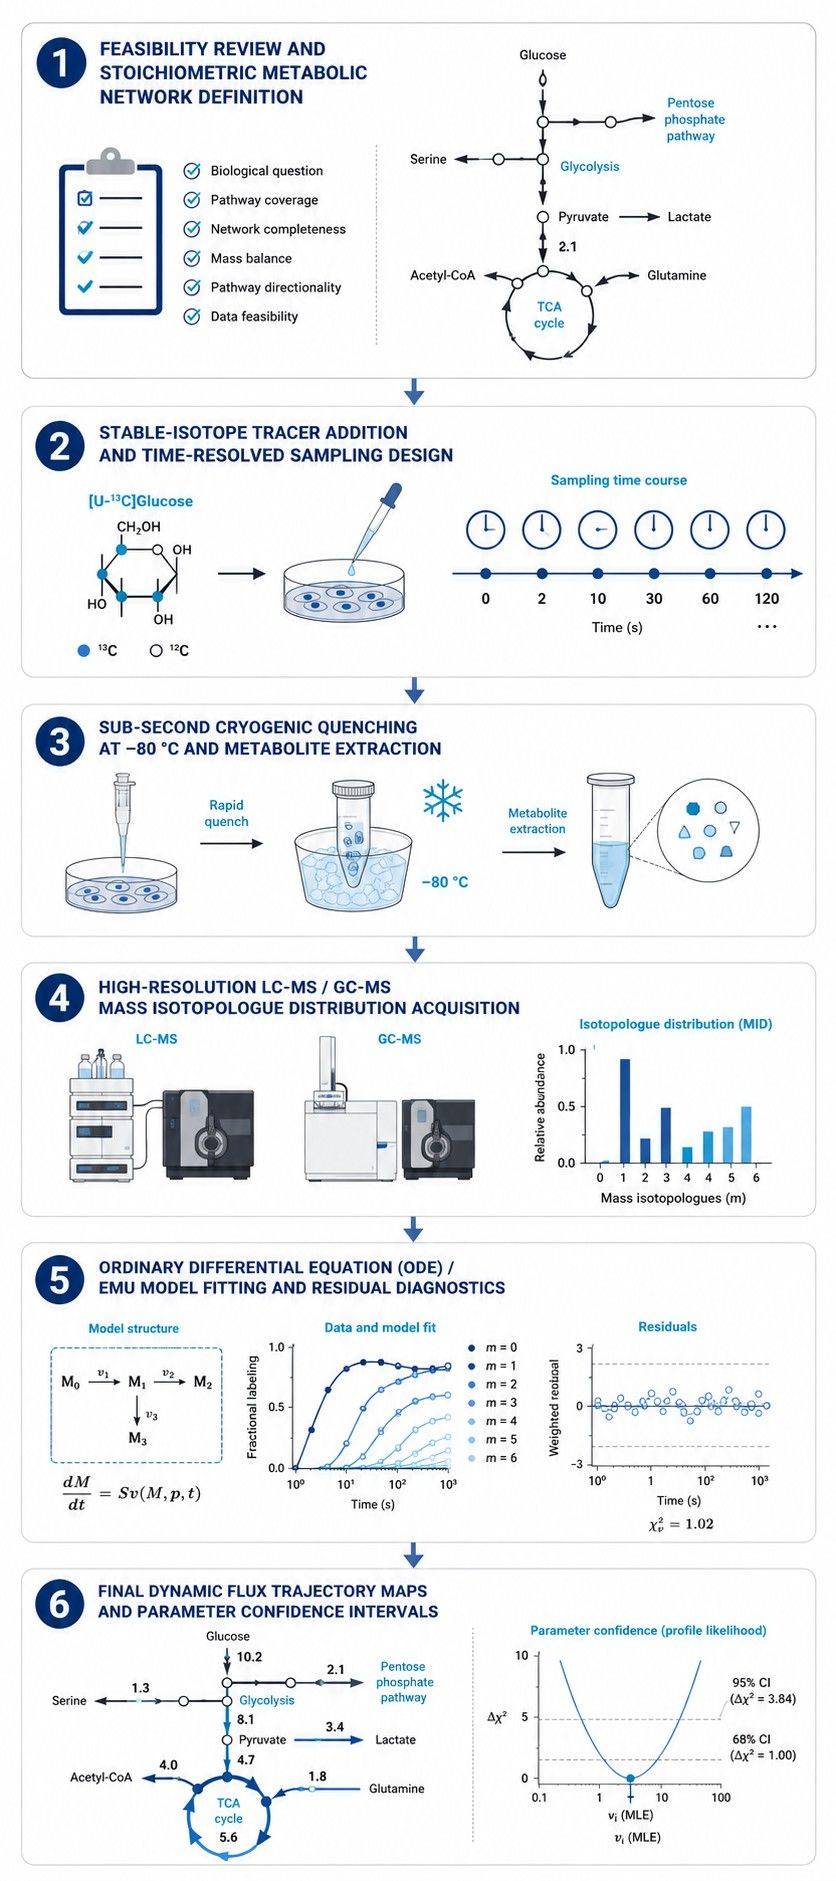
End-to-End Dynamic & INST-MFA Workflow
Sample Collection & Quenching Considerations
| Sample Type |
Typical Guidance |
Harvest and Quenching Principles |
Storage and Shipping |
| Adherent cell cultures |
≥ 1–3 × 10⁶ cells per time point, typically 4–8 time points across 3 biological replicates |
Rapid medium removal, immediate cold solvent addition on dry ice/ice, fast scraping. Avoid room-temperature wash steps. |
Store at −80 °C; ship on dry ice |
| Suspension cells |
≥ 2–5 × 10⁶ cells per time point across planned sampling schedule |
Fast filtration or direct cold quenching into pre-chilled solvent; separate biomass and supernatant quickly to arrest pool turnover. |
Store at −80 °C; ship on dry ice |
| Bioreactor & fermentation samples |
Biomass volume determined by cell density and target intermediate concentrations |
Rapid sampling device or syringe-based cold quenching directly into cold methanol/acetonitrile mixture; minimize harvest transit time. |
Store at −80 °C; ship on dry ice |
| Conditioned culture medium |
≥ 200 µL per time point, matched to cellular sampling times |
Clarify by fast centrifugation at 4 °C; collect supernatants across time course to measure external uptake and secretion rates. |
Store at −80 °C; ship on dry ice |
Research Applications of Time-Resolved Fluxomics
- Transient response to drug treatment: Track metabolic redirection within minutes to hours following kinase inhibition, metabolic enzyme targeting, or pathway rescue.
- Nutrient adaptation & media transition: Measure how cells switch between carbon sources during diauxic shifts, glucose depletion, or amino acid restriction.
- Photosynthetic & autotrophic metabolism: Quantify carbon fixation and assimilate partitioning in microalgae or cyanobacteria where steady-state labeling is slow to achieve.
- Bioprocess phase transitions: Model shifting carbon yields and byproduct accumulation across exponential, transition, and stationary production phases.
What You Receive: Data & Documentation Package
- Time-course isotopologue data matrix: Annotated, natural-abundance-corrected M+0 through M+n values for all target intermediates across every sampling time point (.csv / Excel).
- External boundary rate tables: Measured or fitted time-dependent uptake and secretion rates used as boundary conditions.
- Model definition & equations: Complete stoichiometric reaction list, carbon-atom transition mapping, compartment definitions, and configuration files.
- Fitted flux & parameter summary: Estimated pathway flux values, reversible exchange parameters, and associated statistical confidence intervals.
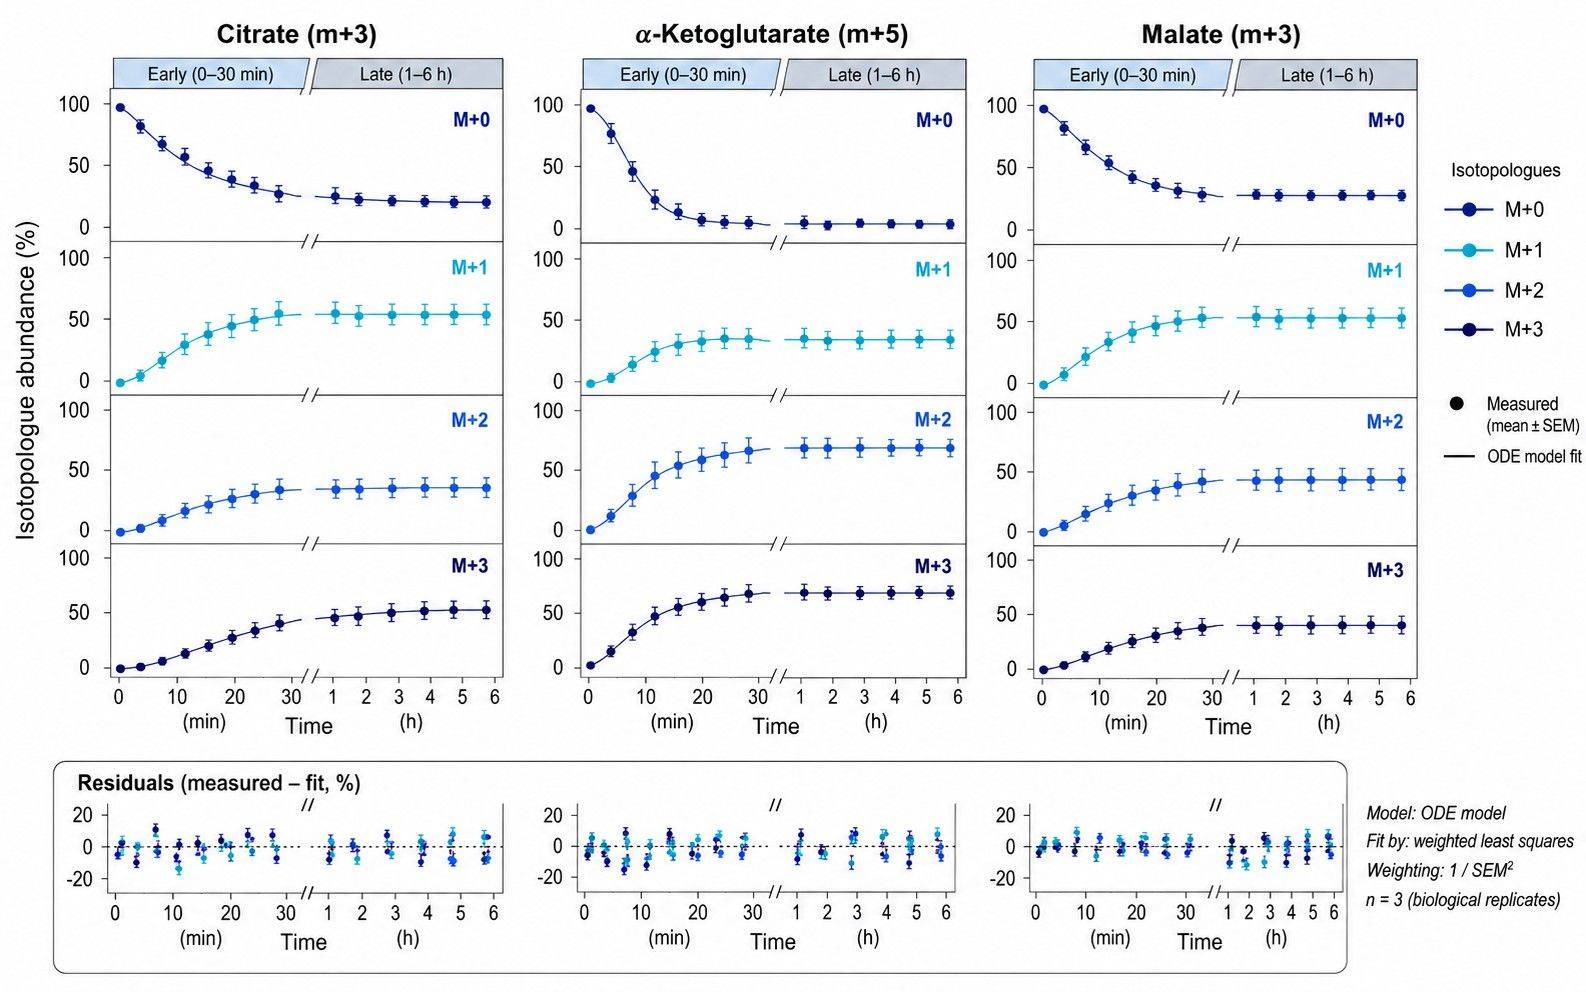
- Residual diagnostics & fit plots: Time-course measurement-versus-model trajectory curves and residual distribution analysis.
- Publication-ready figures: Vector-format metabolic pathway flux maps with time-resolved or phase-specific flux annotations.
Case Study: Dynamic Glucose Flux Redirection in Compensatory Cardiac Hypertrophy
Background: Pressure overload induces cardiac hypertrophy, during which cardiomyocytes undergo dramatic metabolic remodeling. While static metabolomics reveals altered intermediate levels, whether these changes represent altered glycolytic velocity or altered downstream oxidation requires time-resolved stable-isotope tracing in vivo.
Experimental Setup: Mice subjected to transverse aortic constriction (TAC) or sham surgery were infused with [U-13C6]glucose. Ventricular tissue was collected at defined time points following tracer infusion, rapidly quenched, and analyzed by high-resolution LC-MS/MS and GC-MS to measure mass isotopologue enrichment in glycolytic and TCA cycle intermediates.
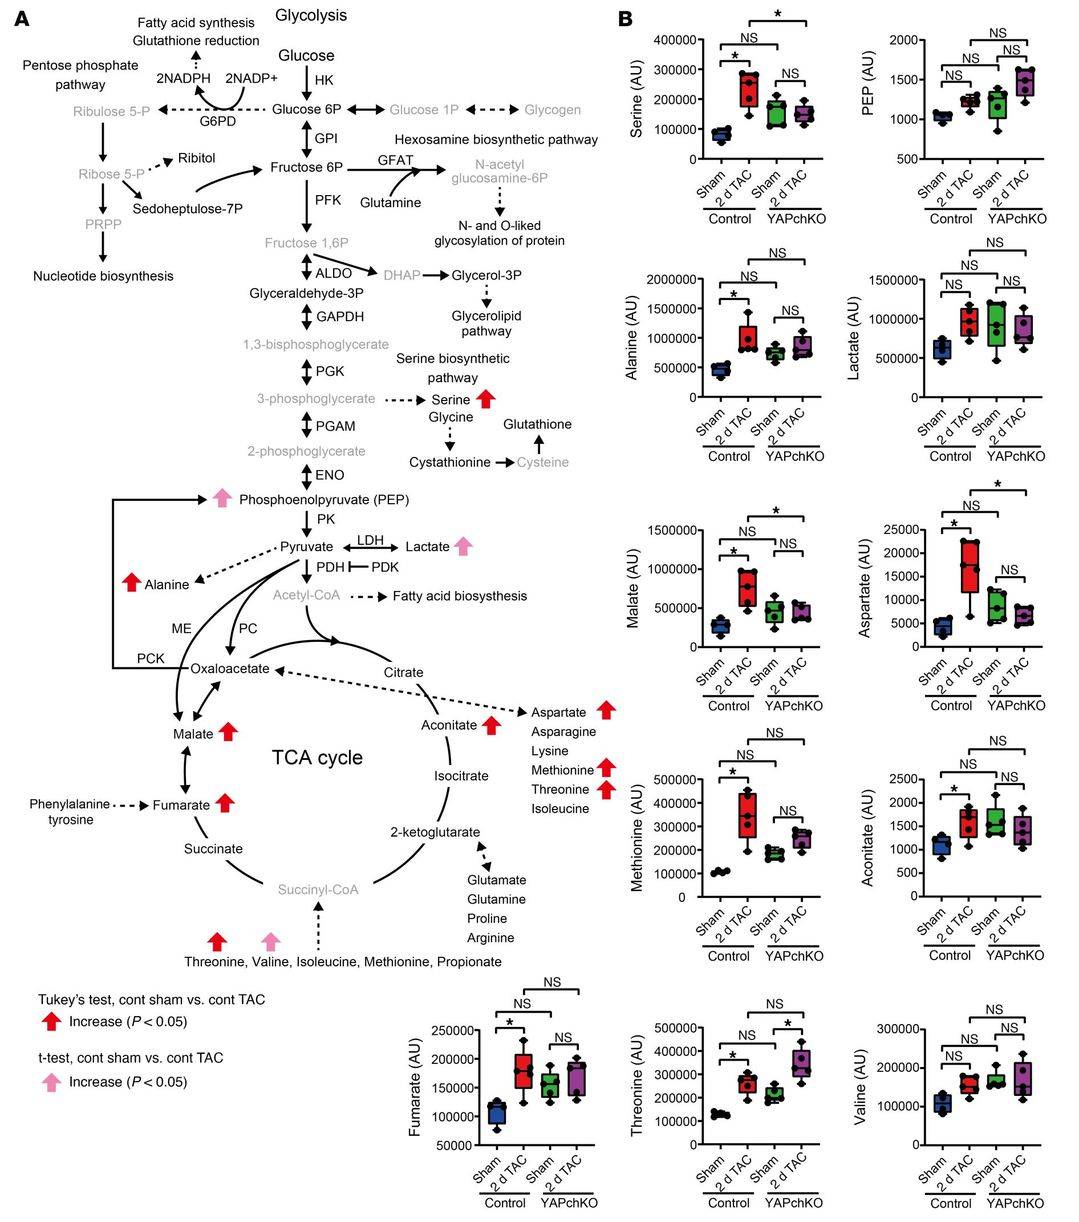
Figure 2. Dynamic 13C-glucose incorporation into glycolytic and TCA cycle intermediates in pressure-overload hypertrophic myocardium vs. sham controls.
Key Findings: Time-course 13C-enrichment revealed that pressure overload selectively accelerates the early flux of glucose through hexokinase and phosphofructokinase into pyruvate and lactate, while uncoupling glycolytic throughput from mitochondrial pyruvate oxidation. Concurrently, tracer incorporation into the hexosamine biosynthetic pathway and de novo serine synthesis was elevated, supporting compensatory myocardial growth.
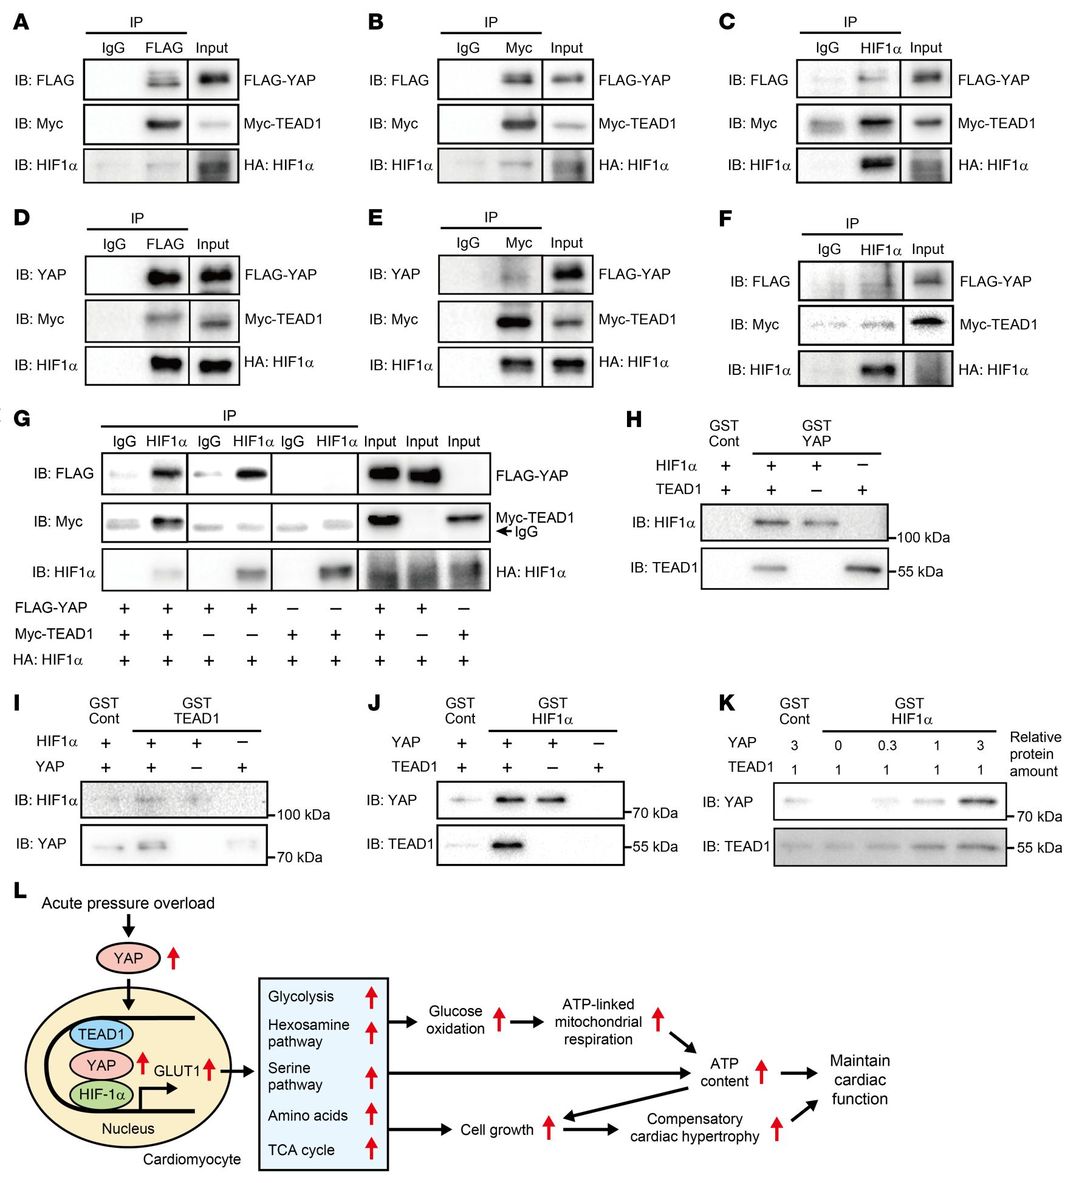
Figure 13. Mechanistic model demonstrating transcriptional regulation of rate-limiting glycolytic flux enzymes driving cardiac remodeling under biomechanical stress.
Reference: The Journal of Clinical Investigation, 2022, 132(6): e150595. DOI: 10.1172/JCI150595


 Contact Us



