Reverse Metabolomics — MS/MS Data Mining for Metabolite Discovery
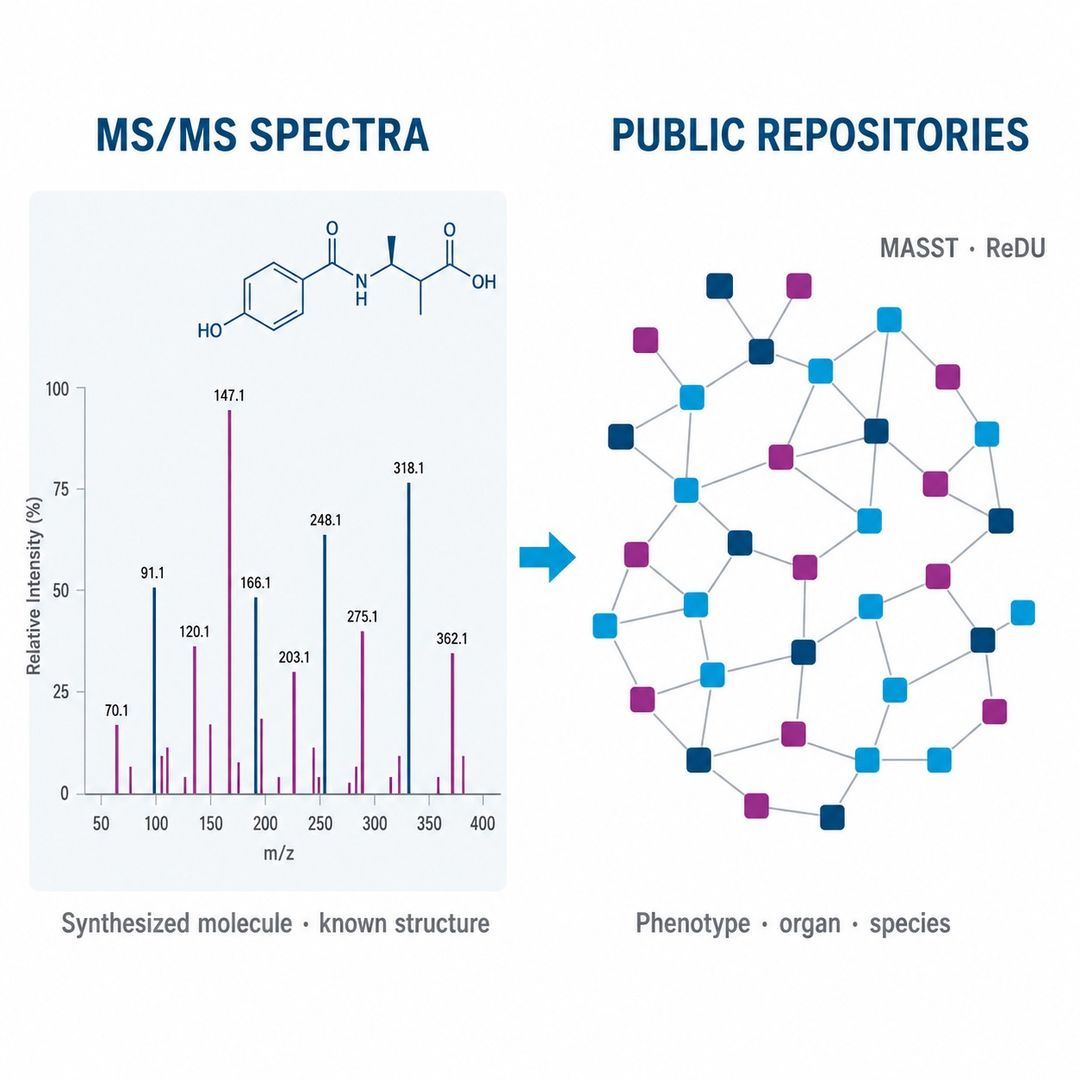
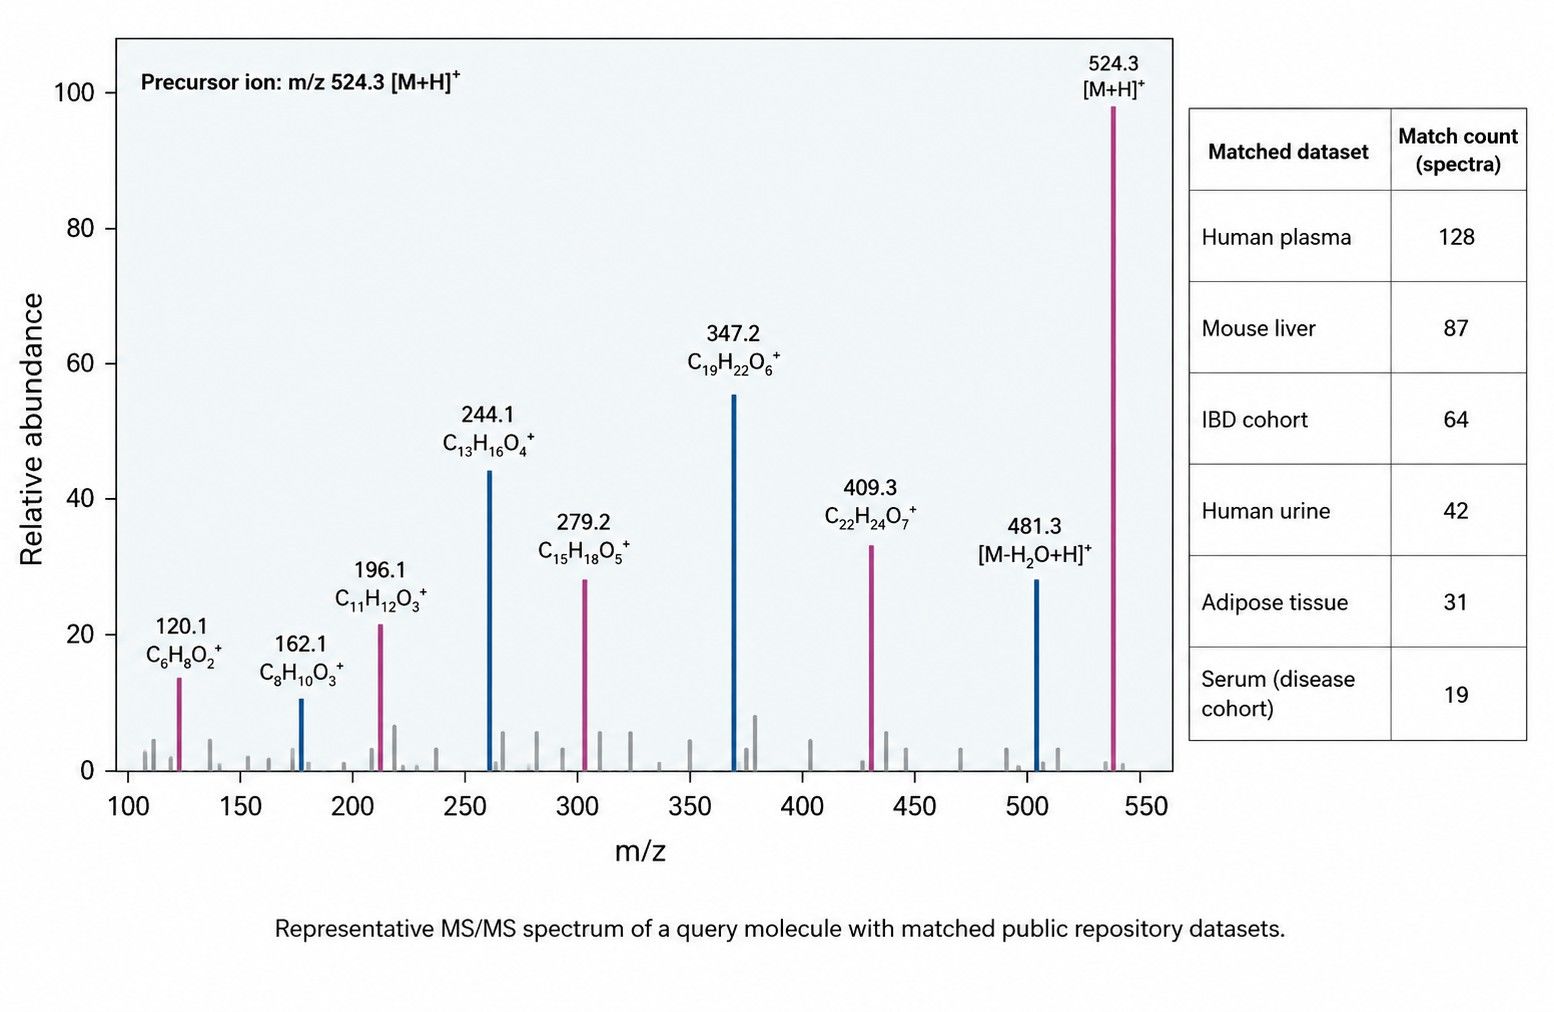
Reverse metabolomics is a discovery framework that acquires MS/MS spectra for molecules of known structure and searches those spectra against public untargeted metabolomics repositories — using tools such as MASST and ReDU — to identify the organisms, organs, disease states, and sample types associated with each molecule.
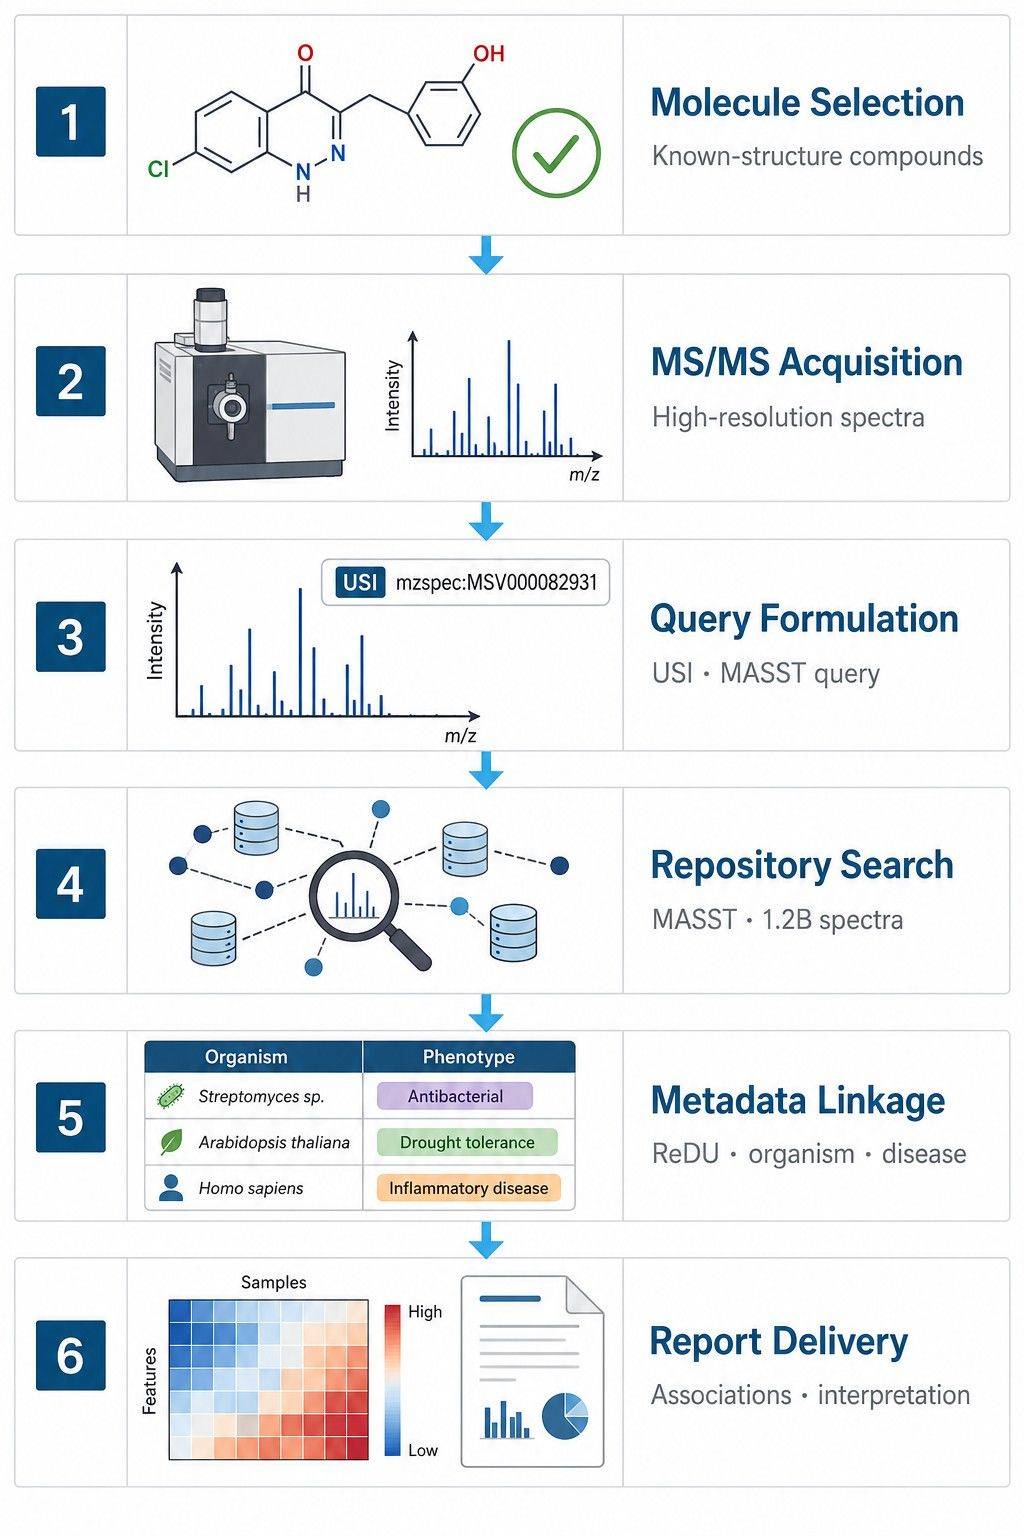
Conventional untargeted metabolomics runs from sample to annotation: you collect samples, acquire LC-MS/MS data, and match features against known-metabolite databases. Reverse metabolomics inverts the flow. You begin with a molecule — often one synthesized for this purpose — and ask where its characteristic MS/MS fingerprint already exists across the global metabolomics archive. A molecule whose spectrum is found in hundreds of human datasets but was never annotated before is, in effect, a newly discovered biological molecule.
Reverse metabolomics delivers:
- Phenotype association: which health or disease states, interventions, and sample types carry a given molecule
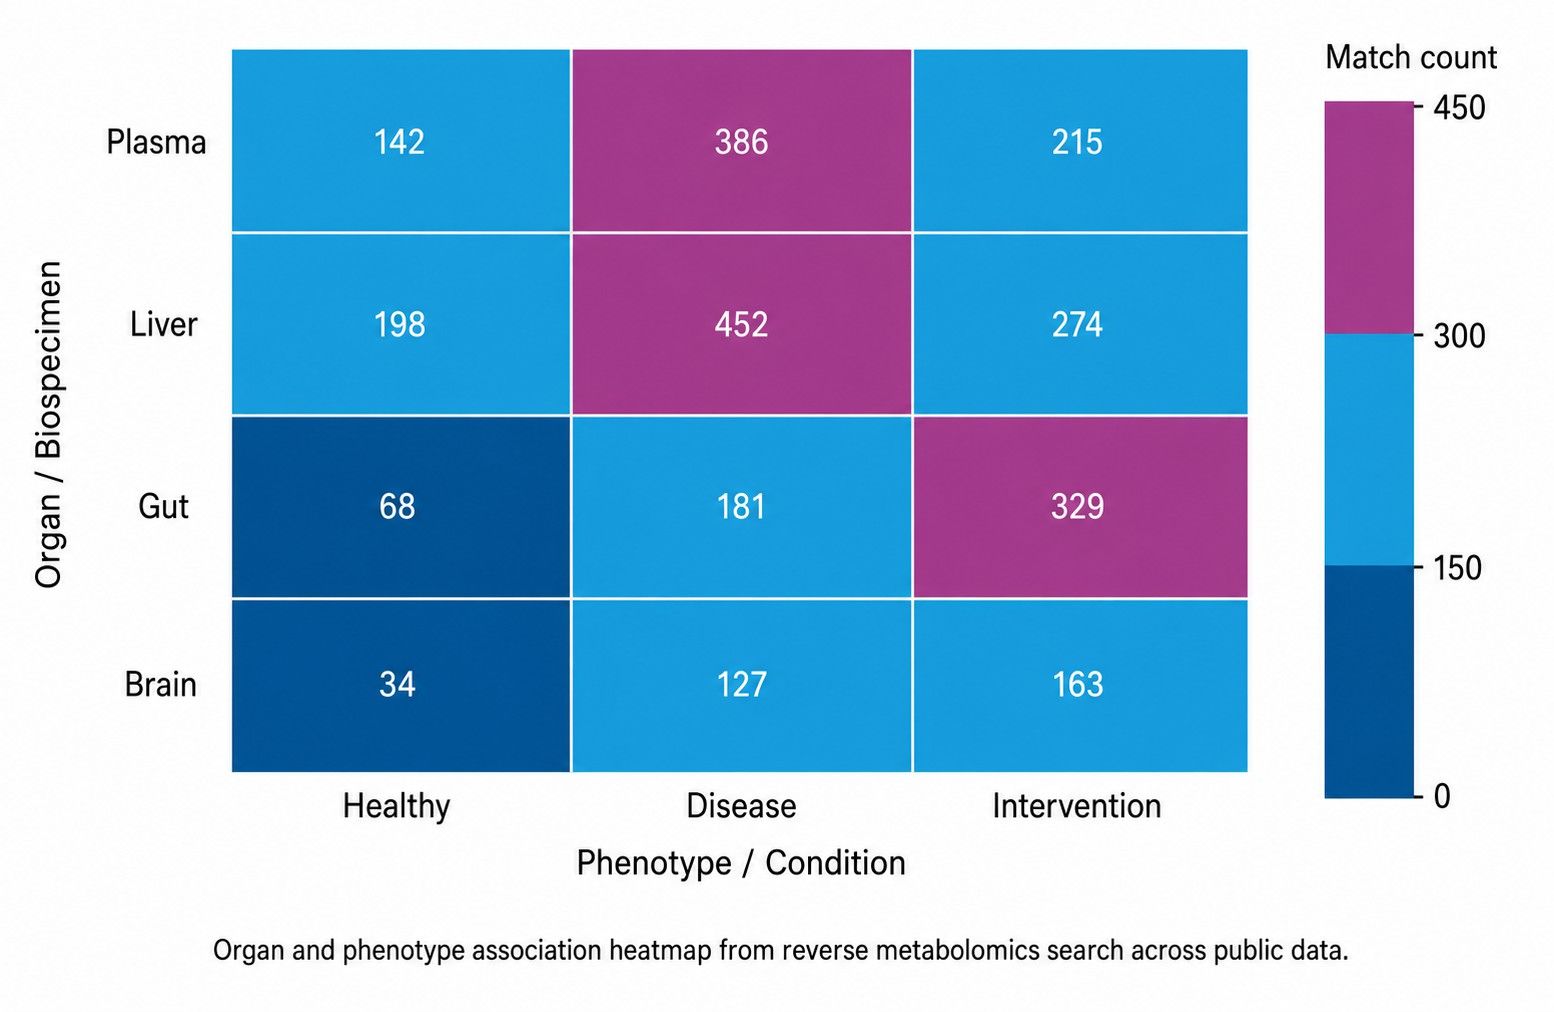
- Organ and species distribution: where a molecule appears across human, rodent, and other datasets
- New-metabolite discovery: molecules present in public data but previously unannotated in commercial databases
- Microbiome attribution: which microbial producers and host-microbiome axes generate a molecule
Forward vs. Reverse Metabolomics — Two Complementary Discovery Paths
The two approaches answer different questions and are best used together:
Forward Metabolomics vs. Reverse Metabolomics
| Dimension | Forward Metabolomics | Reverse Metabolomics |
| Starting point | Your biological samples | A molecule of known structure |
| Data flow | Sample → acquisition → annotation | Spectrum → public repository search → association |
| Primary question | "What is in my sample?" | "Where does this molecule appear?" |
| Output | Annotated feature list from your cohort | Phenotype and organ map across global data |
| Discovery power | Limited to existing database entries | Reveals previously unannotated molecules |
For the experimental MS/MS data that reverse metabolomics queries, our untargeted metabolomics service provides high-resolution acquisition from your own samples — the two workflows read the same data from complementary directions.
Reverse Metabolomics Platform and Technical Parameters
Our reverse metabolomics workflow combines in-house MS/MS acquisition with public-repository search tooling:
| Parameter | Specification |
| MS/MS acquisition | High-resolution LC-MS/MS for molecules of interest |
| In silico exploration | Predicted MS/MS spectra for hypothesis screening before synthesis; custom synthesis support for candidate validation |
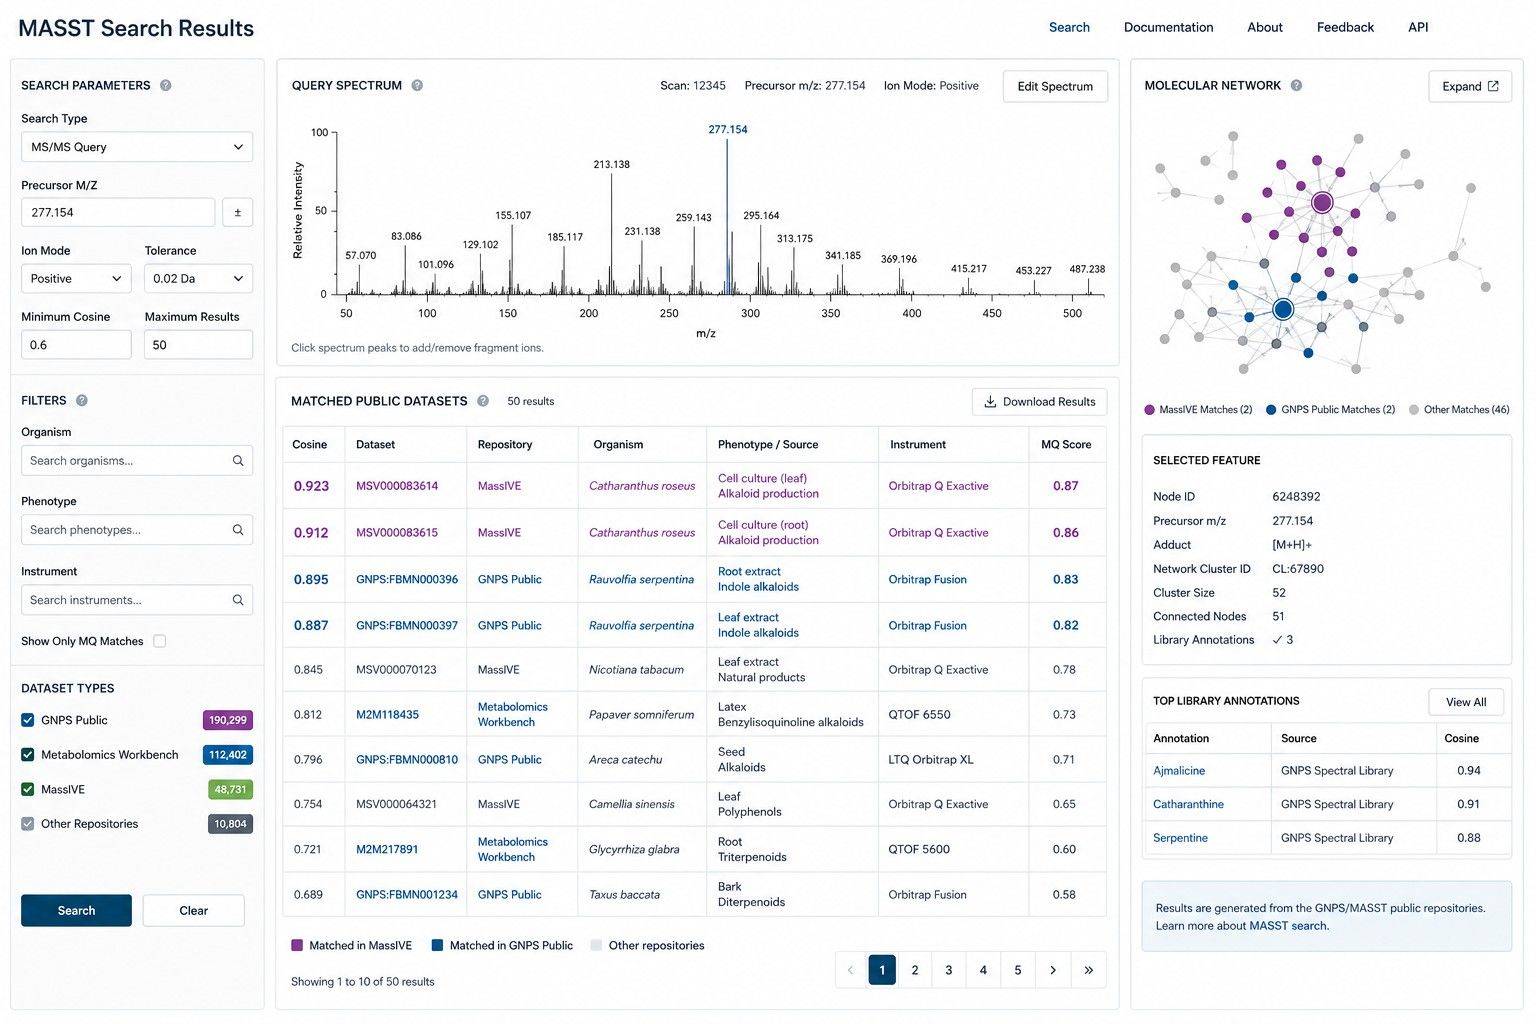
| Public spectrum search | MASST — searches MS/MS fingerprints against ~1.2 billion public spectra |
| Metadata filtering | ReDU — links matched datasets to organism, disease, biospecimen, and phenotype |
| Microbial strain attribution | microbeMASST — links matched spectra to 60,000+ cultured microbial strains for species-level producer attribution |
| Network framework | GNPS-based molecular networking for producer and co-occurrence analysis |
| Query formulation | MassQL — mass-spectrometry query language for targeted structure classes |
| Confidence | Level 2–3 annotation with spectral match and retention alignment |
| Deliverables | Association tables, organ/phenotype heatmaps, dataset matches |
Target Metabolite Classes for Reverse Discovery (Bile Acids, N-Acyl Amides, Lipids)
Reverse metabolomics has proven especially powerful for compound classes that are underrepresented in commercial databases but abundant in biological data:
| Compound class | Examples and notes |
| Bile acids and amidates | Conjugated bile acids — microbially modified species linked to gut health and disease |
| N-acyl amides | Fatty acid–amino acid conjugates with signaling roles in the microbiome-host axis |
| Fatty acid esters | Hydroxy fatty acid esters and related lipid classes |
| Microbiome metabolites | Host-microbiome derived molecules with limited database coverage |
| Xenobiotic derivatives | Drug and environmental compound metabolites |
Reverse Metabolomics Workflow — A Step-by-Step Guide
Input Requirements: Reference Compounds, Synthesized Molecules, and Spectra Files
Reverse metabolomics can work from either existing LC-MS/MS data or new samples for acquisition:
| Input | Requirements and notes |
| Existing MS/MS data | Previously acquired LC-MS/MS files in standard format (mzML, mzXML) can be queried directly |
| New sample acquisition | Biofluids, tissues, or microbial cultures for fresh MS/MS acquisition |
| Reference compounds | Standards or synthesized molecules for which MS/MS spectra are to be generated |
| Minimum input | Reverse search requires only a spectrum — no large sample cohort is mandatory |
| Metadata | Study context (organism, condition, intervention) improves association interpretation |
Why Choose Our Reverse Metabolomics Service
- Big-data discovery, not just annotation
Reverse metabolomics asks where a molecule appears globally, revealing biological roles that sample-level annotation misses.
- Public repository expertise
We work with MASST, ReDU, and GNPS tooling to mine the largest public metabolomics archives.
- New-molecule discovery
Molecules present in public data but absent from commercial databases can be surfaced as novel biological findings.
- Microbiome-host attribution
Reverse search resolves which metabolites are microbially derived and where they associate with disease.
- Complementary acquisition
Pair reverse discovery with untargeted metabolomics for the full forward and reverse picture.
Reverse Metabolomics Data Deliverables and Association Evidence
You receive a complete, interpretation-ready reverse metabolomics result set:
- Association tables linking each query molecule to matched datasets, organisms, and phenotypes
- Organ and species distribution maps as heatmaps across human and rodent data
- Producer and co-occurrence analysis from GNPS molecular networking
- Dataset match reports listing the specific public studies where each molecule was found
- Interpretation summary translating matches into biological hypothesis and follow-up actions
Applications
- Discovery biology — surface previously unannotated molecules and their phenotype associations from global data
- Microbiome-host research — attribute metabolites to microbial producers and trace host-microbiome axes
- Natural product research — locate known-structure molecules across datasets to prioritize bioactive candidates
- Drug metabolism — search for drug and metabolite fingerprints across public data to map exposure and response
- From discovery to validation — candidate biomarkers surfaced in public data can be carried into targeted MRM/PRM absolute quantification in your own cohort, closing the loop from repository discovery to validated measurement.
Case Study: First Identification of Cholestenoic Acid as an Endogenous Epigenetic Regulator
Cholestenoic acid as endogenous epigenetic regulator decreases hepatocyte lipid accumulation in vitro and in vivo
Wang, Y., Pandak, W. M., Hylemon, P. B., Min, H.-K., Min, J., Fuchs, M., et al. | American Journal of Physiology-Gastrointestinal and Liver Physiology, 2024, 326(2), G147–G162
DOI: 10.1152/ajpgi.00184.2023
Background
Hepatic lipid accumulation is a hallmark of metabolic liver disease, yet the endogenous small molecules that regulate hepatocyte lipid metabolism through epigenetic mechanisms remain incompletely characterized.
Challenge: Identify a previously uncharacterized endogenous bile acid species and define its regulatory role in hepatocyte lipid metabolism.
Analytical Approach
Untargeted lipidomics was performed at Creative Proteomics (New York) on HepG2 cells treated with cholestenoic acid, coupled with transcriptomic and epigenomic analysis. This study was, to the authors' knowledge, the first to identify the mitochondrial monohydroxy bile acid cholestenoic acid as an endogenous epigenetic regulator of lipid metabolism.
Key Findings
| Metric | Finding |
| New endogenous regulator | Cholestenoic acid identified as an endogenous epigenetic regulator of lipid metabolism |
| Lipid accumulation | Cholestenoic acid decreased hepatocyte lipid accumulation in vitro and in vivo |
| Lipidomic readout | Untargeted lipidomics at Creative Proteomics profiled the metabolic response |
| Mechanism | Epigenome modification linked to global lipid metabolism regulation |
What This Means for Your Reverse Metabolomics Study
- New endogenous molecules drive biology. This study identified a previously uncharacterized bile acid as a functional regulator — the kind of molecule reverse metabolomics surfaces systematically by searching public data.
- Bile acid biology is rich in unannotated species. The bile acid family is a prime reverse metabolomics target, where synthesized standards reveal species that conventional databases miss.
- Lipidomics provides the discovery readout. Untargeted lipidomics generated the data layer that resolved the new regulator — the same acquisition we pair with reverse search.
Conclusion
This study shows how identifying a previously uncharacterized endogenous metabolite can reveal a regulatory mechanism. Our reverse metabolomics service extends this capability at scale — searching the MS/MS fingerprints of known-structure molecules across public data to surface new biological molecules and their phenotype associations.


 Contact Us



