GC-MS-Based Metabolic Flux Analysis — Exploiting Fragment-Level Information
While liquid chromatography-mass spectrometry (LC-MS) excels at measuring intact whole-molecule mass isotopologue distributions (MIDs), gas chromatography-mass spectrometry (GC-MS) under standard electron ionization (EI, 70 eV) produces reproducible, unimolecular fragmentation patterns. These characteristic fragment ions contain specific, well-defined subsets of carbon atoms from the original metabolite backbone (e.g. fragments retaining C1–Cn versus C2–Cn), providing crucial positional isotope constraints without requiring tandem MS fragmentation or nuclear magnetic resonance (NMR).
As a foundational methodology within our comprehensive metabolic flux analysis service, GC-MS-based MFA provides high chromatographic peak capacity, baseline separation of critical isomers, and deep spectral reproducibility. This platform enables you to:
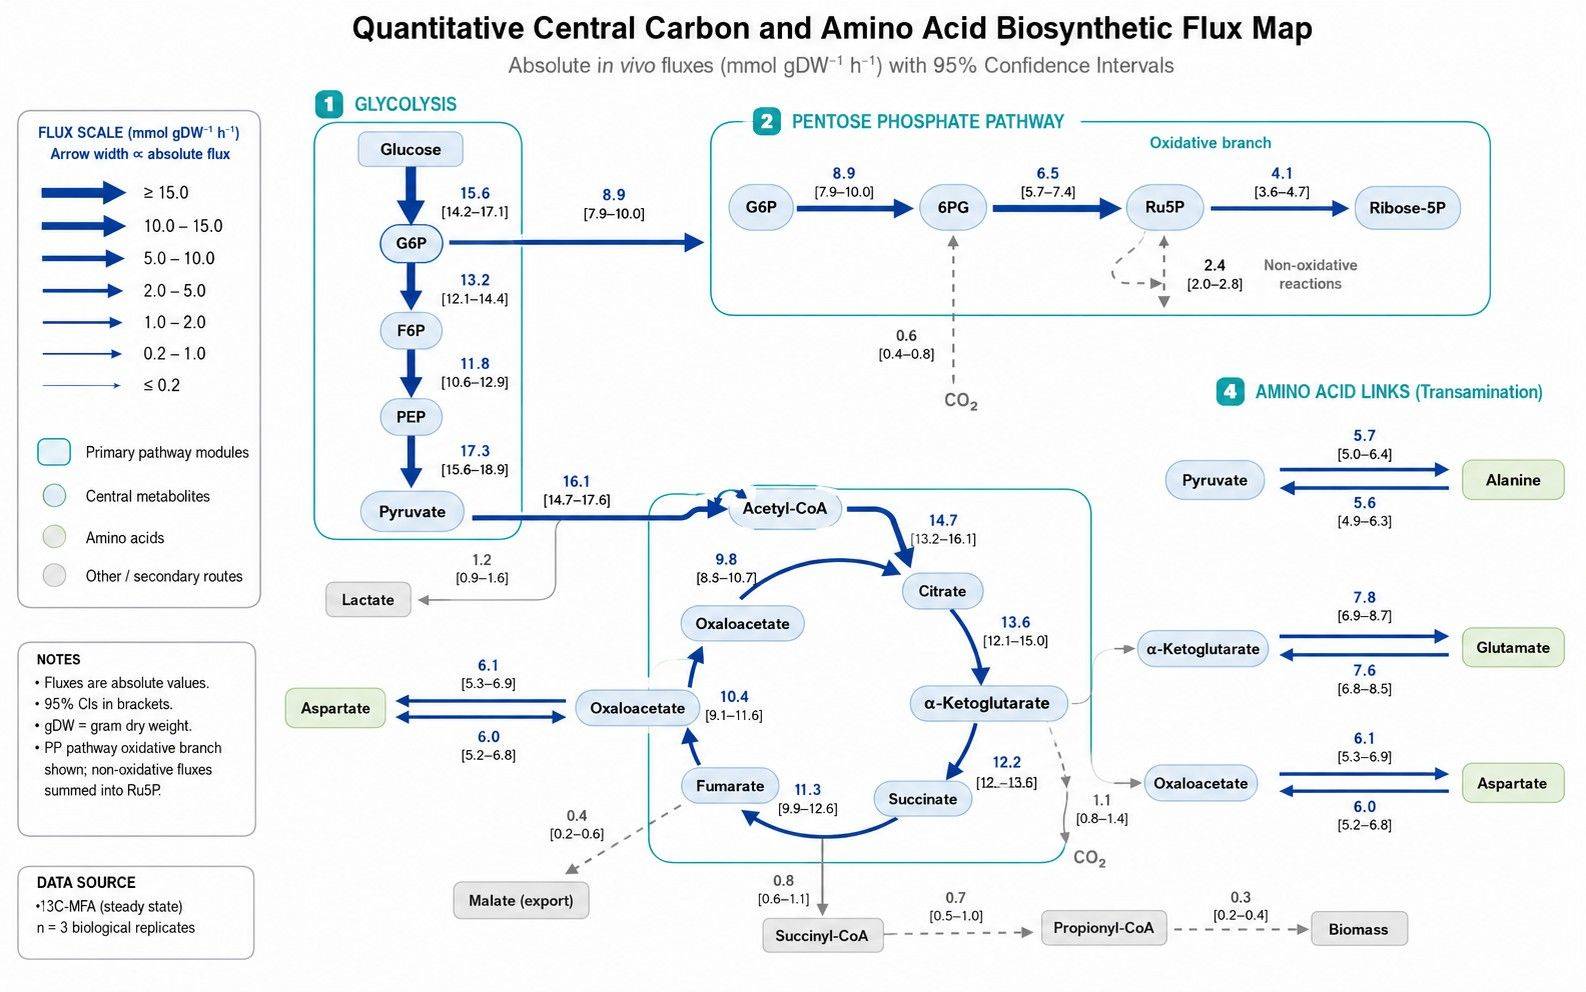
(i) Resolve carbon transition pathways across glycolysis, the pentose phosphate pathway (PPP), and the tricarboxylic acid (TCA) cycle
(ii) Quantify protein-bound amino acid isotopologue distributions representing integrated, time-averaged steady-state fluxes in microbial and mammalian cultures
(iii) Differentiate anaplerotic flux through pyruvate carboxylase (PC) versus pyruvate dehydrogenase (PDH) using fragment-specific mass shifts in malate, aspartate, and citrate
(iv) Calculate reversible transamination and exchange velocities across amino acid biosynthesis pathways.
What Analytical Challenges Do We Solve in GC-MS Fluxomics?
Accurate GC-MS flux analysis demands robust chemical derivatization, elimination of thermal degradation artifacts, and precise multi-element isotopic correction. Creative Proteomics solves these technical bottlenecks with a dedicated analytical workflow that is:
- Fragment-Resolved: Utilizing well-characterized tert-butyldimethylsilyl (TBDMS) and trimethylsilyl (TMS) fragmentation channels (such as [M-57]+, [M-159]+, and [M-85]+) to isolate specific carbon sub-skeletons.
- Correction-Rigorous: Correcting raw mass isotopologue signals for natural abundances of carbon (13C), silicon (29Si, 30Si from silyl tags), nitrogen (15N), and oxygen (18O) using matrix deconvolution routines (IsoCor, AccuCor).
- Quantitatively Constrained: Coupling intracellular labeling measurements with extracellular glucose uptake, lactate secretion, and amino acid exchange rates measured via targeted metabolomics panels to establish absolute molar flux boundaries.
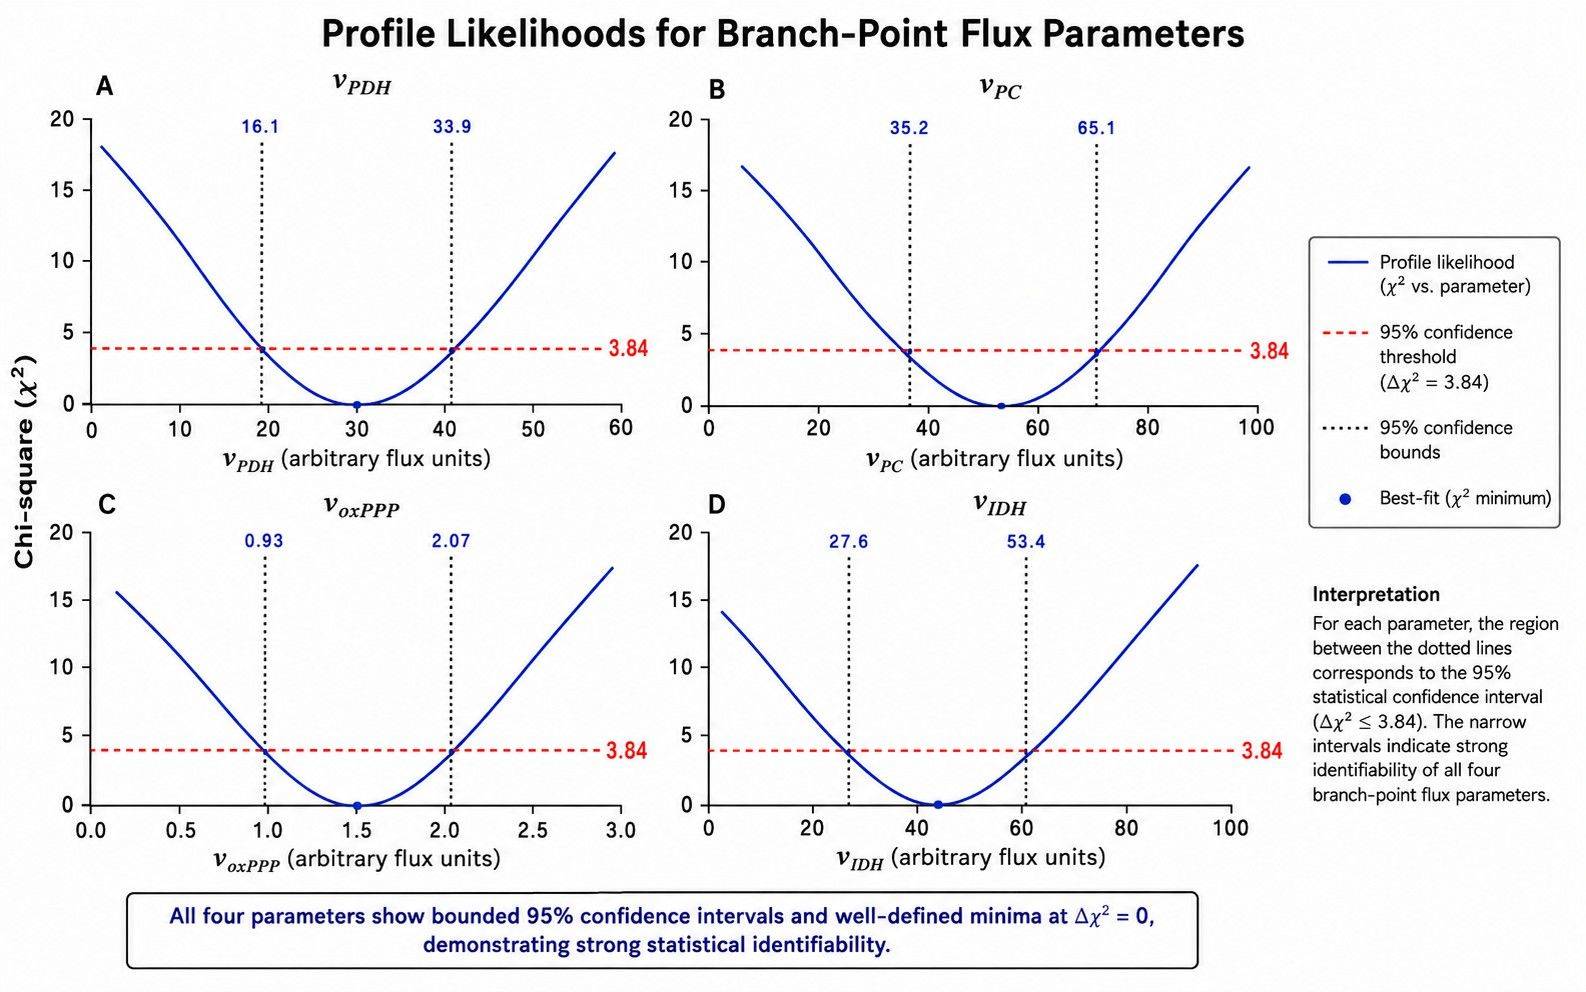
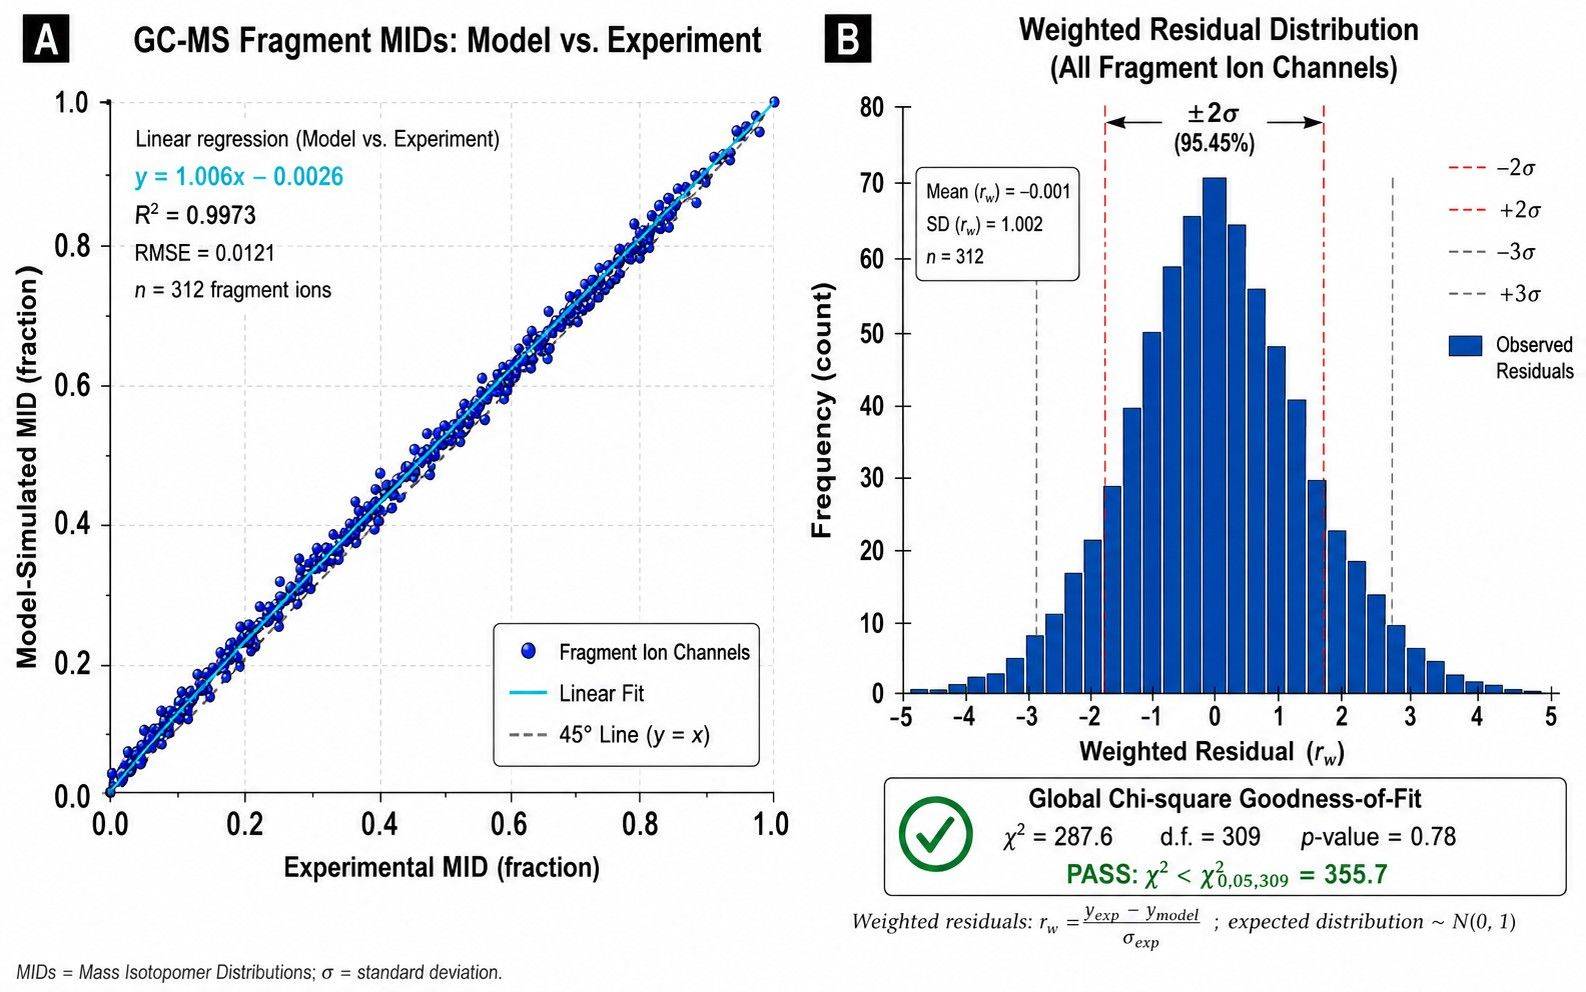
- Model-Validated: Implementing Elementary Metabolic Unit (EMU) regression algorithms in INCA and 13CFLUX2, validated by Chi-square (χ²) goodness-of-fit testing and non-linear 95% profile likelihood confidence intervals.
Derivatization Strategies: Optimizing Analyte Volatility and Fragmentation
GC-MS requires chemical derivatization to replace active hydrogen atoms (in -COOH, -OH, -NH2, -SH groups) with volatile, thermally stable silyl or alkyl moieties. We select chemistries optimized for specific metabolite classes and target fragmentation channels.
1. Silylation & Alkylation Decision Matrix
| Derivatization Chemistry |
Target Metabolite Classes |
Key Diagnostic Fragments & Carbon Constraints |
| TBDMS Silylation (MTBSTFA + 1% TBDMCS) |
Proteinogenic amino acids (Ala, Val, Leu, Ile, Pro, Gly, Ser, Thr, Met, Asp, Glu, Phe, Tyr) and TCA organic acids (succinate, fumarate, malate, citrate) |
Loss of tert-butyl radical yields abundant [M-57]+ (intact carbon backbone) and [M-159]+ (loss of C1-alpha carboxyl group, retaining C2–Cn carbons). Highly stable with minimal secondary fragmentation. |
| Two-Step MOX-TMS (Methoximation + MSTFA / BSTFA) |
Keto acids (pyruvate, alpha-ketoglutarate, oxaloacetate), phosphorylated sugars (glucose-6-phosphate, 3PG, PEP), and polyols |
Methoximation protects carbonyl groups against decarboxylation/enolization, followed by trimethylsilylation. Yields molecular ions and characteristic fragment series for central carbon intermediates. |
| Chloroformate Alkylation (MCF / ECF / PCF) |
Free intracellular and extracellular amino acids, non-proteinogenic amines, and short-chain organic acids |
Rapid aqueous-phase reaction converting amino and carboxyl groups into alkyl carbamates and esters within seconds without heating, preserving thermally labile species. |
| Acid Hydrolysis (6 M HCl) for Protein-Bound Pools |
Total cellular biomass hydrolysate |
Hydrolyzes structural proteins (105–110 °C, 16–24 h) into constituent amino acids for long-term time-averaged steady-state flux determination in slow-growing systems. |
2. Comparison of Standard 13C Tracer Configurations for GC-MS-MFA
| Tracer Substrate |
Target Metabolic Decision Node |
GC-MS Fragment Readout & Analytical Value |
| [1,2-13C2]Glucose |
Glycolysis vs. Oxidative Pentose Phosphate Pathway (PPP) split ratio |
Direct glycolysis yields [M-57]+ M+2 lactate and alanine (C1-C2-C3). Oxidative PPP decarboxylation of carbon-1 as 13CO2 yields M+1 lactate and alanine. Quantified via our pentose phosphate pathway metabolic flux analysis. |
| [U-13C6]Glucose |
Glycolytic rate, PDH vs. PC entry into TCA, and amino acid biosynthesis |
PDH entry generates M+2 acetyl-CoA → M+2 citrate, glutamate (C4-C5), and alpha-KG; PC entry yields M+3 oxaloacetate → M+3 malate, aspartate, and citrate in our glycolytic pathway metabolic flux analysis. |
| [U-13C5]Glutamine |
Oxidative TCA cycle cycling vs. IDH-mediated reductive carboxylation |
Oxidative metabolism yields M+4 alpha-KG, succinate, malate, and aspartate; reverse reductive carboxylation generates M+5 citrate and M+3 malate for lipid synthesis within our TCA cycle metabolic flux analysis. |
| Parallel [1-13C]Glucose + [U-13C6]Glucose |
Comprehensive central network identifiability |
Simultaneously fitted in a unified stoichiometric model to resolve non-oxidative PPP reversibility (transketolase/transaldolase) and anaplerotic flux within our 13C metabolic flux analysis framework. |
Why Choose Our GC-MS-Based Metabolic Flux Analysis Service?
- Fragment-Level Positional Information without MS/MS Complexity
Predictable unimolecular EI fragmentation generates distinct fragment ions corresponding to specific carbon backbone segments, providing position-specific labeling constraints without costly tandem MS methods.
- High Chromatographic Resolution & Retention Index Consistency
Ultra-inert capillary GC columns (DB-5ms UI) deliver sharp chromatographic peaks, resolving isomeric amino acids (leucine vs. isoleucine) and organic acids with retention time repeatability (CV < 0.2%).
- Protein-Bound Biomass Hydrolysis Capability
Direct measurement of protein-bound amino acids averages out short-term fluctuations, capturing the true time-integrated metabolic steady state of microbial fermentations and bioreactor cultures.
- Multi-Element Natural Abundance Deconvolution
Our automated computational pipeline rigorously corrects for natural isotopic contributions of 13C, 29Si, 30Si, 15N, 18O, and 34S, ensuring unbiased mass isotopologue inputs for EMU network regression.
Instrumentation & Method Parameters for GC-MS Flux Profiling
Analytical Platform
Gas Chromatography-Mass Spectrometry (GC-MS) System
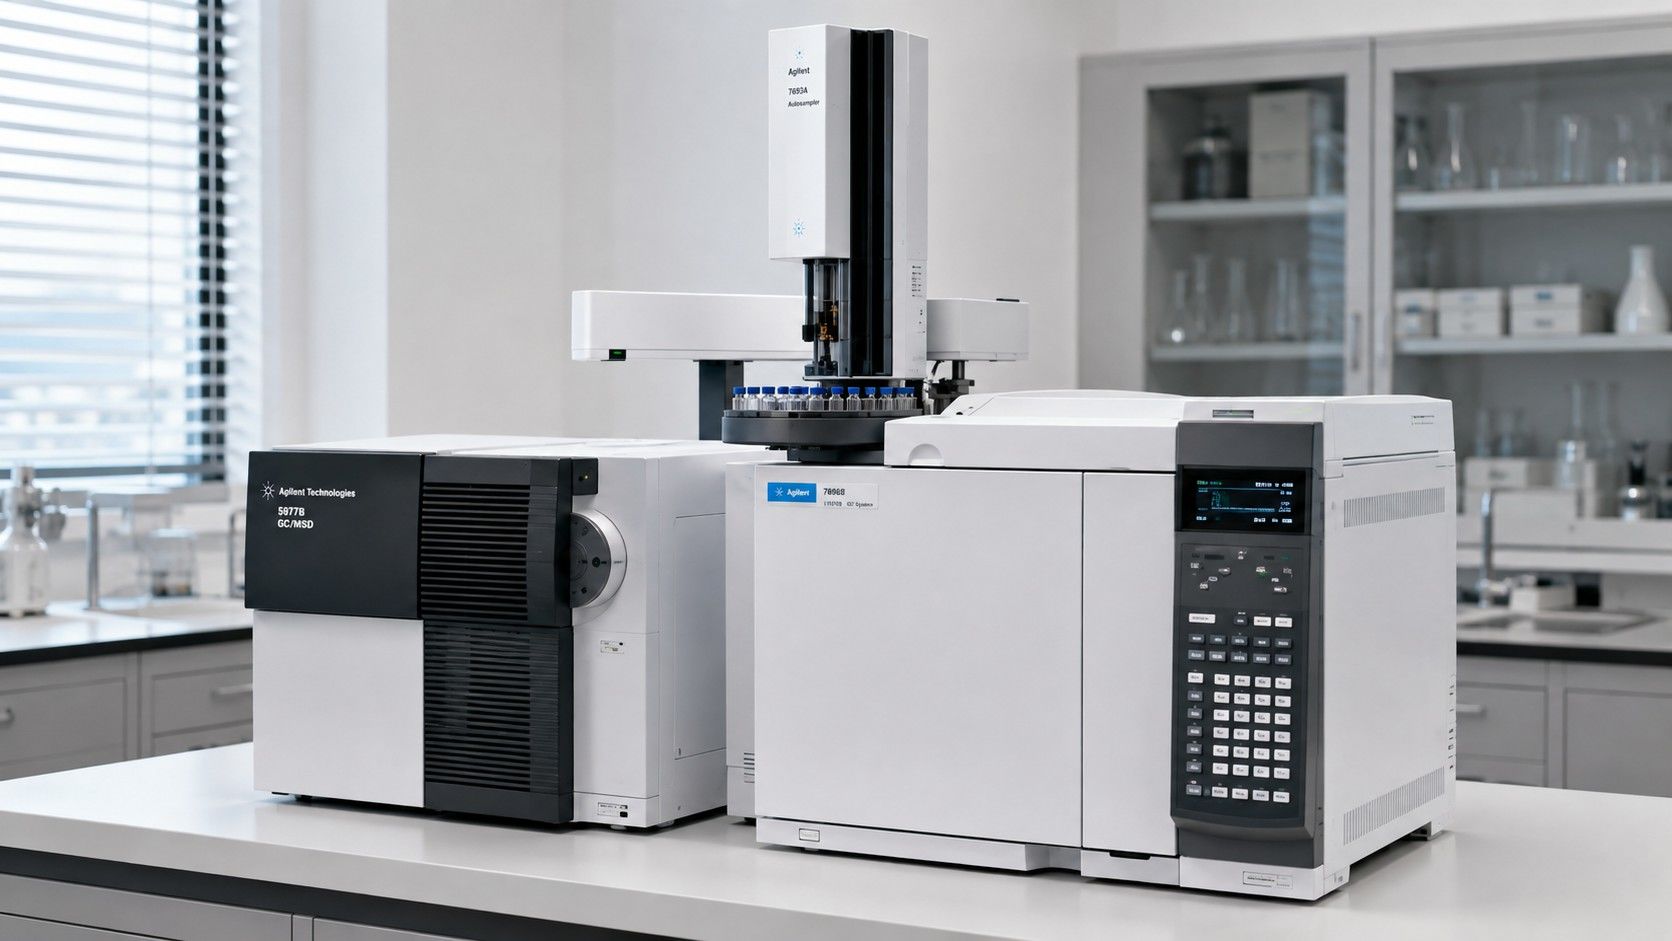
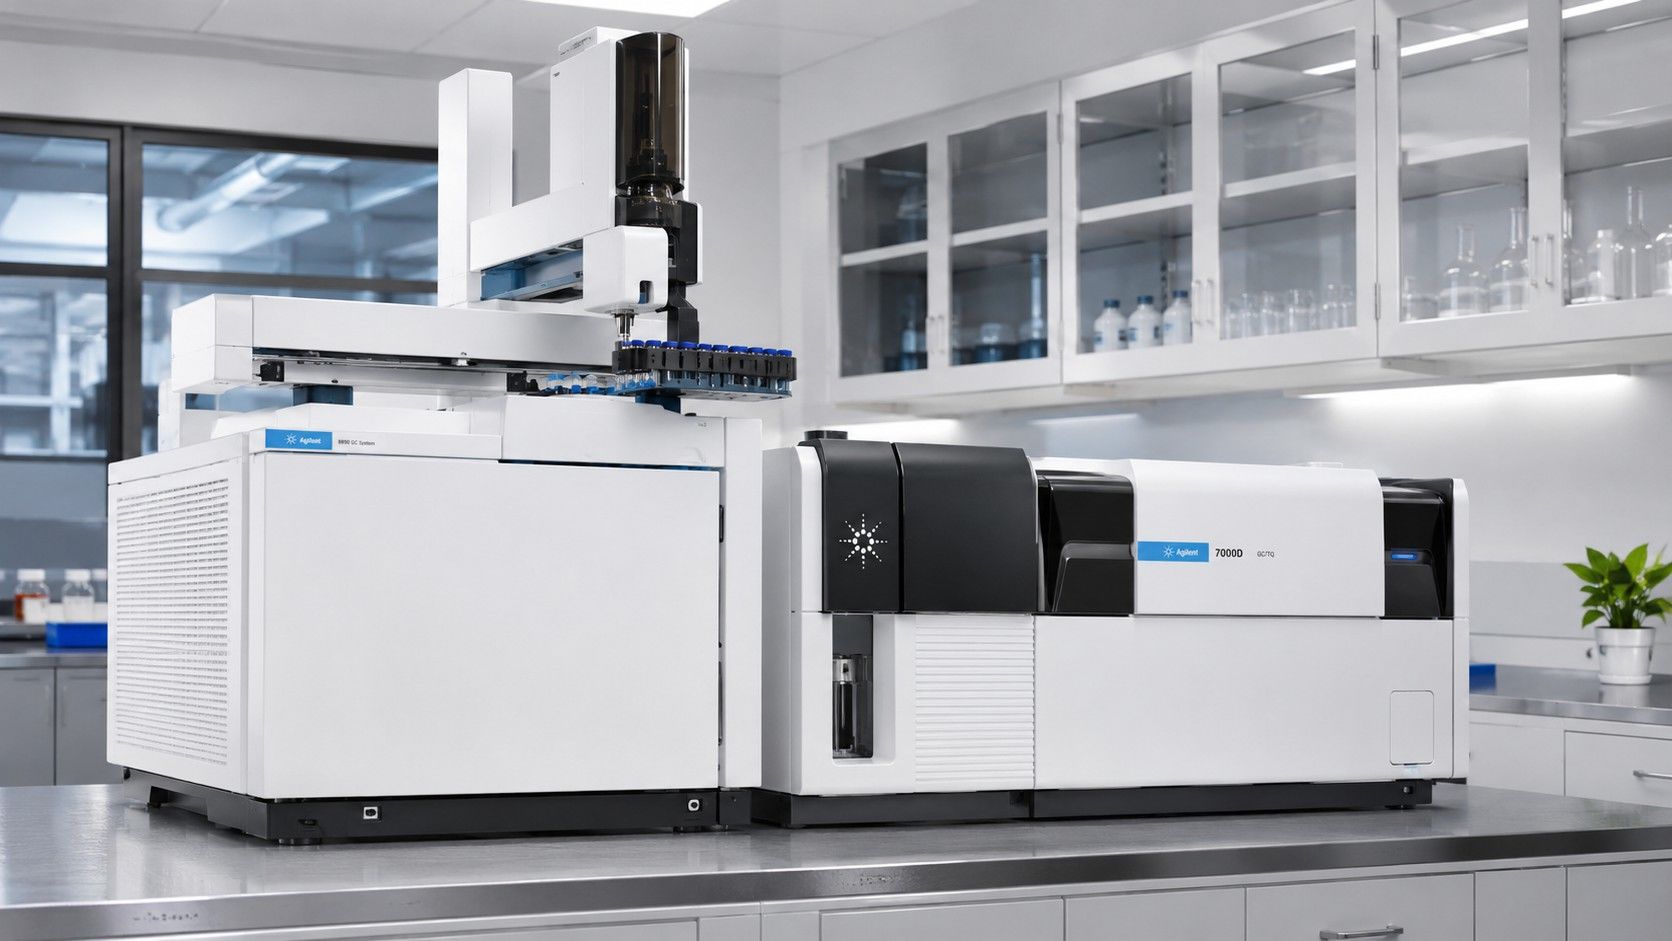
Gas Chromatograph: Agilent 7890B / 8890 GC System with 7693A Autosampler
Mass Spectrometer: Agilent 5977B / 7000D Mass Selective Detector (MSD)
Ionization Source: Electron Ionization (EI, 70 eV), Ion Source Temperature: 230 °C, Quadrupole: 150 °C
GC Column: DB-5ms Ultra Inert Capillary Column (30 m × 0.25 mm × 0.25 μm, 5% phenyl methylpolysiloxane)
Carrier Gas: Ultra-high purity Helium (≥ 99.999%), constant flow at 1.0–1.2 mL/min
Inlet & Injection: Split/Splitless inlet operating at 250–280 °C, split ratio 1:5 to 1:20 (1 μL injection volume)
Method Performance
| Parameter |
Typical Specification |
| Ionization Energy |
Standard 70 eV EI |
| Acquisition Modes |
Selected Ion Monitoring (SIM) & Full Scan (m/z 50–650) |
| Retention Time Precision |
CV < 0.2% across sequence batches |
| MID Analytical Precision |
CV ≤ 1.0% across replicate injections |
| Linear Dynamic Range |
3.5–4 orders of magnitude |
| Derivatization Reproducibility |
CV ≤ 3.0% with internal standard normalization |
Orthogonal High-Resolution LC-MS & NMR Capabilities
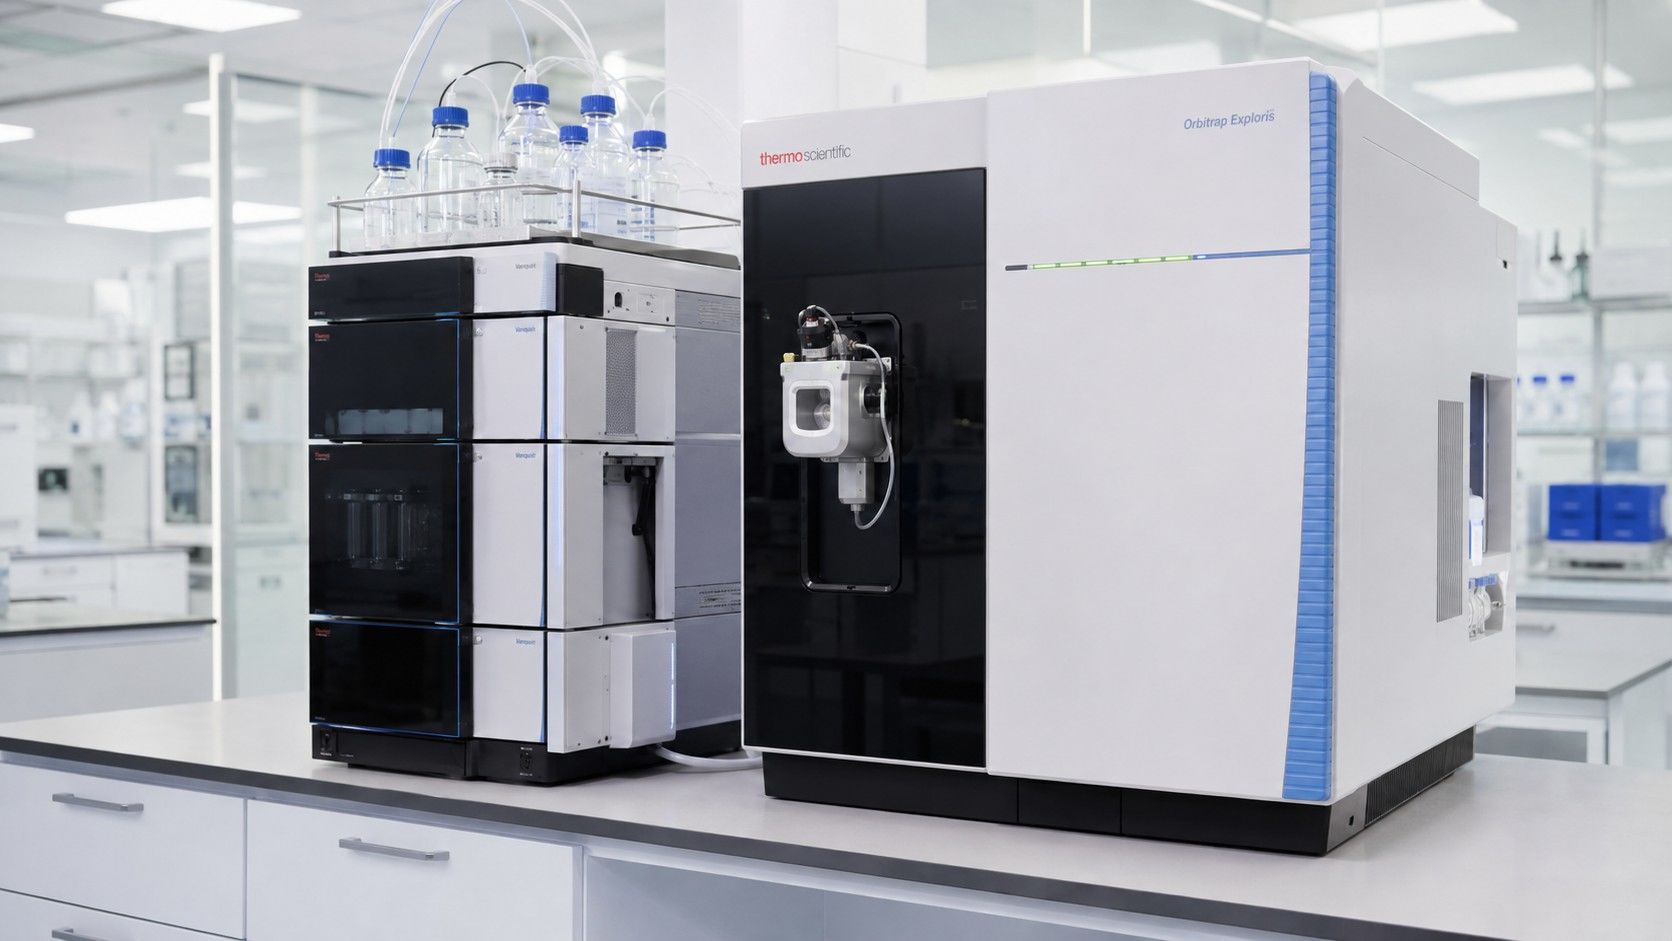
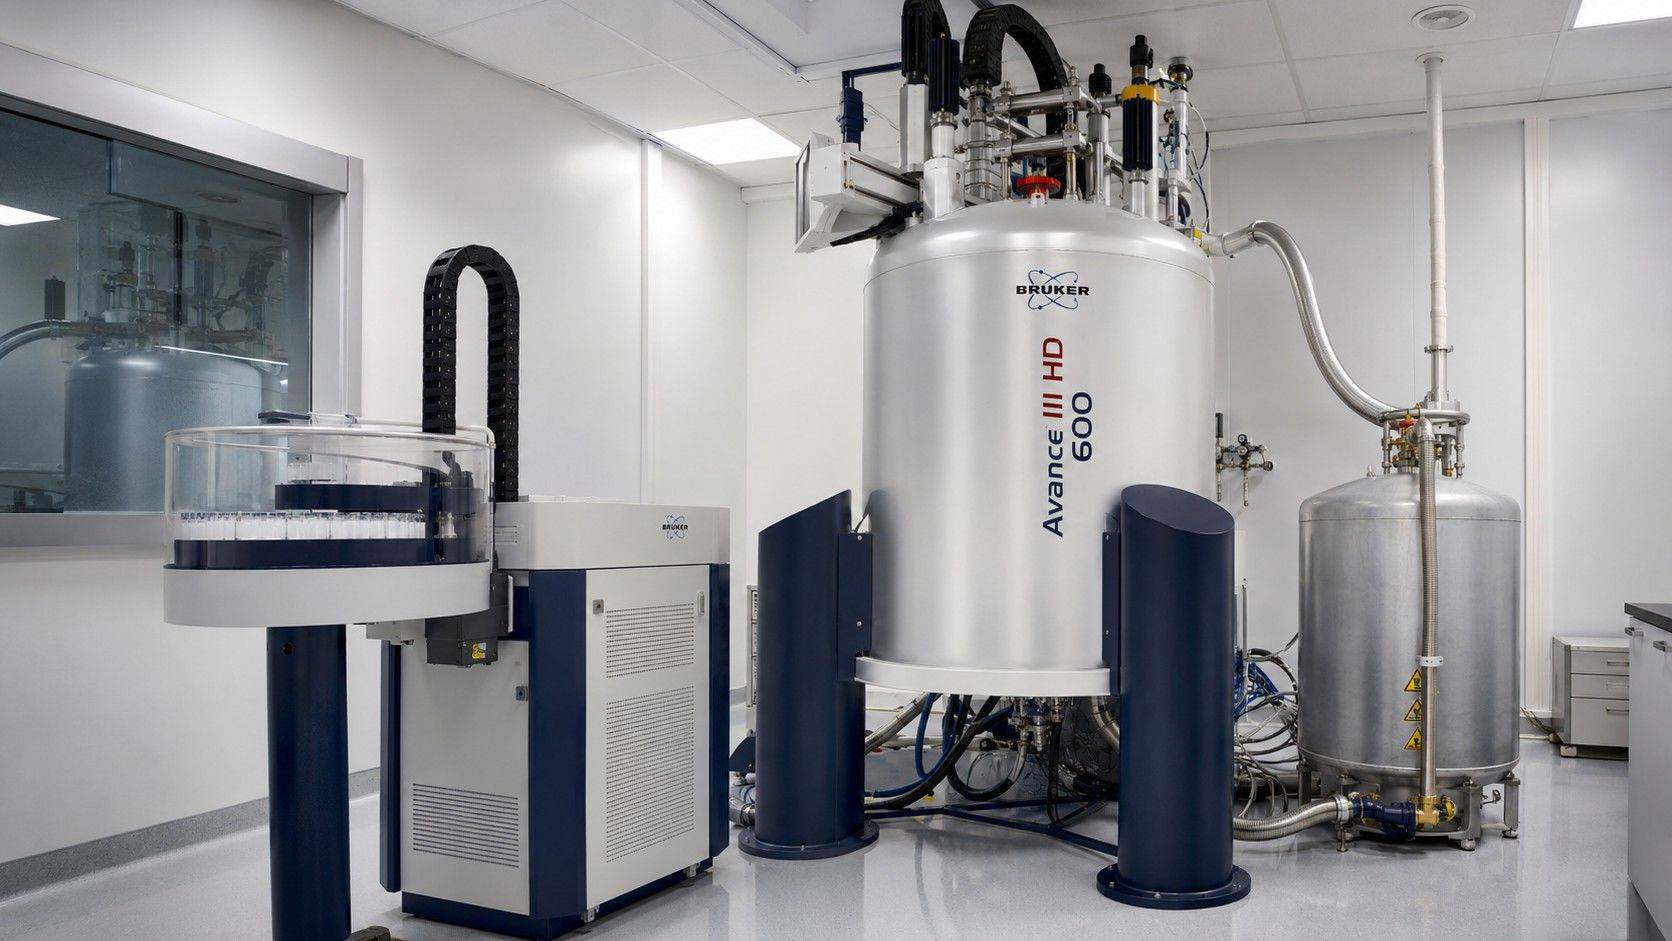
When studying intact non-volatile phosphorylated hexoses (G6P, PEP), nucleotides, and acyl-CoAs that resist GC volatilization, our platform seamlessly integrates complementary NMR-based metabolic flux analysis and LC-Orbitrap MS workflows.
Quality Control & Data Validation
- Derivatization Efficiency Audits: Monitoring conversion completeness and absence of unreacted or degraded species
- Silicone Background & Silyl Tag Deconvolution: Mathematical subtraction of 29Si (4.7%) and 30Si (3.1%) isotopic contributions from MTBSTFA/MSTFA reagents
- Mass Balance & Rate Constraints: Concurrently measured uptake and secretion rates applied as boundary conditions in our central carbon metabolic flux analysis
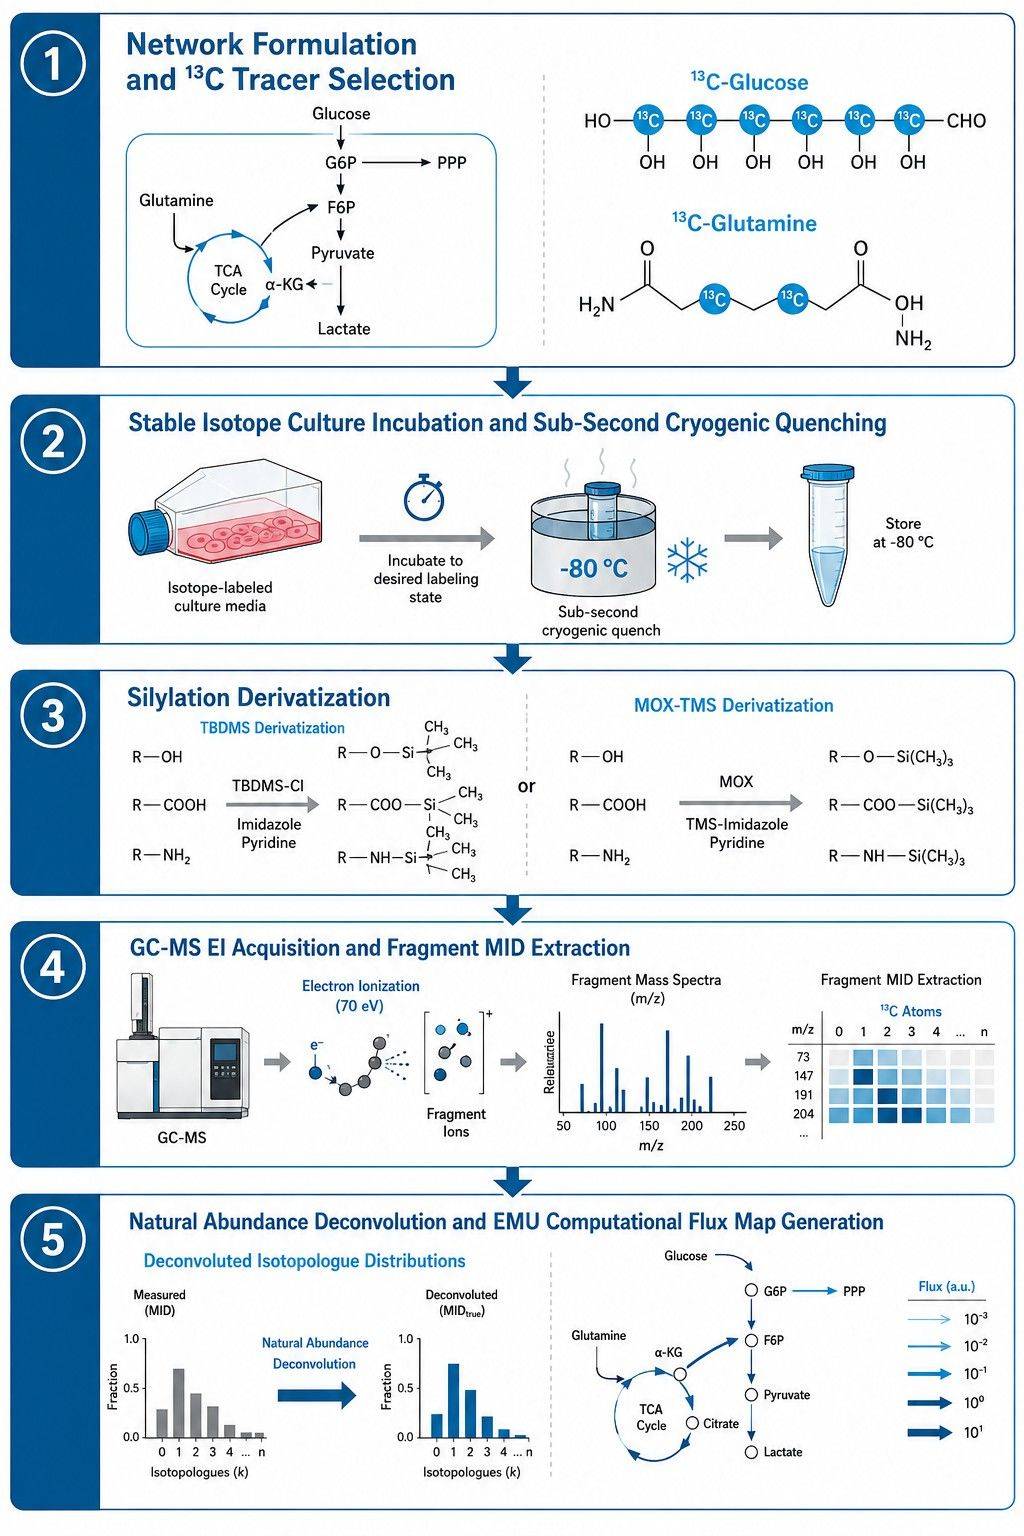
GC-MS Metabolic Flux Analysis Workflow — A Step-by-Step Guide
How to Prepare and Submit Samples for GC-MS-MFA
| Sample Type |
Amount Required |
Preparation & Quenching Instructions |
Storage & Shipping |
| Protein Pellets (Biomass Hydrolysis) |
1–5 mg dry cell pellet |
Centrifuge cultured cells (4 °C, 5 min), wash once with cold saline, decant supernatant, flash-freeze cell pellet in liquid nitrogen for microbial metabolic flux analysis. |
Store at −80 °C; ship on dry ice |
| Free Intracellular Metabolites (Adherent) |
1–10 × 106 cells (60/100 mm dish) |
Rapid medium aspiration (<3 s), wash with ice-cold saline, add pre-cooled (-80 °C) 80:20 MeOH:H2O, scrape on dry ice. Avoid trypsinization in mammalian cell metabolic flux analysis. |
Store at −80 °C; ship on dry ice |
| Free Intracellular Metabolites (Suspension) |
2–10 × 106 cells |
Rapid cold centrifugation (4 °C, <2 min) or direct cold-solvent quenching (-40 °C), followed by cell pellet extraction. |
Store at −80 °C; ship on dry ice |
| Microbial Broth / Fermentation Filtrate |
2–10 mg dry cell weight |
Fast vacuum filtration (<2 s) with immediate liquid nitrogen flash freezing of the filter membrane. Retain supernatant for extracellular rate measurements. |
Store at −80 °C; ship on dry ice |
| Plant & Animal Tissues |
20–100 mg wet weight |
Instant freeze-clamping in liquid nitrogen upon excision, followed by cryogenic pulverization without thawing for plant metabolic flux analysis. |
Store at −80 °C; ship on dry ice |
| Conditioned Culture Supernatant |
≥ 200 μL |
Collect from matched labeling time points, centrifuge (10,000 × g, 5 min) to remove cellular debris, aliquot for extracellular glucose, lactate, and amino acid consumption/secretion rates. |
Store at −80 °C; ship on dry ice |
Notes
- Always submit parallel uncultured medium blanks and time-matched conditioned supernatants for boundary rate quantification
- Avoid using plastic tubes or tips with leaching plasticizers that interfere with GC-MS chromatographic baseline
- Maintain an uninterrupted cold chain (−80 °C or dry ice) during sample storage and transport
Deliverables: What You Receive from GC-MS-Based MFA
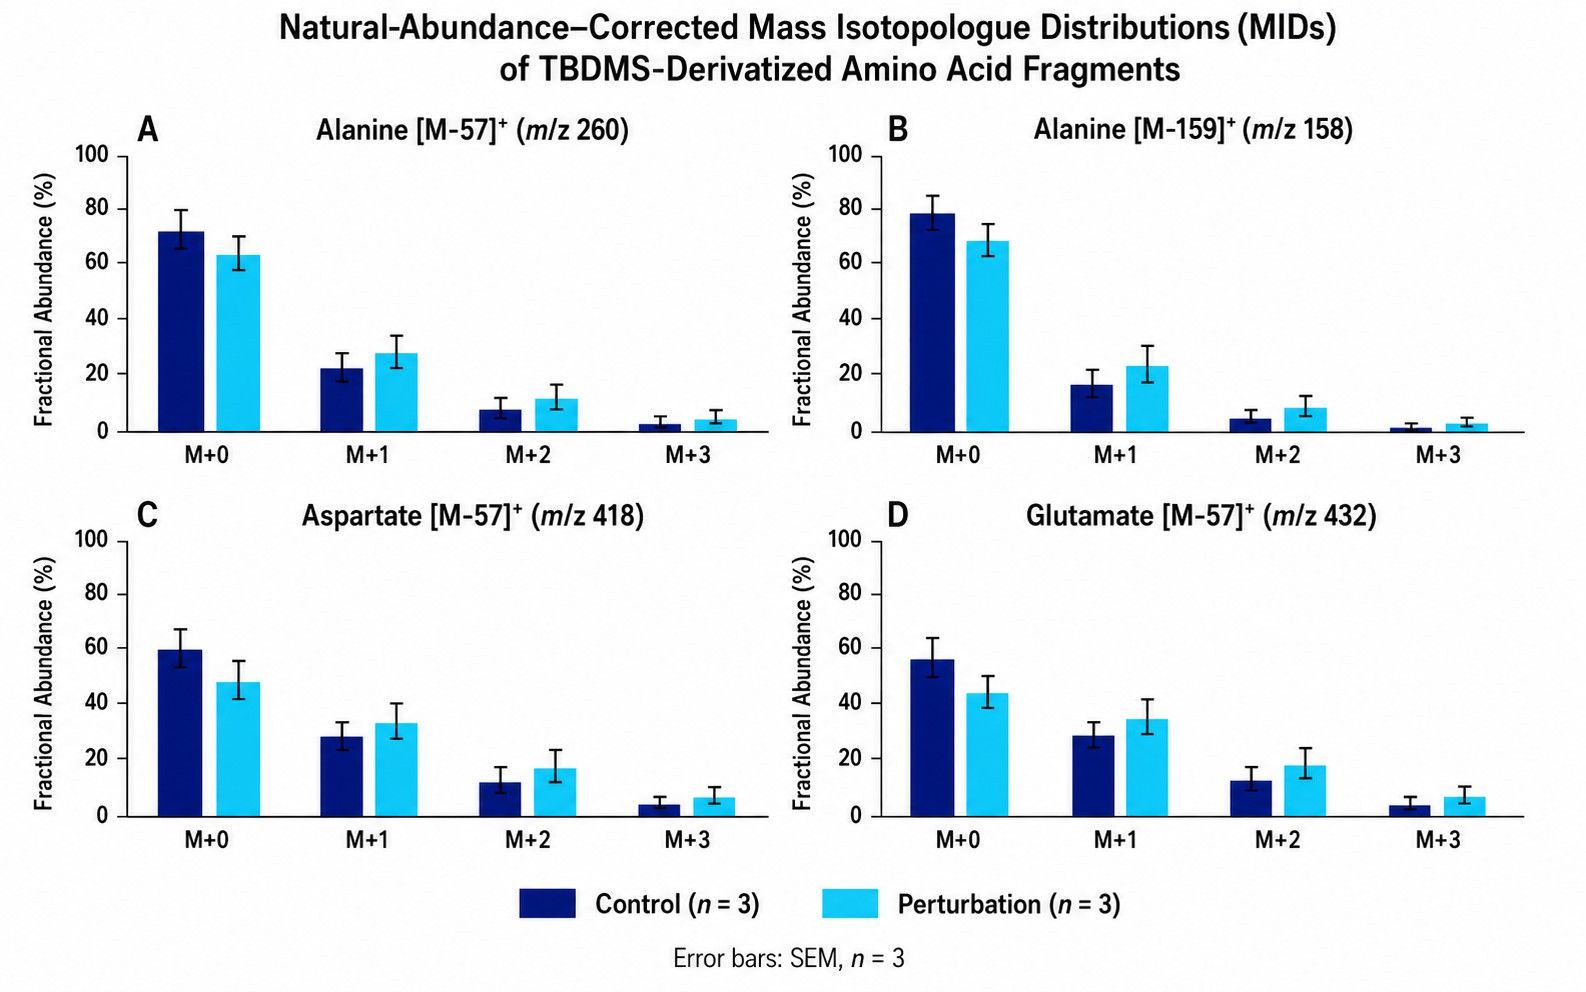
- Deconvoluted Fragment MID Matrix: Natural-abundance-corrected fractional labeling (M+0 to M+n) for [M-57]+, [M-159]+, and [M-85]+ fragment ions across amino acids and organic acids (.csv / Excel).
- Extracellular Consumption & Secretion Rates: Quantitative boundary uptake and production rates (mmol/gDW/h or nmol/106 cells/h).
- Reaction Network & EMU Model Files: Complete stoichiometric equations, carbon atom transition matrices, and executable project files (.xml / INCA / 13CFLUX2).
- Estimated Metabolic Flux Values & Confidence Intervals: Calculated net (vnet) and exchange (vxch) fluxes with non-linear 95% profile likelihood confidence intervals.
- Statistical Diagnostics & Residuals: Chi-square (χ²) goodness-of-fit statistics, sum of squared residuals (SSR), and measured vs. simulated MID correlation plots.
- Publication-Ready Pathway Flux Maps: High-resolution vector graphics (PDF/SVG) illustrating central carbon routing with flux-scaled arrow widths, supported by comprehensive fluxomics data analysis.
Applications of GC-MS-Based Metabolic Flux Analysis
Our GC-MS metabolic flux analysis service supports research across academic, biotechnology, and industrial bioprocess programs:
Targeted Metabolomic Profiling Resolves Neonate-Specific TCA Cycle and Ketogenesis Perturbations Induced by Volatile Anesthetics
Background
Volatile anesthetics (VAs, including isoflurane and sevoflurane) are widely utilized in pediatric surgery, yet their off-target metabolic effects in neonates remain incompletely understood. Neonatal mammals depend critically on milk-derived fatty acids and hepatic ketogenesis to generate circulating β-hydroxybutyrate (β-HB), supplying over 25% of basal energy and supporting rapid brain development. When exposed to sub-anesthetic doses of volatile anesthetics, neonates experience rapid metabolic disruption and ketone depletion.
Challenge:
Determine whether volatile anesthetics acutely impair mitochondrial fatty acid oxidation, induce TCA cycle cataplerosis, or alter intermediate metabolite pools in neonatal liver and plasma compared to adult controls.
Findings (from the published study)
Statistical goodness-of-fit diagnostic plot showing measured versus simulated GC-MS MID correlation and weighted residual distribution with chi-square threshold.
- Rapid Hepatic Ketone Depletion: Exposure to 1% and 0.2% isoflurane for 30 minutes rapidly and potently depleted β-hydroxybutyrate (β-HB) in whole liver and plasma of P7 neonatal mice, demonstrating an acute disruption uncoupled from sedation.
- TCA Cycle Cataplerosis & Citrate Accumulation: Targeted metabolomics revealed marked TCA cycle backup, evidenced by a ~100% accumulation of hepatic citrate and isocitrate, elevated blood lactate, and cataplerotic transamination into alanine and aspartate pools.
- ACC Activation & CPT1 Inhibition: Citrate accumulation combined with acetyl-CoA availability stimulated acetyl-CoA carboxylase (ACC), producing malonyl-CoA and inhibiting carnitine palmitoyltransferase 1 (CPT1), thereby blocking mitochondrial fatty acid import and depleting acylcarnitines.
- Neonate-Specific Metabolic Sensitivity: Unlike neonatal animals, adult mice demonstrated resistance to malonyl-CoA-mediated fatty acid oxidation shutdown, confirming an age-specific metabolic vulnerability to volatile anesthetics.
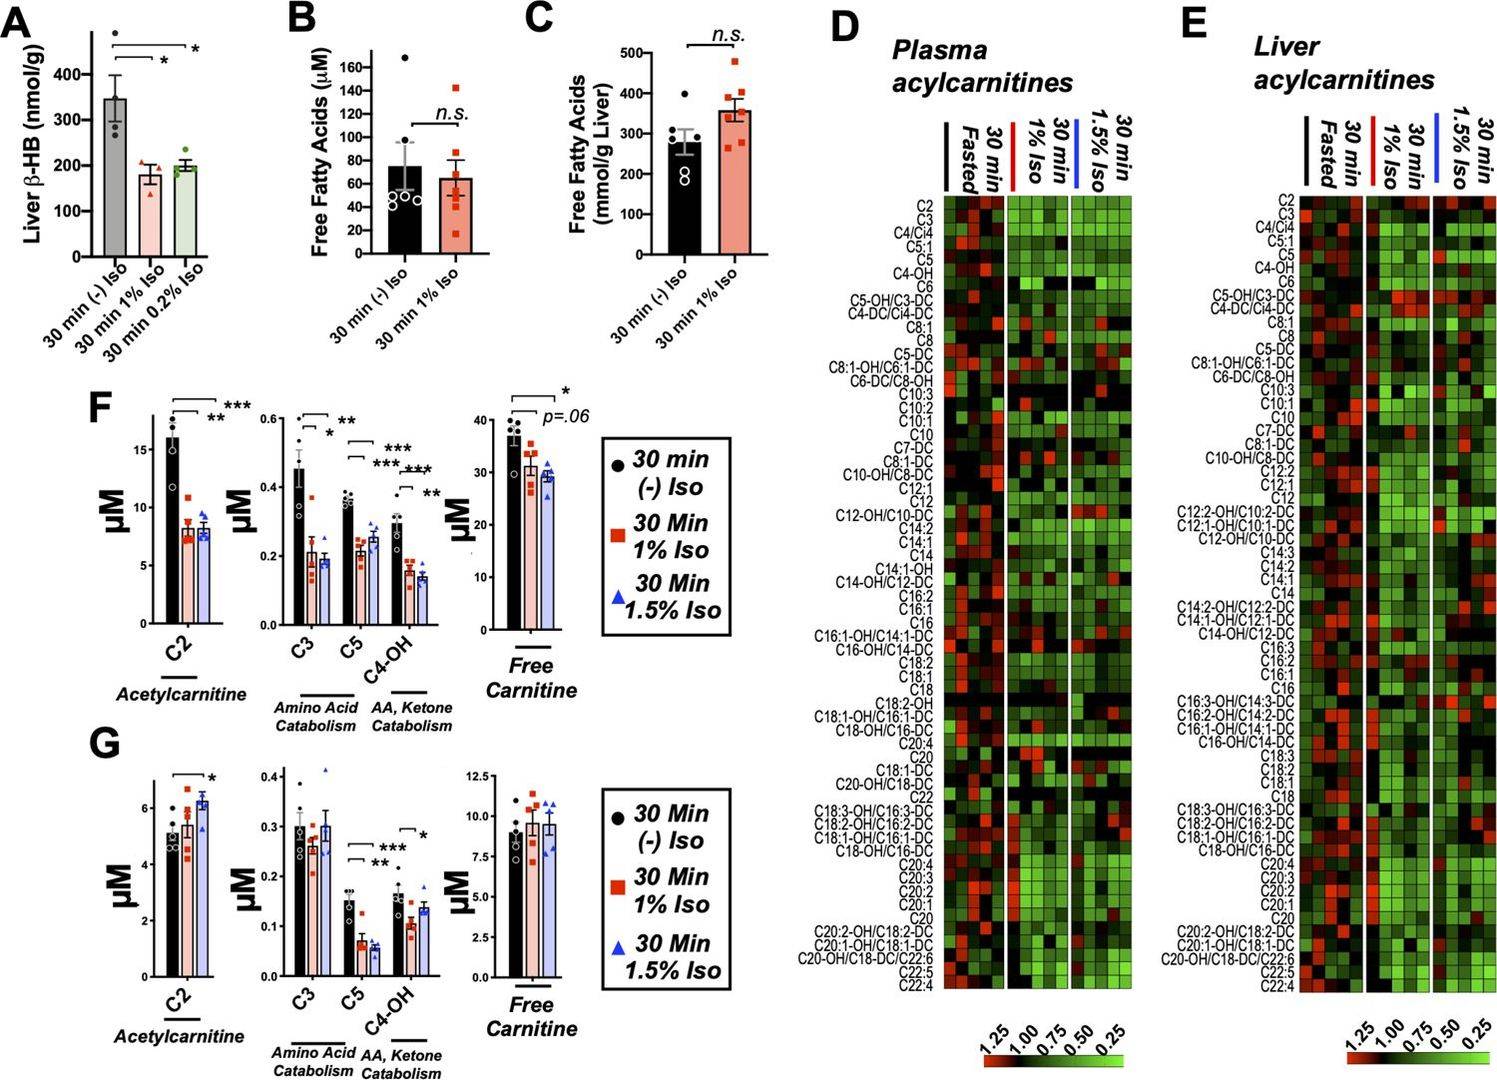 Figure 4. Targeted metabolomic analysis of whole liver β-HB and fatty acid intermediate depletion in isoflurane-exposed neonates
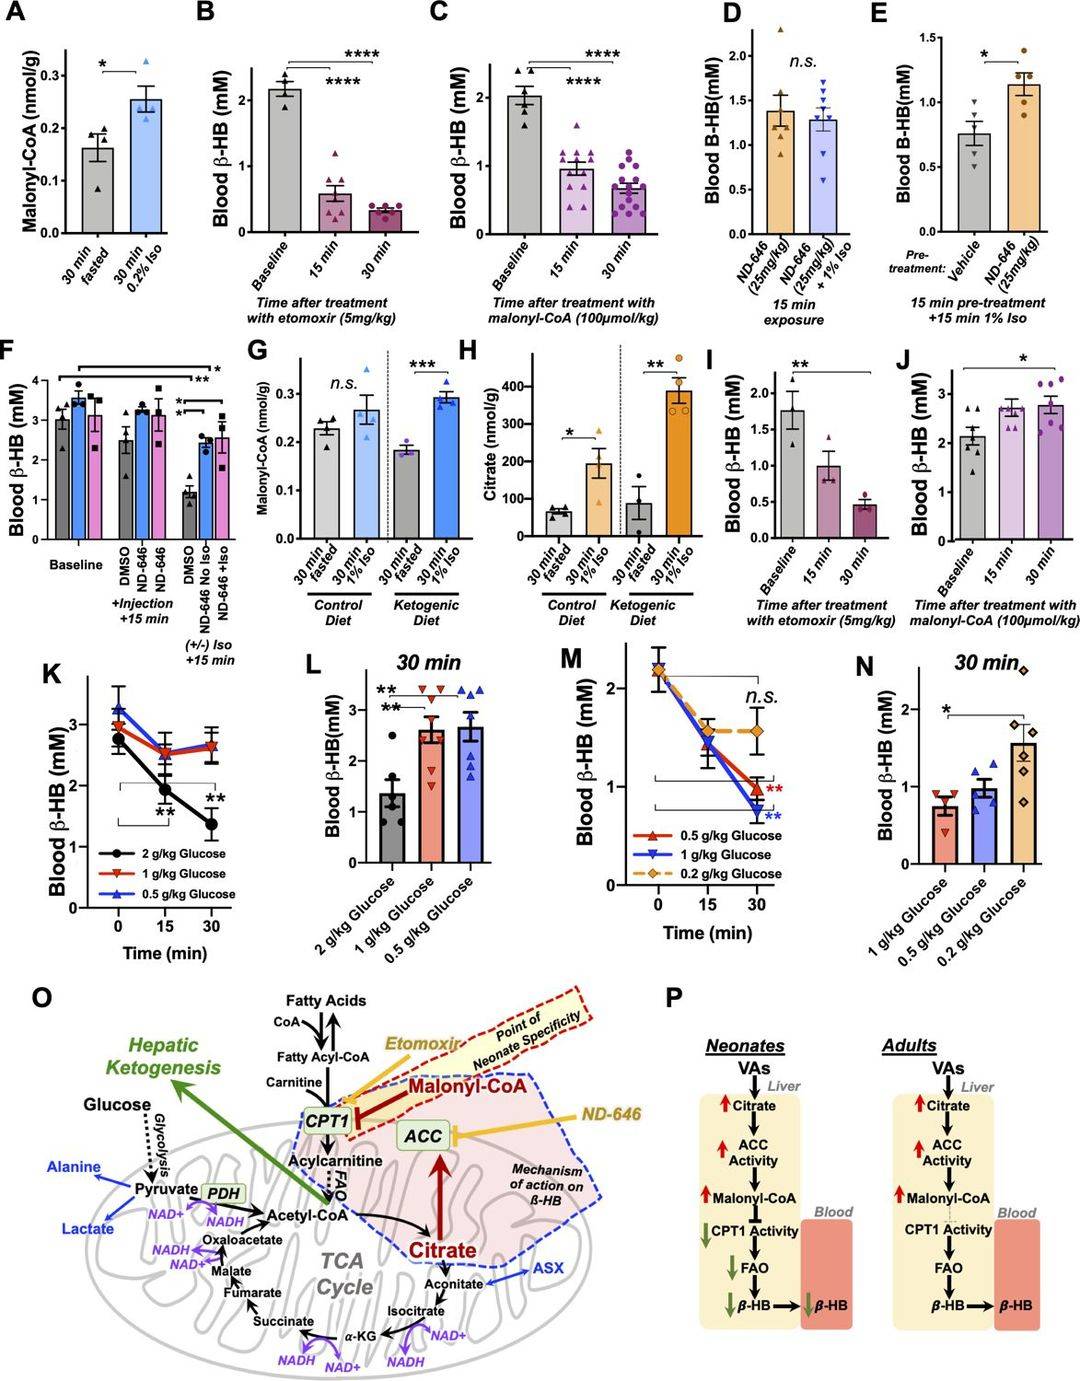 Figure 5. Schematic model of mitochondrial glucose and fatty acid metabolism, TCA cycle cataplerosis, and citrate-driven ACC regulation
Process Insight
The study illustrates how high-precision quantitative metabolomics of TCA organic acids, amino acids, and acylcarnitines provides the empirical foundation to resolve pathway-level regulatory rheostats, demonstrating that mitochondrial intermediate accumulation can trigger feedback inhibition of upstream fatty acid oxidation.
Where Our GC-MS-Based Metabolic Flux Analysis Service Fits
Creative Proteomics supported the metabolomics workflow for this investigation, providing end-to-end analytical and data processing capabilities:
- Targeted Organic Acid & TCA Profiling: Precise quantification of TCA cycle intermediates, pyruvate, lactate, and ketone bodies across liver tissues and plasma.
- Acylcarnitine & Amino Acid Analysis: Quantitative profiling of free carnitine, acetylcarnitine (C2), and acylcarnitine species reflecting mitochondrial transport status.
- Rigorous Method Validation & Quality Control: High-reproducibility batch QC ensuring robust statistical distinction across age groups and anesthetic exposure conditions.
Reference
- Stokes, J., Freed, A., Bornstein, R., Su, K. N., Snell, J., Pan, A., Liu, G. X., & Johnson, S. C. Mechanisms underlying neonate-specific metabolic effects of volatile anesthetics. eLife. 2021;10:e65400.
Mechanisms underlying neonate-specific metabolic effects of volatile anesthetics
Stokes, J., Freed, A., Bornstein, R., Su, K. N., Snell, J., Pan, A., Liu, G. X., & Johnson, S. C.
Journal: eLife
Year: 2021
DOI: https://doi.org/10.7554/eLife.65400
B cell-intrinsic epigenetic modulation of antibody responses by dietary fiber-derived short-chain fatty acids
Sanchez, H. N., Moroney, J. B., Gan, H., Shen, T., Im, J. L., Li, T., ... & Casali, P.
Journal: Nature Communications
Year: 2020
DOI: https://doi.org/10.1038/s41467-019-13603-6
Impaired ketogenesis ties metabolism to T cell dysfunction in COVID-19
Karagiannis, F., Peukert, K., Surace, L., Michla, M., Nikolka, F., Fox, M., ... & Kurts, C.
Journal: Nature
Year: 2022
DOI: https://doi.org/10.1038/s41586-022-05128-8
Elongating porcine conceptuses can utilize glutaminolysis as an anaplerotic pathway to maintain the TCA cycle
Seo, H., Kramer, A. C., McLendon, B. A., Fang, X., Satterfield, M. C., Wu, G., ... & Johnson, G. A.
Journal: Biology of Reproduction
Year: 2022
DOI: https://doi.org/10.1093/biolre/ioac097
Hierarchical glycolytic pathways control the carbohydrate utilization regulator in human gut Bacteroides
Kabonick, S. G., Verma, K., Modesto, J. L., Pearce, V. H., Winokur, K. M., Groisman, E. A., & Townsend, G. E.
Journal: Nature Communications
Year: 2025
DOI: https://doi.org/10.1038/s41467-025-59704-3
Macrophage-Associated Lipin-1 Promotes beta-Oxidation in Response to Proresolving Stimuli
Schilke, R. M., Blackburn, C. M. R., Rao, S., Krzywanski, D. M., Finck, B. N., & Woolard, M. D.
Journal: ImmunoHorizons
Year: 2020
DOI: https://doi.org/10.4049/immunohorizons.2000047
The role of carnitine palmitoyl transferase 2 in the progression of salt-sensitive hypertension
Dissanayake, L. V., Smith, B. A., Zietara, A., Levchenko, V., Lowe, M., Kravtsova, O., ... & Staruschenko, A.
Journal: American Journal of Physiology-Cell Physiology
Year: 2025
DOI: https://doi.org/10.1152/ajpcell.00485.2025


 Contact Us



