

Plant Metabolomics Experimental Design: Tissue Selection, Developmental Stage, Diurnal Timing, Quenching, and Normalization
Submit Your InquiryPlant metabolomes change across organs, developmental stages, canopy positions, light–dark cycles, and local growth conditions. In a plant metabolomics study, treatment groups harvested from different leaf positions, at different times of day, or across unbalanced greenhouse benches may separate cleanly for reasons unrelated to the intervention. Neither additional instrument sensitivity nor post hoc normalization can restore a comparison that was confounded at harvest.
A useful sampling specification states which biological unit is represented, which tissue state answers the hypothesis, when and where collection occurs, how quickly metabolism is arrested, and which denominator defines the reported abundance. Developmental, spatial, environmental, and handling variation then becomes controlled, randomized, or explicitly modeled rather than silently absorbed into the treatment contrast.
Experimental Unit and Sampling Hierarchy
The experimental unit is the smallest independently treated biological entity. Depending on the system, it may be an individual plant, a pot, a hydroponic vessel, a field plot, a tree, or a clonal line grown in an independent container. Leaves, roots, fruits, or technical aliquots collected from the same plant are subsamples unless treatment was independently applied at that level.
Confusing a subsample with an independent replicate produces pseudoreplication. Ten leaves taken from one treated plant and ten leaves from one control plant do not support a population-level treatment comparison, even though twenty extracts can be analyzed. The design has one treated and one control experimental unit. Subsampling may improve representation of a heterogeneous organ, but the subsamples must be composited or modeled as nested within the plant or plot.
Before sample collection, define:
- the biological population to which the result should generalize;
- the unit to which genotype, treatment, irrigation, inoculation, or stress is independently applied;
- whether multiple tissues from one unit will be analyzed separately, composited, or treated as repeated observations;
- the primary treatment contrast and any genotype-by-treatment, tissue-by-treatment, or time-by-treatment interaction;
- the number of independent units required per comparison based on expected variance and minimum relevant effect;
- the blocking variables that represent real growth gradients.
The intended claim determines the sampling scheme. A mechanism study may require a specific cell layer or developmental zone. A crop-composition study may require a market-relevant organ at a defined maturity index. A stress-response study may require both an early signaling time point and a later acclimation time point. A biomarker intended to predict yield should be sampled at a stage early enough to support a decision and then validated across independent environments.
| Biological question | Appropriate experimental unit | Sampling specification | Common design error |
|---|---|---|---|
| Does a treatment alter leaf metabolism? | Independently treated plant or pot | Defined leaf number, position, age, side, and time after treatment | Treating multiple leaves from one plant as independent replicates |
| How does root metabolism respond to nutrient limitation? | Independent vessel, pot, or field plot | Root class, depth, washing protocol, rhizosphere handling, and harvest order | Pooling fine and structural roots without controlling soil contamination |
| Which fruit metabolites distinguish maturity stages? | Plant, plot, or independently sampled fruit unit as justified | Cultivar, fruit position, maturity index, days after anthesis, and tissue layer | Using calendar date as a substitute for physiological maturity |
| Can an early metabolite profile predict yield? | Independent genotype-by-environment unit | Early-stage tissue plus later outcome from the same unit | Selecting markers and evaluating prediction in the same plants |
| What is the metabolic response over time? | Independent plant at each destructive time point | Time-of-day matched harvests and a contemporaneous control series | Comparing sequential treatment harvests with one baseline control |
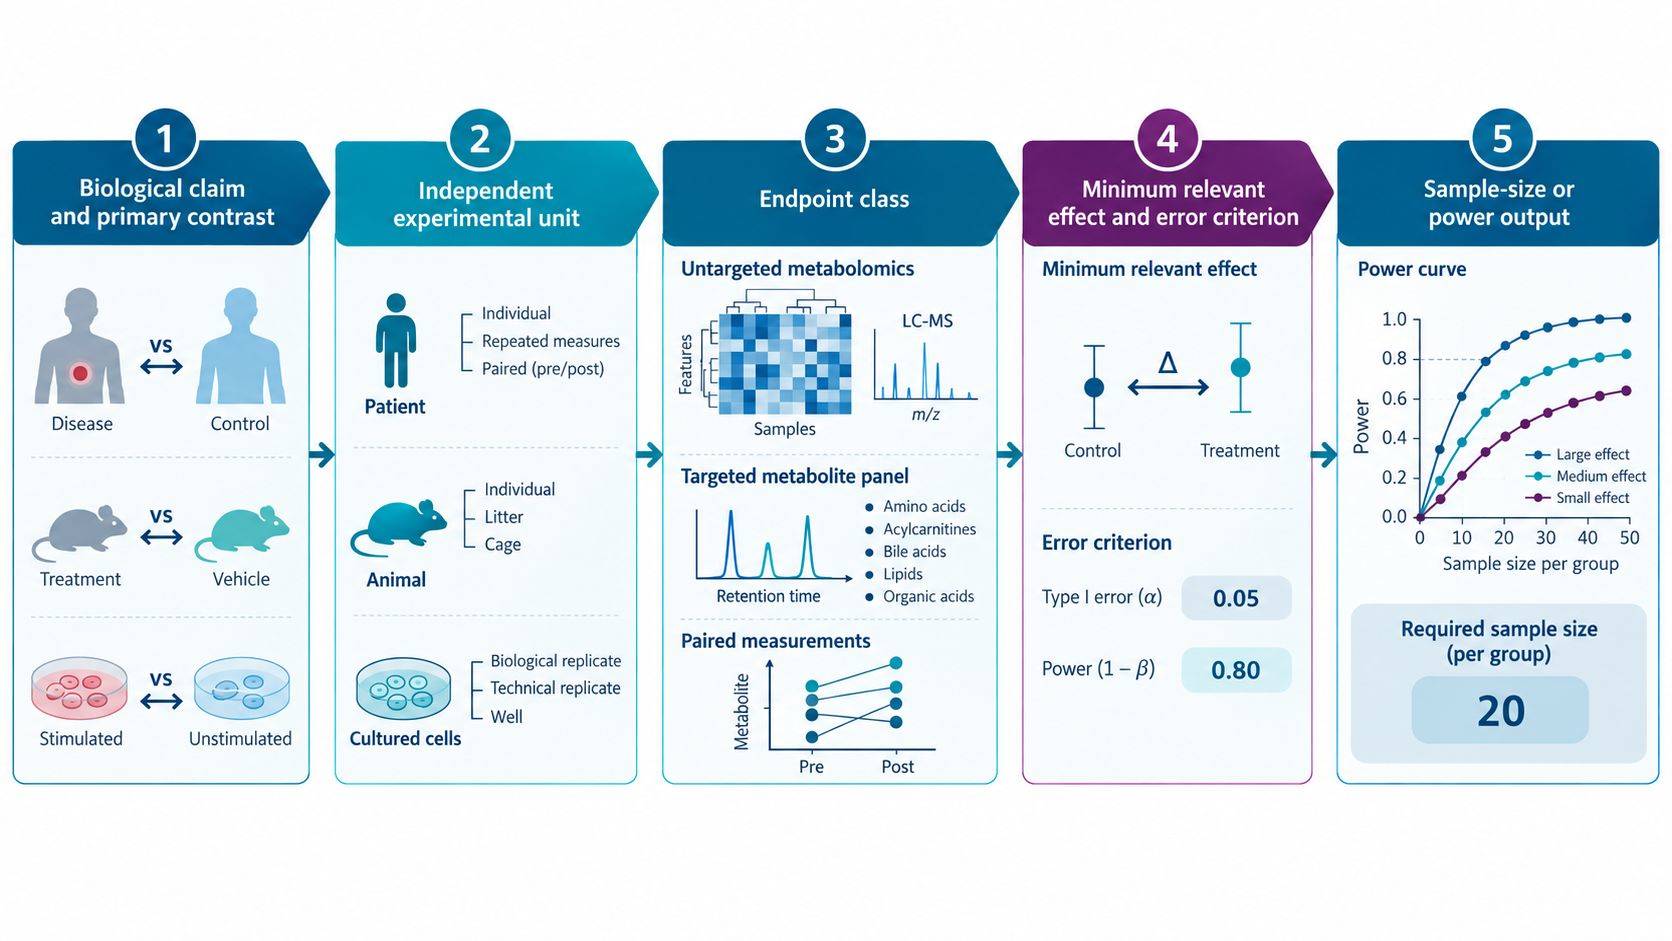 Figure 1. A valid plant metabolomics design separates independent biological units from nested subsamples and analytical aliquots. Tissue subsampling can improve representation, but it does not increase the number of independently treated plants or plots.
Tissue Definition and Spatial Heterogeneity
"Leaf," "root," and "fruit" are not sufficiently precise sample definitions. Source and sink status, vascular proximity, exposure to light, tissue age, and cell-type composition can strongly alter metabolite abundance. The same treatment can also redistribute biomass among tissues, changing the composition of a bulk sample even when metabolism within each tissue type is unchanged.
Leaves and Shoots
Leaf sampling should specify node or leaf number, developmental status, canopy position, exposed surface, and whether petiole or midrib is included. Young expanding leaves differ from fully expanded source leaves in carbon allocation, amino acid demand, and defense chemistry. Sun and shade leaves can differ even on the same plant. For rosettes, sampling the entire aerial portion answers a different question from sampling a defined leaf rank.
When individual leaves are too small for the required extraction mass, a composite may be necessary. The pooling rule should be fixed before collection: for example, the same leaf ranks from a defined number of plants per biological replicate. Pooling reduces information about plant-to-plant variability and should not be used merely to create sufficient mass without acknowledging the change in inference.
Roots and Rhizosphere-Associated Material
Root systems contain metabolically distinct zones and orders. Fine absorptive roots, older transport roots, meristems, and nodulated tissue should not be combined without a biological reason. Washing removes soil and external metabolites but can also wound tissue, alter oxygen exposure, and leach polar compounds. The wash solution, temperature, duration, blotting procedure, and interval to quenching must be standardized.
If both root tissue and rhizosphere chemistry are relevant, collect them as distinct fractions with a prespecified sequence. A bulk "root sample" contaminated by variable soil or nutrient solution makes it difficult to determine whether a detected compound was intracellular, surface-associated, microbial, or environmental.
Fruits, Seeds, and Storage Organs
Developmental gradients across pericarp, peel, pulp, seed, embryo, endosperm, and vascular regions can dominate the profile. Maturity should be defined using physiological criteria appropriate to the species—such as days after anthesis, color index, firmness, soluble solids, moisture, or seed developmental stage—rather than visual judgment alone. If the commercial or biological question concerns the whole edible organ, the homogenization plan must ensure that each replicate contains a comparable proportion of component tissues.
Developmental Stage and Harvest Timing
Plant age measured in days is not always equivalent to developmental stage. Genotype, temperature, photoperiod, nutrient status, and stress can accelerate or delay development. A drought-treated plant and its well-watered control may have the same chronological age but different leaf expansion, flowering status, or biomass allocation. Comparing them without recording developmental traits can confound treatment response with developmental delay.
The protocol should define stage using observable criteria and record the actual stage for every experimental unit. Where treatment itself changes development, two complementary comparisons may be informative:
- chronological matching, which compares samples at the same time after treatment or planting;
- developmental matching, which compares samples at an equivalent physiological stage.
These comparisons answer different questions and should not be substituted after data inspection.
Diurnal and Circadian Variation
Sugars, organic acids, amino acids, redox metabolites, hormones, and specialized metabolites can change substantially over a light–dark cycle. Harvest time should be specified relative to lights-on, lights-off, or solar time, not only as a clock time. Field studies should record local sunrise, irradiance, temperature, and recent weather because the same clock time can represent different physiological states across dates.
For a treatment comparison, all groups should be represented throughout the harvest window. Collecting all controls first and all treated plants afterward converts harvest time into a treatment confounder. A balanced alternating or randomized sequence is preferable, with exact collection time recorded for each sample. If collection cannot be completed within a biologically negligible interval, harvest block should be included in the design and analysis.
Time-Course Experiments
Destructive plant sampling usually requires different experimental units at each time point. A time course therefore needs independent plants for every treatment-by-time combination and contemporaneous controls at every time point. The design should distinguish acute responses from acclimation and avoid assuming that repeated destructive harvests came from the same unit.
For large time courses, consider whether every time point needs full plant untargeted metabolomics. A staged design can use a focused pilot to locate the response window, followed by a fully replicated study at the most informative times. This usually gives a cleaner estimate of treatment-by-time effects than spreading limited biological replication across many densely spaced time points.
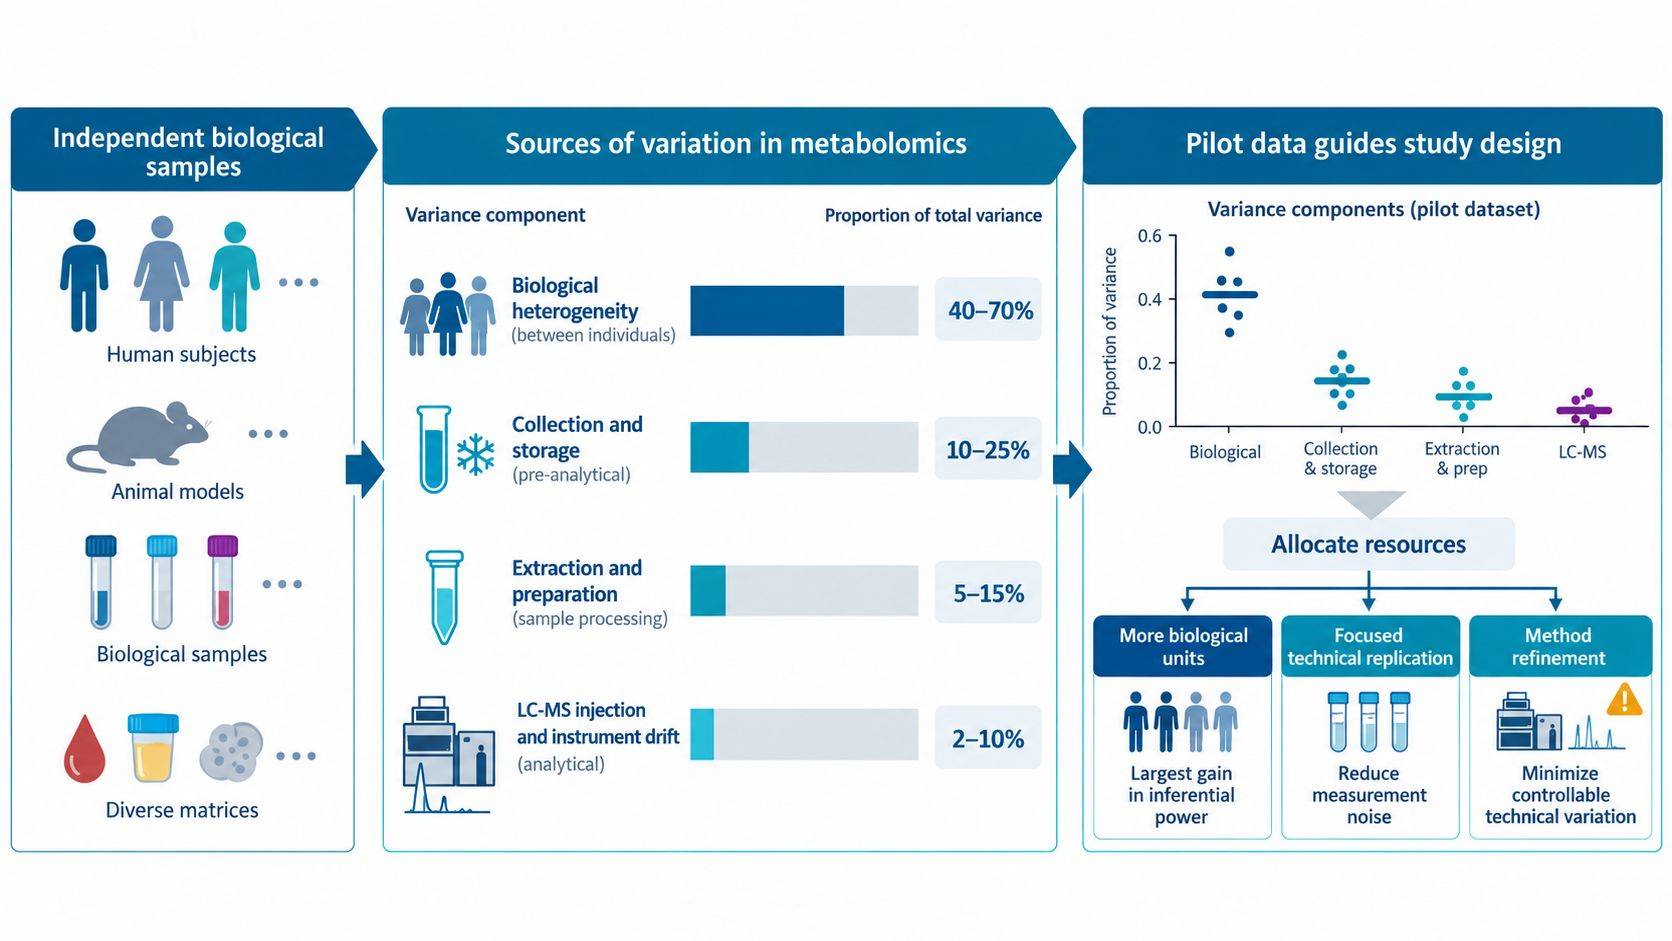 Figure 2. Plant sampling must control both developmental and temporal state. Time points should be defined relative to treatment and the light–dark cycle, with contemporaneous controls and a balanced harvest order that prevents time from becoming a surrogate for treatment.
Environmental Blocking and Growth-Position Effects
Growth chambers, greenhouses, and fields contain spatial gradients. Light intensity, temperature, airflow, humidity, irrigation delivery, soil structure, and pathogen pressure may vary by shelf, bench, tray, row, or plot. Random assignment alone may not be sufficient when a strong known gradient exists. Blocking places each treatment within each relevant region so that local environmental variation can be estimated rather than absorbed into the treatment contrast.
Controlled-Environment Studies
Record chamber, shelf, tray, pot position, illumination, temperature, humidity, watering, nutrient regime, planting date, and any position rotation. Rotating pots can reduce persistent position effects, but the rotation schedule itself should be consistent and documented. If treatments must occupy separate chambers for safety or environmental control, chamber and treatment are confounded unless the experiment is repeated across chambers or treatment assignments are exchanged across independent runs.
Field Studies
Field designs commonly require randomized complete blocks, incomplete blocks, split plots, or spatial models. The experimental unit follows the level at which treatment is applied. If irrigation is applied to whole plots and genotype is assigned within plots, genotype subsamples do not provide independent replication of irrigation. Edge plants, border rows, soil zones, slope, and harvest crew can introduce systematic variation and should be addressed in the layout.
Environmental metadata are not optional background information. They are needed to determine whether a metabolic shift represents the planned intervention, a microenvironmental difference, or a genotype-by-environment response. For multi-site work, protocols, reference materials, and metadata definitions should be harmonized before the first harvest.
Randomization Across Sampling, Preparation, and Acquisition
Biological allocation, harvest order, grinding, weighing, extraction, derivatization, and instrument injection can each introduce batch structure. The sample identifier should be blinded to the operator where practical. Samples from every primary group should be distributed across preparation and acquisition batches, while paired or closely related samples should be arranged so that the comparison remains estimable.
Pooled quality-control material monitors analytical behavior but cannot correct a design in which all controls were extracted on one day and all treated samples on another. Biological balance must be created before processing.
Metabolic Quenching at Harvest
Plant metabolites can turn over within seconds, and tissue excision can change illumination, oxygenation, temperature, and cellular compartmentation. Wounding also activates signaling and defense pathways. The interval from detachment to metabolic quenching is therefore part of the measurement.
For many tissues, a defensible workflow is rapid excision followed immediately by snap-freezing in liquid nitrogen, storage at a constant −80 °C, cryogenic grinding, and weighing of frozen powder without thawing. However, the correct procedure depends on tissue geometry, metabolite class, and study objective. Large, dense, waxy, or woody tissues may not freeze uniformly. Volatile analysis, apoplastic metabolites, and spatial metabolomics may require different handling.
The harvest protocol should specify:
- tools, tissue dimensions, and whether material is cut, punched, peeled, or dissected;
- order of operations and maximum permitted time to quenching;
- temperature and illumination during collection;
- liquid-nitrogen access, pre-cooled containers, and backup procedures;
- whether surface water, soil, or wash solution is removed and how;
- storage temperature, container, duration, and freeze–thaw limits;
- cryogenic homogenization and aliquoting procedure.
Quenching performance should be tested during method development. This is particularly important when a polar metabolites analysis includes high-turnover organic acids, sugar phosphates, nucleotides, or redox intermediates. If slower harvesting changes their abundance, the sampling process is influencing the endpoint. Stable-isotope standards added during extraction can assess recovery, but they cannot reconstruct the in vivo state after an unrecorded delay before quenching.
Harvest-Operator Effects
Large experiments often require several collectors. If one operator collects controls and another collects treated samples, operator and treatment become inseparable. Assign operators across groups, use synchronized harvest stations, train to a shared procedure, and record the collector and timestamps. A small rehearsal can identify whether the planned team can meet the quenching interval before valuable experimental material is harvested.
Biological and Analytical Normalization
Normalization is not a universal cleanup step. It defines the quantity being compared. Peak area per milligram fresh weight, per milligram dry weight, per unit leaf area, per organ, and per cell each answer different biological questions.
Fresh Weight
Fresh weight is practical and often appropriate when tissue hydration is stable across groups. It becomes problematic when drought, salinity, osmotic stress, succulence, or storage alters water content. A metabolite may appear diluted per gram fresh weight simply because the tissue contains more water, or appear concentrated because water was lost without any increase in metabolite amount.
Dry Weight
Dry weight reduces direct sensitivity to water content and may be preferable for water-stress comparisons. Freeze-drying must be validated for the analytes of interest because volatile or unstable metabolites may be lost or transformed. Dry weight can also be distorted by large changes in starch, oil, or other storage compounds. Reporting both fresh and dry mass, or an independent water-content measure, can help separate metabolic regulation from biomass dilution.
Area, Organ, Cell, or Structural Biomass
Leaf area may be relevant when the biological question concerns surface-associated exposure or photosynthetic tissue. Per-organ abundance may be relevant for total resource allocation to a fruit or seed but can obscure concentration changes caused by organ expansion. Cell number or protein may be useful in plant cell culture, although treatment-dependent cell size or protein content can change interpretation. Structural dry mass can be informative when water and storage compounds both vary, but it requires additional measurements.
Internal Standards and Signal Normalization
Stable-isotope or chemically appropriate internal standards correct selected extraction and analytical variability; they do not replace biological normalization by sample amount. In plant targeted metabolomics, internal-standard selection can be evaluated analyte by analyte, whereas total-signal, median, or probabilistic quotient normalization makes assumptions about the behavior of a much larger feature set. Those assumptions may fail during strong developmental transitions or treatments that broadly alter storage metabolism.
| Biological context | Primary denominator to evaluate | Additional measurement | Interpretation risk |
|---|---|---|---|
| Stable hydration, matched tissue stage | Fresh weight | Dry weight on representative material | Small water differences may still affect high-precision comparisons |
| Drought, salinity, or osmotic treatment | Dry weight or structural biomass | Fresh weight, dry weight, and water content | Fresh-weight normalization can convert dehydration into apparent concentration changes |
| Expanding fruit, seed, or storage organ | Per organ plus mass-based concentration | Organ size, water, and storage composition | Concentration and total pool size may move in opposite directions |
| Defined leaf discs or surface exposure | Tissue area with mass recorded | Fresh and/or dry weight | Thickness and anatomy may differ across treatments |
| Suspension cells or callus | Cell number, packed cell volume, protein, or biomass as justified | Viability and cell-size distribution | Treatment may change cell size or viability |
| Untargeted profiling with broad metabolic shifts | Sample-mass normalization plus internal standards | Inspect total-signal assumptions and QC behavior | Global signal normalization can erase a real system-wide shift |
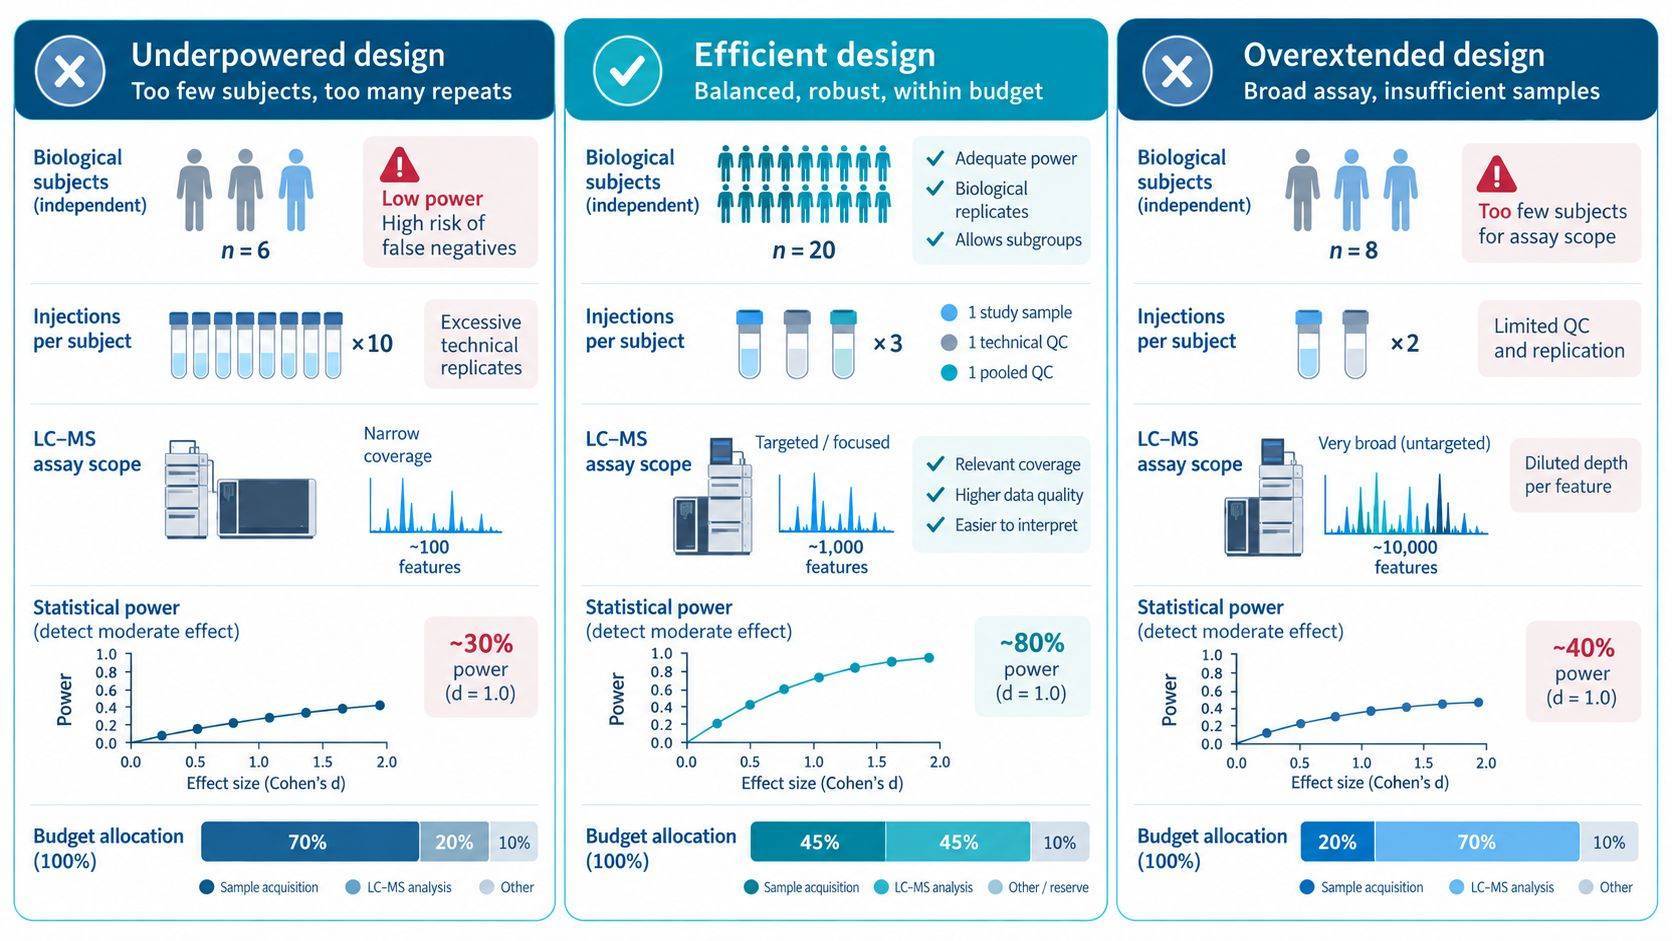 Figure 3. The normalization denominator is part of the biological claim. Water stress, organ expansion, and storage accumulation can cause fresh weight, dry weight, area-based concentration, and total pool size to support different interpretations.
Metadata Traceability and Analytical Quality Control
A plant metabolomics dataset cannot be interpreted reliably without growth and sampling metadata. At minimum, record taxonomy, genotype, tissue and anatomical position, developmental stage, treatment, dose and duration, growth support, location, plot or pot design, light period, temperature, humidity, watering, nutrient regime, establishment date, harvest date and time, harvest method, quenching method, storage, sample mass, and normalization variables.
For untargeted profiling, the analytical design should include solvent blanks, extraction blanks, system-suitability material, pooled study QC where feasible, and internal standards appropriate to the chemistry. A pooled QC assesses repeatability and drift within the study; a long-term reference material supports comparison across batches. Pooling strategy matters because highly heterogeneous tissues or dominant treatment groups can produce a QC that does not represent all study matrices.
Reporting must connect each analytical file to the biological unit and its metadata, document exclusions before and after acquisition, distinguish identified metabolites from putative annotations, and retain both raw and normalized values. When treatment alters hydration or biomass composition, results under alternative defensible denominators reveal whether the interpretation depends on a particular normalization choice.
Frequently Asked Questions (FAQs)
Should all plant samples be harvested at exactly the same clock time?
They should be harvested at the same relevant physiological time, commonly defined relative to lights-on, lights-off, or solar time. When a large experiment cannot be completed quickly, every treatment should be balanced across the harvest window and exact times should be recorded. Harvest block can then be incorporated into the model.
Is pooling leaves from several plants acceptable?
Pooling is acceptable when individual plants do not provide enough material or when the intended sample represents a defined population composite. The pooling rule must be identical across groups, and each pool must be assembled from independently sampled plants. Pooling reduces information about individual variability and does not create additional biological replicates.
Should drought-stress metabolomics be normalized to fresh or dry weight?
Fresh weight alone is often difficult to interpret because the treatment directly changes tissue water content. Dry weight, water content, and sometimes structural biomass should be evaluated. Reporting both fresh- and dry-mass information can show whether an apparent concentration shift reflects metabolite regulation, dehydration, growth dilution, or storage accumulation.
Can leaves be washed before metabolomics analysis?
They can when removal of surface contaminants is essential, but the wash can leach metabolites, create osmotic effects, or delay quenching. The solution, temperature, duration, agitation, blotting, and time to freezing must be validated and applied consistently. Untreated and washed material may be needed during method development.
How many biological replicates are needed?
There is no plant-specific universal number. The requirement depends on the experimental unit, environmental variability, expected effect, number of groups and interactions, and the intended statistical analysis. Field experiments commonly require blocking and more independent units than controlled growth studies. Pilot variance should be obtained under the intended tissue and growth conditions.
Can normalization be chosen after viewing the PCA plot?
Normalization should be justified before outcome-driven inspection because different denominators can change biological interpretation. If more than one denominator is scientifically defensible, define a primary approach and prespecified sensitivity analyses. Selecting the method solely because it produces the clearest group separation risks circular reasoning.
References
- Alseekh, S., et al. (2021). Mass spectrometry-based metabolomics: a guide for annotation, quantification and best reporting practices. Nature Methods, 18, 747–756. doi:10.1038/s41592-021-01197-1
- Rodrigues, A. M., et al. (2019). Experimental design and sample preparation in forest tree metabolomics. Metabolites, 9(12), 285. doi:10.3390/metabo9120285
- Jorge, T. F., Rodrigues, J. A., Caldana, C., Schmidt, R., van Dongen, J. T., Thomas-Oates, J., & António, C. (2016). Mass spectrometry as a quantitative tool in plant metabolomics. Philosophical Transactions of the Royal Society A, 374, 20150370. doi:10.1098/rsta.2015.0370
- Fernie, A. R., et al. (2011). Recommendations for reporting metabolite data. The Plant Cell, 23(7), 2477–2482. doi:10.1105/tpc.111.086272
- Fiehn, O., et al. (2008). Quality control for plant metabolomics: reporting MSI-compliant studies. The Plant Journal, 53(4), 691–704. doi:10.1111/j.1365-313X.2007.03387.x
- Allwood, J. W., et al. (2021). Key aspects of plant metabolomics and metabolite profiling. Methods in Molecular Biology, 2291, 1–39. doi:10.1007/978-1-0716-1335-2_1
- Stitt, M., & Fernie, A. R. (2003). From measurements of metabolites to metabolomics: an 'on the fly' perspective illustrated by recent studies of carbon-nitrogen interactions. Current Opinion in Biotechnology, 14(2), 136–144. doi:10.1016/S0958-1669(03)00023-500023-5)
- Poorter, H., et al. (2012). The art of growing plants for experimental purposes: a practical guide for the plant biologist. Functional Plant Biology, 39(11), 821–838. doi:10.1071/FP12028
- Génard, M., et al. (2014). Metabolic studies in plant organs: don't forget dilution by growth. Frontiers in Plant Science, 5, 85. doi:10.3389/fpls.2014.00085
- Metabolomics Workbench. (2025). mwTab file format specification and plant treatment metadata fields. Metabolomics Workbench mwTab specification

 Contact Us


