

Tissue Metabolomics Normalization: Wet Weight, Protein, DNA, and Extraction Recovery Controls
Submit Your InquiryTissue metabolomics results are often reported “per milligram of tissue,” but a milligram is not always the same biological denominator. Edema changes water mass, adipose expansion changes lipid-to-cell ratios, fibrosis changes extracellular matrix content, and necrosis lowers viable cellular material. Protein and DNA can reduce some of these effects, yet both can also become part of the biological phenotype. Normalization must therefore be selected for the claim, tissue, and perturbation rather than applied as a universal post-processing step.
Four operations must remain separate in tissue metabolomics: standardizing tissue input, expressing abundance relative to biological material, correcting extraction and ionization behavior, and correcting analytical drift. Each requires a different measurement or control.
Tissue Metabolomics Normalization Objectives
The denominator defines the meaning of the reported value. Metabolite amount per milligram wet tissue describes the sampled tissue bulk. Amount per microgram protein approximates abundance relative to protein-rich biomass. Amount per microgram DNA emphasizes nucleated cellular material. An internal-standard ratio corrects part of the analytical process but does not say how much tissue or how many cells were analyzed.
Before extraction, the study should decide whether the intended interpretation is:
- concentration within a defined mass of tissue;
- metabolite content per cellular biomass;
- total content within an anatomical region or organ;
- abundance per estimated cell or nucleus;
- targeted analyte concentration corrected for recovery and matrix effect;
- relative feature intensity after instrument-drift correction.
These outputs can move in opposite directions. A liver may enlarge while metabolite concentration per milligram falls, yet total organ content rises. A tumor may accumulate necrotic fluid, reducing metabolite amount per wet weight without a proportional change in viable tumor cells. A treatment may lower protein synthesis, making protein-normalized metabolites appear higher even when the amount per tissue sample is unchanged.
For projects that require comparison across organs, disease stages, or strongly remodeled tissues, tissue metabolomics should retain the primary measured quantities rather than deliver only one normalized matrix. Wet weight, protein or DNA, internal-standard response, and relevant histology are complementary evidence.
| Normalization objective | Measured factor | Variation addressed | Variation not addressed |
|---|---|---|---|
| Standardize starting input | Wet or dry tissue mass | Gross differences in sampled material | Cellularity, water, fibrosis, extraction recovery, ion suppression |
| Express per biological biomass | Protein, DNA, cell/nucleus estimate | Some differences in cellular material | Analyte-specific recovery and LC-MS response |
| Correct sample preparation and ionization | Stable-isotope internal standard | Recovery, injection, and matrix effect to the extent the standard matches the analyte | Biological input and tissue composition |
| Correct time-dependent analytical drift | Pooled-QC or reference-sample model | Batch and run-order signal changes | Sampling, extraction loss, biological denominator |
Wet-Weight Normalization and Tissue Composition
Wet weight is direct, inexpensive, and compatible with rapid frozen-tissue workflows. It is often the most transparent denominator when samples come from the same anatomical region, have similar water and cellular composition, and are weighed consistently before extraction. It also enables extraction solvent to be added at a controlled volume-to-mass ratio.
Its apparent simplicity hides several sources of error. Surface buffer, blood, saline from rinsing, frost, and thawed fluid all add mass. Very small frozen pieces can gain moisture during weighing. Tissue pieces from the edge and core of a lesion may contain different proportions of viable cells, necrosis, connective tissue, and blood. A nominal 20 mg from each sample does not establish equal biological material if the tissue architecture differs.
Wet-weight normalization is particularly vulnerable when the phenotype changes hydration or composition:
- edema, inflammation, and congestion increase water or blood content;
- steatosis and adipose tissue vary in neutral lipid and adipocyte size;
- fibrosis increases collagen-rich extracellular material;
- tumors vary in stromal, immune, necrotic, and viable-cell fractions;
- skeletal muscle can vary in intramuscular fat and connective tissue;
- plant tissues vary in water, starch, fiber, vacuole size, and cell-wall content.
These cases do not make wet weight invalid. They change what “per milligram” represents. If tissue bulk is the biological endpoint, wet weight may be exactly appropriate. If the claim concerns metabolism of viable parenchymal cells, a second measure of cellularity or composition is needed.
Wet Weight, Dry Weight, and Total Organ Content
Dry weight reduces variation from water content but introduces additional handling. Freeze-drying must occur after the metabolic state has been arrested, and the procedure can affect volatile compounds or complicate later extraction if not qualified. Dry weight also retains extracellular matrix, mineral, glycogen, and storage material, so it is not synonymous with cell number.
Total organ content answers a different question from concentration. It can be estimated by multiplying a validated concentration by organ mass when sampling is representative. This can be informative in hypertrophy, atrophy, or storage phenotypes, but it assumes that the analyzed piece represents the entire organ or defined region. Heterogeneous tumors, zonated liver, cortex and medulla, or infarcted myocardium may require region-specific sampling rather than a whole-organ multiplication.
Protein-Based Normalization: Biomass Adjustment and Biological Confounding
Total protein is attractive because it can be measured from the insoluble material remaining after metabolite extraction or from a parallel aliquot. In protein-rich tissues with similar cell composition, it can reduce variation caused by imprecise weighing or extracellular fluid. A recent brain multi-omics study reported lower variation when tissue input was standardized by weight and metabolite/lipid fractions were then adjusted using protein measured after extraction. A heart metabolomics workflow likewise showed that an insoluble protein-derived amino acid measure improved precision relative to tissue weight in that specific method.
Those findings support tissue-specific validation, not a rule that protein is always superior. Protein content can change with hypertrophy, atrophy, fibrosis, secretory load, cell-type composition, or inhibition of translation. Adipose tissue contains relatively little protein per unit mass; fibrotic tissue can contain abundant extracellular protein unrelated to metabolically active cells. If treatment directly alters proteostasis, dividing by protein may partially remove the phenotype.
The assay itself also matters. Organic solvent precipitates protein, residual detergent or lipid can interfere with colorimetric assays, and incomplete pellet resolubilization biases the result. Protein should be measured from the same biological sample when possible, using a workflow shown to be linear for the expected pellet range. A parallel piece is acceptable only if tissue heterogeneity is low enough that it represents the extracted piece.
Protein can be used in two different ways:
- Pre-acquisition volume adjustment: reconstitute or inject extracts so that approximately equal protein-equivalent material reaches the instrument. This can reduce loading differences but may conceal true global abundance shifts if used without retaining original scaling information.
- Post-acquisition biological scaling: report analyte amount or peak area per unit protein. This changes the biological unit of the result and must be justified separately.
The two operations should be documented independently. Equalizing injection load does not eliminate the need to report the original tissue input, and protein normalization cannot replace internal standards for analyte-specific recovery.
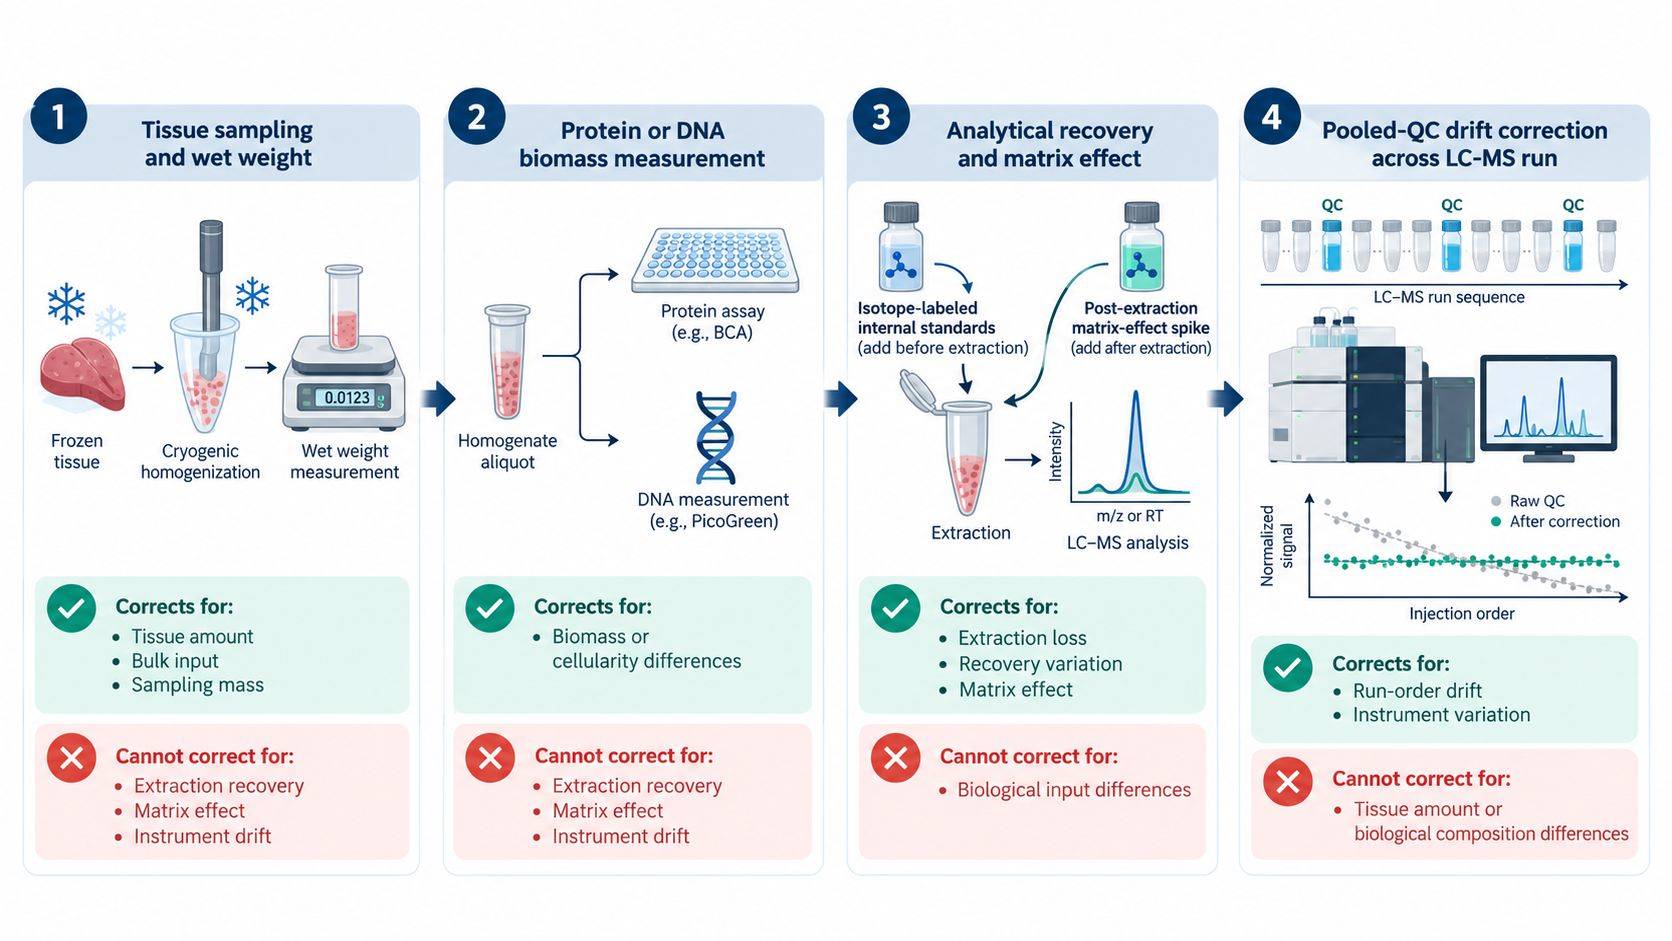 Figure 1. Tissue mass, protein or DNA, isotope-labeled standards, and pooled-QC correction operate at different levels. Applying one factor cannot correct biological input, extraction recovery, matrix effect, and run-order drift simultaneously.
DNA Content and Histological Cellularity
DNA can serve as a proxy for nucleated cell content. It is less influenced by extracellular protein than total protein and can sometimes be recovered from the post-extraction pellet. In cultured-cell studies, DNA has shown a useful relationship with cell number. In tissue, however, the relationship is more conditional.
Nuclear density differs across organs and cell types. Multinucleated muscle fibers, polyploid hepatocytes, aneuploid tumors, infiltrating immune cells, and acellular extracellular matrix all complicate the conversion from DNA mass to cell number. Necrotic tissue may retain extracellular DNA, and incomplete DNA recovery from a solvent-extracted pellet can introduce method-dependent variation.
DNA normalization is most appropriate when:
- the compared samples have similar ploidy and nuclear composition;
- the biological question is closer to cellular abundance than tissue bulk;
- DNA recovery is linear across the tissue-input range;
- the metabolite and DNA measurements originate from the same homogenized sample;
- the intervention is not expected to cause major DNA fragmentation or cell-cycle redistribution.
Histology does not provide a simple scalar denominator, but it often explains why mass-, protein-, and DNA-normalized results disagree. Adjacent sections can estimate viable parenchyma, tumor fraction, necrosis, fibrosis, lipid vacuolation, or inflammatory infiltration. Digital pathology can quantify area fractions or nuclear density, but the section must be spatially matched to the extracted piece. A small adjacent section cannot resolve heterogeneity several millimeters away.
For heterogeneous specimens, macrodissection or cryopulverization may be preferable to elaborate post hoc normalization. Macrodissection enriches the relevant compartment but reduces total input. Cryogenic homogenization creates a more representative powder from a larger region, after which aliquots can be allocated to metabolomics, protein/DNA measurement, and histology-linked assays. The approach should be chosen before thawing, because repeated freeze-thaw cycles and slow dissection alter labile metabolites.
Extraction Recovery and Matrix-Effect Controls
Equal tissue input does not ensure equal analytical recovery. Lipid-rich liver, myelin-rich brain, fibrotic tissue, and kidney can produce different extraction and ionization environments. Even within one organ, disease can change salt, lipid, heme, and protein composition enough to alter ion suppression.
Three experiments separate the major analytical effects:
- Pre-extraction spike: an internal standard is added before homogenization or extraction. Its final response reflects extraction loss, transfer loss, evaporation, reconstitution, injection, and ionization.
- Post-extraction spike: the standard is added to a processed blank matrix. Comparing its response with a neat standard estimates matrix-induced ion suppression or enhancement.
- Neat reference: the standard is prepared in solvent at the same nominal concentration. It provides the unmatrixed response for the matrix-effect comparison.
Process efficiency combines recovery and matrix effect; it should not be called extraction recovery unless the experiment isolates extraction from ionization. For targeted assays, the preferred standard is an isotopologue of the analyte added as early as practical. It coextracts and coelutes with the analyte, providing the closest correction for losses and ionization. When exact isotopologues are unavailable, class-matched standards distributed across retention time are better than one chemically unrelated compound, but they provide semiquantitative rather than analyte-specific correction.
Recovery should be evaluated in representative tissues and concentration ranges. A method validated in liver cannot be assumed to behave identically in brain or adipose tissue. One multi-tissue targeted study found tissue-dependent recovery and matrix effects across brain, heart, liver, kidney, lung, and spleen, underscoring the need to qualify the actual matrix.
| Control | Added when | Primary information | Cannot establish alone |
|---|---|---|---|
| Stable-isotope standard before extraction | Before homogenization or solvent addition | Overall process behavior | Whether low response comes from extraction or ion suppression |
| Stable-isotope standard after extraction | Into processed matrix | Matrix effect and injection behavior | Extraction loss |
| Neat standard | In solvent | Unmatrixed reference response | Tissue recovery |
| Matrix-matched QC | Through complete workflow | Precision and bias in representative matrix | Biological normalization |
| Pooled study QC | Repeated through LC-MS sequence | Analytical stability and run-order drift | Accuracy or sample-specific recovery |
Normalization Strategies for Untargeted and Targeted Metabolomics
In targeted quantification, calibration, recovery, selectivity, matrix effect, dilution integrity, and lower quantification limits are evaluated for defined analytes. Analyte-specific isotope dilution can support concentration units when a suitable calibration model is used. Tissue mass, protein, or DNA then supplies the biological denominator.
In untargeted metabolomics, most features do not have matched standards. Global median or total-signal normalization may reduce sample loading variation, but it assumes that most measured signals do not shift systematically. That assumption can fail in storage disorders, ischemia, severe toxicity, large differences in lipid content, or studies comparing metabolically distinct tissues. A global biological shift may be mistaken for technical bias and normalized away.
Untargeted data should therefore combine orthogonal evidence:
- controlled tissue input and extraction ratio;
- multiple internal standards spanning polarity and retention time;
- extraction blanks and representative matrix blanks;
- pooled-QC samples distributed across the run;
- balanced injection order and batch allocation;
- evaluation of QC precision before and after drift correction;
- explicit documentation of the biological denominator.
The normalization method should be chosen without using group labels to maximize separation. A method that produces the clearest case-control PCA is not necessarily the most accurate; it may amplify confounding or remove within-group biology. Technical performance in QC samples, linearity across dilution series, and agreement with known inputs provide stronger validation criteria.
Tissue-Specific Normalization Pilot Design
A small pilot can establish whether the preferred denominator is measurable and stable before the full cohort is committed. It should include the expected tissue-input range and representative biological states, including the most fibrotic, fatty, necrotic, or edematous samples available.
A practical pilot sequence is:
- cryogenically homogenize enough tissue to create representative aliquots;
- extract a tissue-mass dilution series using a fixed solvent-to-mass ratio;
- add pre-extraction isotope standards and prepare post-extraction spikes;
- measure wet weight and, where relevant, dry matter, protein, DNA, or histological composition;
- assess analyte or feature response against tissue input and each candidate denominator;
- check whether normalization reduces technical variation without compressing known biological differences;
- verify that the intended injection amount remains within chromatographic and detector linearity.
The pilot should not select the denominator that gives the lowest overall coefficient of variation by default. True tissue heterogeneity contributes legitimate variance. The objective is to remove variation caused by unequal sampling and analytical handling while preserving variation tied to tissue composition or treatment.
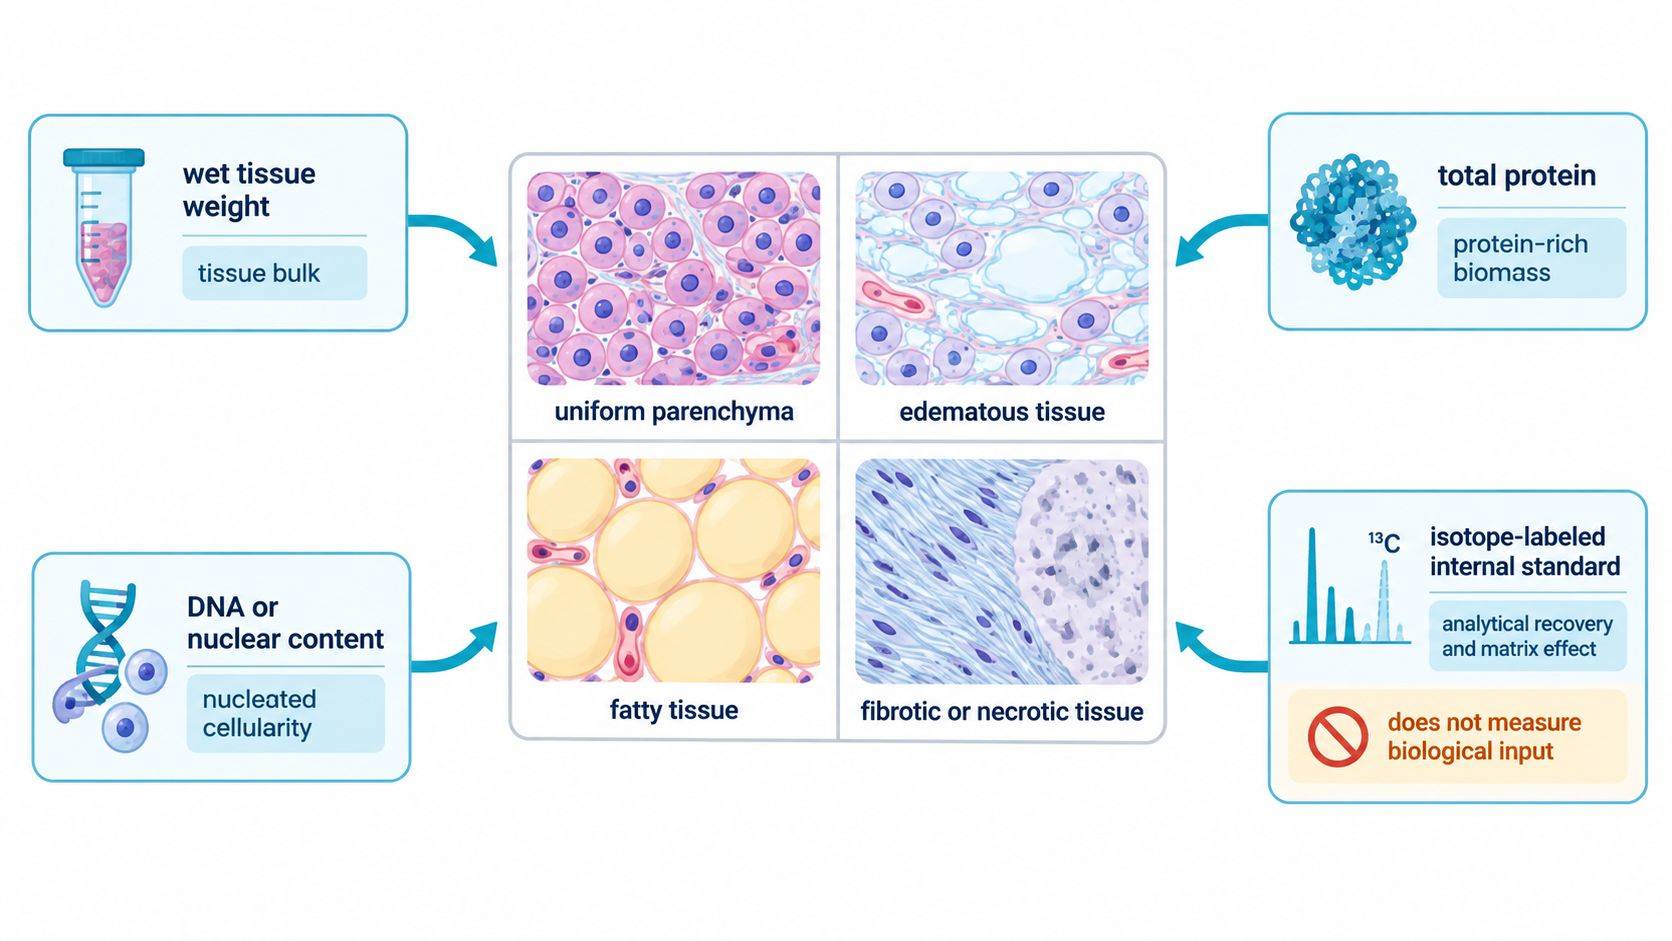 Figure 2. Denominator selection depends on the biological unit and tissue pathology. Wet weight describes tissue bulk, protein and DNA approximate different aspects of biomass, while isotope-labeled standards correct analytical behavior rather than biological input.
Reporting Metabolite Abundance Across Multiple Normalization Scales
A single normalized table can make a technically complex study look unambiguous. A stronger metabolomics data analysis package preserves the measurements needed to reconstruct the conclusion. For targeted tissue measurements, the report should ideally include analyte-to-standard ratio, calculated amount or concentration, tissue mass, selected biological denominator, and relevant QC flags. For untargeted studies, it should retain raw and corrected feature areas, internal-standard behavior, pooled-QC metrics, blank ratios, and the applied scaling factor.
When tissue size or composition is itself altered, two views can be justified—for example, amount per milligram tissue and estimated total organ content, or amount per tissue mass and per DNA. Disagreement is not automatically a technical failure. It may show that concentration, cellular content, and organ remodeling are different parts of the phenotype.
The methods section should state:
- anatomical region and dissection boundaries;
- whether tissue was perfused, rinsed, blotted, freeze-clamped, or cryomilled;
- wet or dry mass and weighing conditions;
- solvent volume-to-tissue ratio and homogenization procedure;
- time and temperature from excision to quench;
- protein or DNA assay source, recovery, and linear range;
- internal-standard identities and addition points;
- recovery, matrix-effect, dilution, and pooled-QC results;
- pre-acquisition adjustment and post-acquisition normalization as separate steps.
The normalization denominator must remain visible in the biological interpretation. Wet weight represents tissue bulk, whereas protein and DNA represent different aspects of biomass and cellularity. Isotope-labeled controls and pooled QC address analytical variation rather than biological input. The appropriate denominator therefore depends on tissue composition, the perturbation, and the biological unit reported.
References
- Lee GB, Yang C, Hu F, Hao L. Evaluating Sample Normalization Methods for MS-Based Multi-Omics and the Application to a Neurodegenerative Mouse Model. Analyst. 2025;150:1271-1279. https://doi.org/10.1039/d4an01573h
- Andres DA, et al. Improved Workflow for Mass Spectrometry-Based Metabolomics Analysis of the Heart. J Biol Chem. 2020;295(9):2676-2686. https://doi.org/10.1074/jbc.RA119.011081
- Silva LP, et al. Measurement of DNA Concentration as a Normalization Strategy for Metabolomic Data from Adherent Cell Lines. Anal Chem. 2013;85(20):9536-9542. https://doi.org/10.1021/ac401559v
- Schoeman JC, et al. Development and Application of a UHPLC-MS/MS Metabolomics Based Comprehensive Systemic and Tissue-Specific Screening Method for Inflammatory, Oxidative and Nitrosative Stress. Anal Bioanal Chem. 2018;410:2551-2568. https://doi.org/10.1007/s00216-018-0912-2
- Boysen AK, Heal KR, Carlson LT, Ingalls AE. Best-Matched Internal Standard Normalization in Liquid Chromatography-Mass Spectrometry Metabolomics Applied to Environmental Samples. Anal Chem. 2018;90(2):1363-1369. https://doi.org/10.1021/acs.analchem.7b04400
- Sysi-Aho M, et al. Normalization Method for Metabolomics Data Using Optimal Selection of Multiple Internal Standards. BMC Bioinformatics. 2007;8:93. https://doi.org/10.1186/1471-2105-8-93
- Liu X, et al. Investigation of the “True” Extraction Recovery of Analytes from Multiple Types of Tissues and Its Impact on Tissue Bioanalysis Using Two Model Compounds. Anal Chim Acta. 2016;945:57-66. https://doi.org/10.1016/j.aca.2016.09.039

 Contact Us


