NADPH Metabolic Flux Analysis — Beyond Static Pool Concentrations
Nicotinamide adenine dinucleotide phosphate (NADPH) operates as the primary cellular reducing equivalent, driving reductive biosynthesis (fatty acids, cholesterol, proline) and fueling antioxidant defense systems (glutathione and thioredoxin reductases). However, measuring static concentrations of NADPH or the NADPH/NADP+ ratio cannot reveal dynamic production velocities, substrate origins, or compartmental contributions from distinct enzymatic sources.
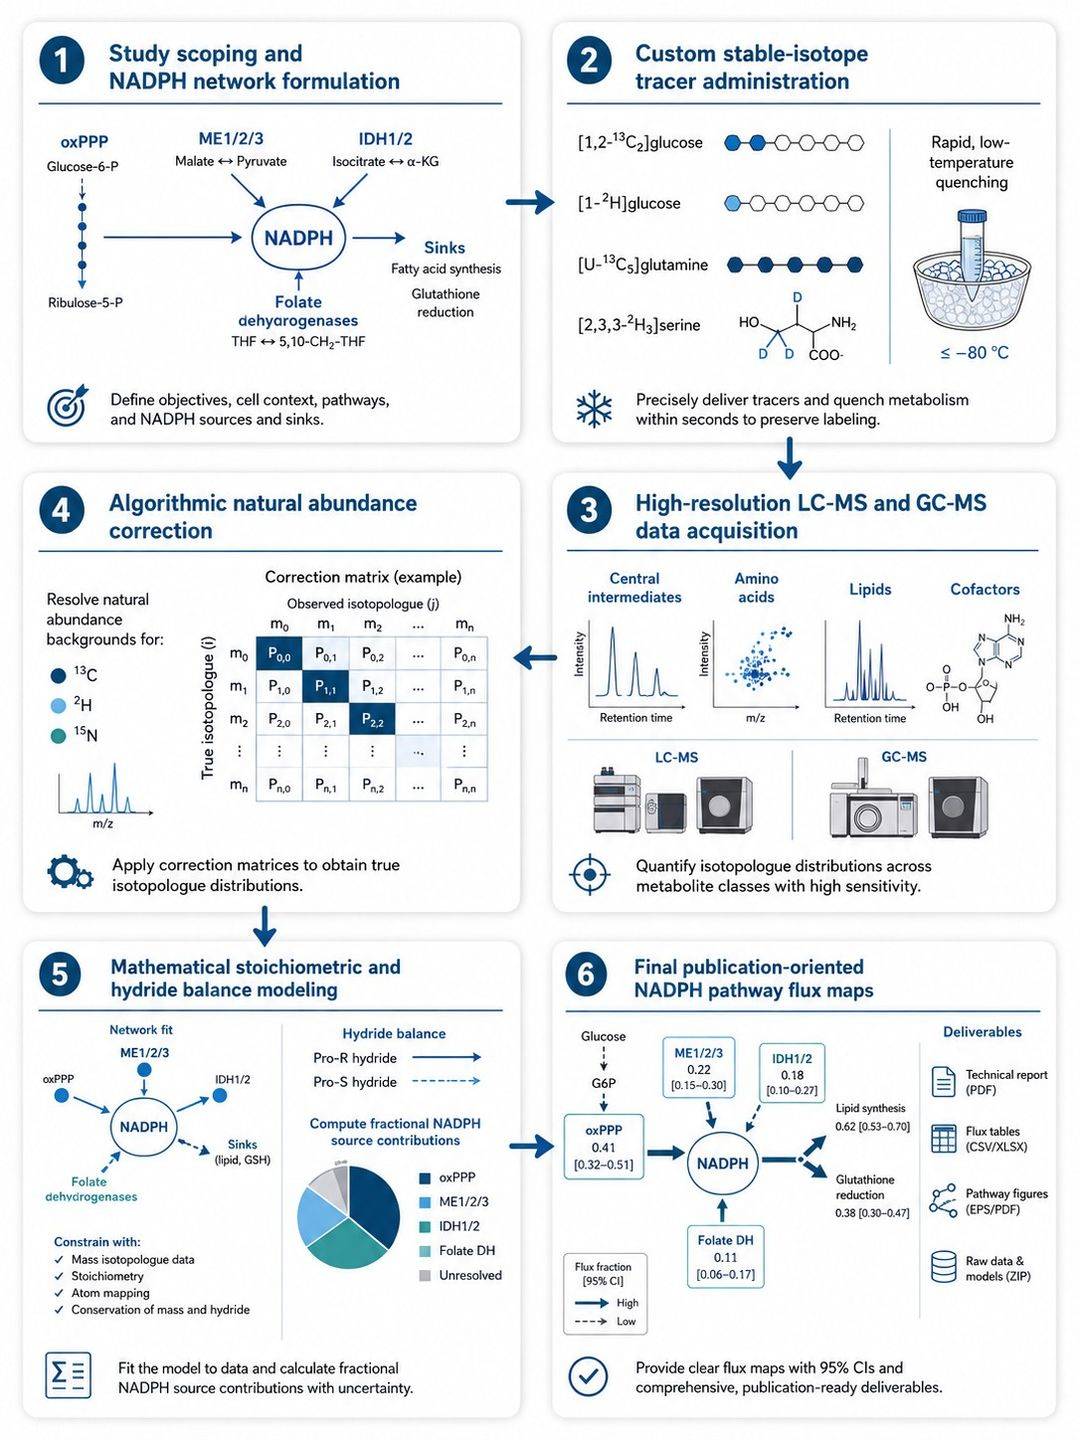
As a specialized pathway Spoke within our central carbon metabolic flux analysis and broader metabolic flux analysis service, NADPH MFA utilizes stable isotope tracers (13C and 2H) to resolve reaction velocities across key NADPH-generating and consuming nodes:
(i) Oxidative Pentose Phosphate Pathway (oxPPP) Throughput: Quantifying G6PDH and 6PGD reaction rates yielding 2 NADPH per glucose-6-phosphate oxidized, detailed in our pentose phosphate pathway analysis resource.
(ii) Malic Enzyme (ME1) Decarboxylation Flux: Tracking glutamine- or glucose-derived malate decarboxylation to pyruvate generating cytosolic NADPH, linked to our TCA cycle metabolic flux analysis.
(iii) Isocitrate Dehydrogenase (IDH1/IDH2) Flux: Resolving cytosolic IDH1 and mitochondrial IDH2 oxidative decarboxylation of isocitrate to α-ketoglutarate supplying compartmental NADPH pools.
(iv) One-Carbon Folate Dehydrogenase Flux: Evaluating one-carbon-linked hydride transfers (ALDH1L1/2 and MTHFD1/2) within our one-carbon metabolic flux analysis framework.
(v) Reductive Biosynthetic Sinks & Redox Demand: Modeling the coupling between NADPH generation and fatty acid synthesis sinks, interpreted in conjunction with complementary cellular redox readouts.
Looking for static pyridine nucleotide quantification? If your research objective is measuring steady-state pool sizes or ratios of NADPH, NADP+, NADH, and NAD+ without stable isotope tracing, please explore our Energy Metabolism Service.
Analytical Considerations in Cellular Redox & NADPH Fluxomics
Quantifying NADPH metabolic fluxes requires specialized isotope tracking strategies due to rapid hydride turnover and cellular compartmentation:
- Deuterium (2H) & 13C Hydride Tracing: Direct tracking of hydrogen/hydride transfer using [1-2H]glucose alongside carbon backbone tracers ([1,2-13C2]glucose, [U-13C5]glutamine) captures enzymatic hydride donation to NADP+.
- Rapid Low-Temperature Quenching & pH Control: Reduced pyridine nucleotides (NADPH, NADH) are acid-labile, whereas oxidized cofactors (NADP+, NAD+) are alkali-labile. Fast quenching with optimized extraction buffers preserves intermediate stability.
- High-Resolution LC-MS/MS & GC-MS Orthogonal Profiling: Underivatized LC-MS/MS profiles polar phosphorylated intermediates and cofactors, while GC-MS-based metabolic flux analysis supplies fragment-specific carbon constraints on organic acids and fatty acids.
- Multi-Element Background Deconvolution: Algorithmic matrix deconvolution (IsoCor / AccuCor) mathematically corrects raw spectra for natural 13C, 2H, 15N, and 18O backgrounds.
Stable-Isotope Tracer Strategies for NADPH Source Deconvolution
The choice of isotope tracer dictates which NADPH-generating pathways and fractional contributions are mathematically identifiable:
| Tracer Substrate |
Target NADPH-Generating Node |
Diagnostic MID Readout & Value |
| [1,2-13C2]Glucose |
Oxidative Pentose Phosphate Pathway (oxPPP) Throughput |
Direct glycolysis yields M+2 downstream triose phosphates and lactate (retaining C1-C2 intact), whereas oxPPP decarboxylation of C1 yields M+1 pentose phosphates and downstream M+1 lactate. Directly quantifies the oxPPP flux generating 2 NADPH per G6P. |
| [1-2H]Glucose |
G6PDH Hydride Transfer & Lipogenic NADPH Contribution |
The C1 deuterium of glucose is transferred to NADP+ by G6PDH, forming [4-2H]NADPH. Incorporation of deuterium into newly synthesized fatty acids (e.g. palmitate) provides a direct readout of the G6PDH contribution to the lipogenic NADPH pool. |
| [U-13C5]Glutamine |
Malic Enzyme (ME1) & Cytosolic IDH1 Flux |
Glutamine feeds the TCA cycle to form malate. Export of [U-13C4]malate and decarboxylation by ME1 generates M+3 pyruvate and cytosolic NADPH. In parallel, IDH1 reduction/oxidation flux is resolved from M+5 α-KG labeling. |
| [3-13C]Glutamine |
Selective ME1 Pyruvate Decarboxylation Tracing |
Yields [1-13C]malate or [3-13C]malate. Decarboxylation by ME1 generates [1-13C]pyruvate or [3-13C]pyruvate, providing high sensitivity for estimating ME1-derived NADPH. |
| [2,3,3-2H3]Serine |
Folate-Mediated One-Carbon Hydride Routing |
Tracks 1C-coupled hydride transfers during 10-formyl-THF oxidation (ALDH1L1/2) and methylene-THF interconversion, evaluating one-carbon pathway contributions under defined metabolic constraints. |
Technical Capabilities for High-Resolution NADPH Flux Analysis
- Fractional Source Deconvolution Modeling: Stoichiometric network modeling solving for model-supported percentage contributions of oxPPP, ME1, IDH1, and folate pathways fueling reducing power demand.
- Dual Carbon-Deuterium Isotope Integration: Combines 13C carbon backbone balances with 2H hydride incorporation into biosynthetic products (palmitate, stearate, cholesterol, proline).
- Isotopic Steady-State and Dynamic Kinetic Sampling: Supports steady-state fractional contribution studies as well as time-course dynamic and INST metabolic flux analysis to monitor acute redox challenges (e.g. H2O2, menadione, G6PDH inhibitors).
- Complementary Positional Validation: High-field NMR-based metabolic flux analysis available for resolving position-specific deuterium and carbon labeling in lipid extracts.
End-to-End NADPH MFA Workflow & Analytical Pipeline
Sample Preparation & Stabilization Guidelines for NADPH MFA
Sample amounts and extraction protocols are finalized during feasibility review based on target pathway activity and matrix type:
| Sample Type |
Typical Input Guidelines |
Harvesting & Quenching Principles |
Storage & Transport |
| Adherent Cultured Cells |
Typically 2–10 × 106 cells (100 mm dish or two 60 mm dishes) |
Aspirate tracer medium rapidly, rinse with ice-cold saline, add pre-chilled organic extraction solvent, cell detachment on dry ice/ice. Minimize wash duration. |
Store at −80 °C; ship on dry ice |
| Suspension Cultured Cells |
Typically 5–15 × 106 cells, adjusted to cell density |
Short, pre-cooled centrifugation (4 °C), aspirate supernatant, extract cell pellet immediately in cold organic solvent. |
Store at −80 °C; ship on dry ice |
| Animal & Tumor Tissues |
20–50 mg wet weight, depending on metabolic activity |
Instant freeze-clamping or flash freezing in liquid nitrogen immediately upon collection; cryo-pulverize without intermediate thawing. |
Store at −80 °C; ship on dry ice |
| Blood Plasma / Serum |
≥ 100 μL matched plasma or serum |
Collect blood into EDTA tubes, centrifuge immediately (4 °C, 2,000 × g, 10 min), aliquot and freeze immediately. |
Store at −80 °C; ship on dry ice |
| Conditioned Culture Medium |
≥ 200 μL matched supernatant |
Sample matched culture supernatant across labeling time points; clarify by centrifugation (4 °C) to quantify glucose and glutamine uptake rates. |
Store at −80 °C; ship on dry ice |
Deliverables & Quantitative Datasets from NADPH MFA
- Deconvoluted MID Matrices: Natural-abundance-corrected fractional labeling (M+0 to M+n) across glycolytic intermediates, pentose phosphates, organic acids, amino acids, and lipids.
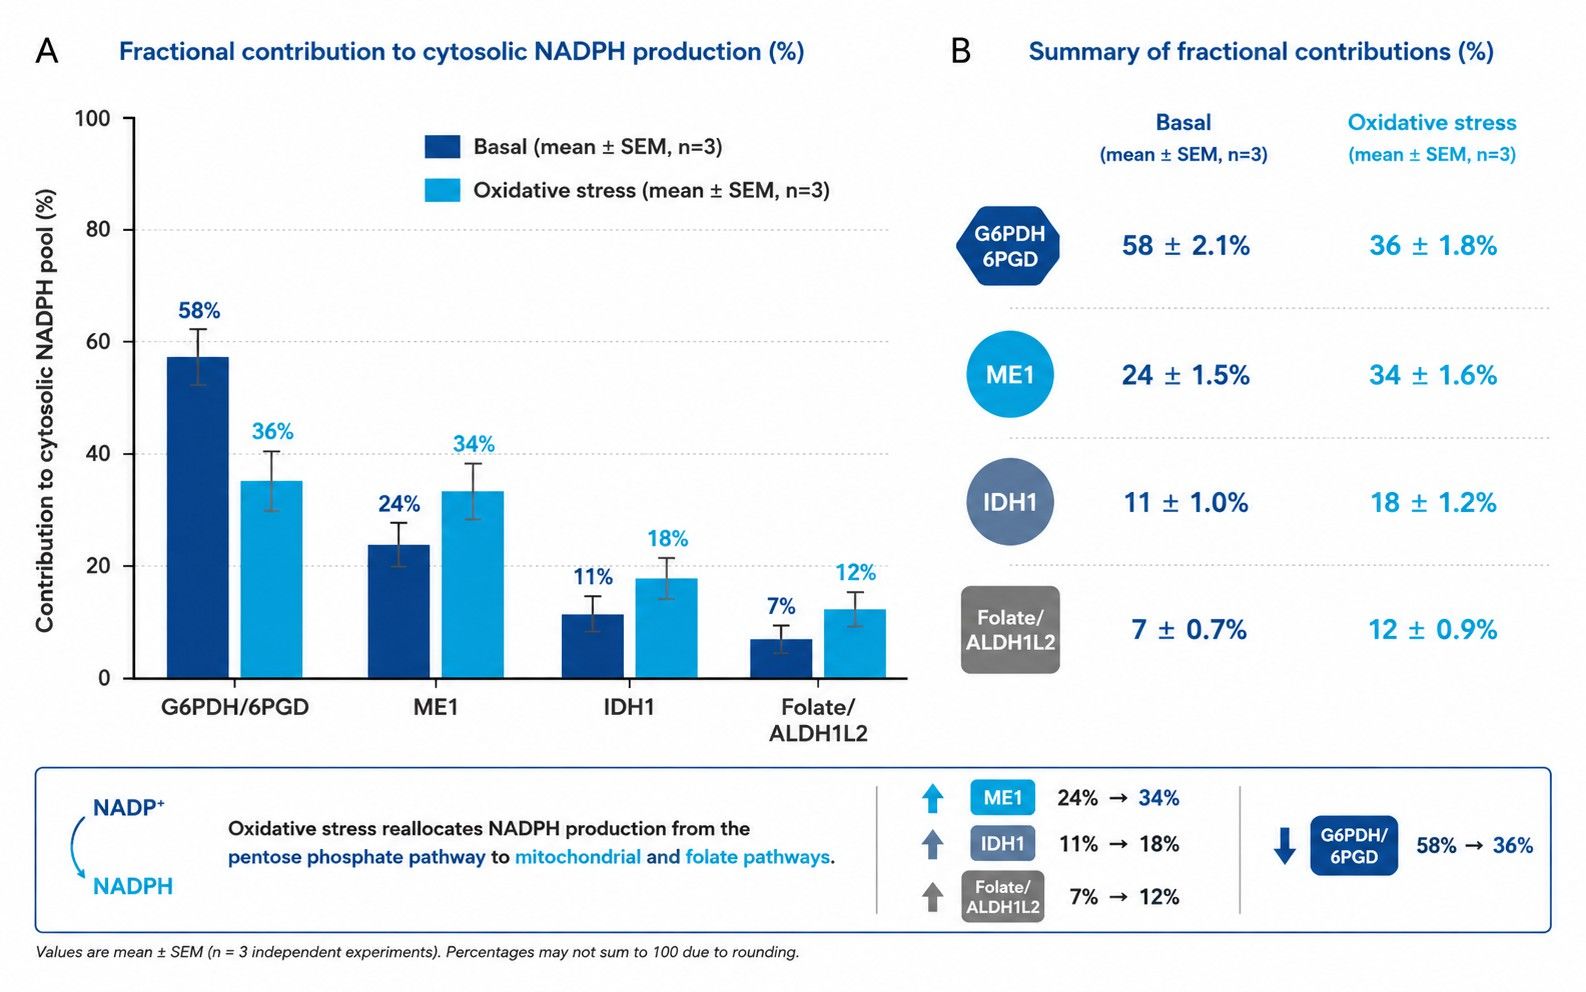
- Fractional NADPH Source Deconvolution: Model-supported percentage breakdown of NADPH generation derived from oxPPP (G6PDH/6PGD), malic enzyme (ME1), IDH1, and folate pathways under verified experimental constraints.
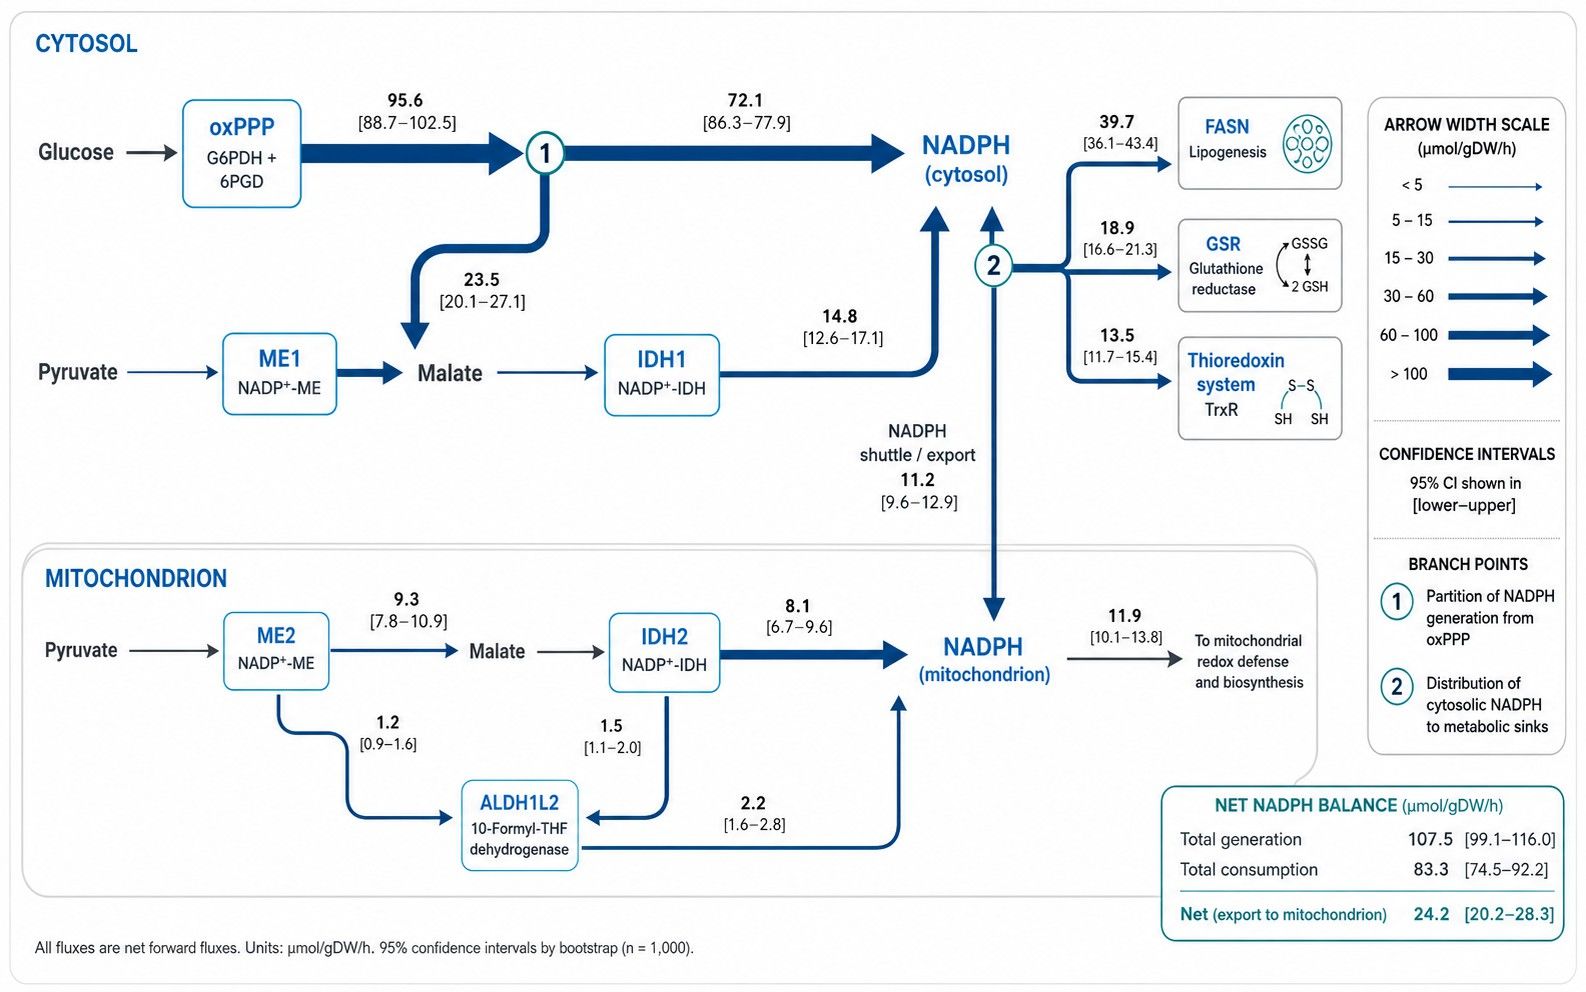
- Lipogenic NADPH Utilization Rates: Quantified rates of NADPH incorporation fueling de novo lipogenesis (FASN) based on fatty acid deuteration profiles.
- Stoichiometric Model Specifications: Complete reaction network definitions, carbon/deuterium atom transition mappings, and project configuration files.
- Statistical Fit Diagnostics: Sum of squared residuals (SSR), Chi-square goodness-of-fit evaluation, and residual diagnostic plots.
- Publication-Ready Pathway Maps: High-resolution vector graphics (PDF/SVG) illustrating NADPH generation and consumption flux partitioning.
How to Scope a NADPH Source-Contribution Study
NADPH deuterium and carbon tracing provides powerful insights into cellular reducing power, but experimental designs must align with what each analytical readout can defensibly establish. We structure NADPH studies based on specific biological questions and necessary experimental evidence:
| Research Objective |
Experimental Tracer & Readout Strategy |
Supported Interpretations & Analytical Boundaries |
| Lipid Synthesis NADPH Sources |
[1-2H]Glucose, [U-13C5]glutamine, or deuterated water (2H2O) paired with FAME GC-MS analysis of newly synthesized palmitate (C16:0). |
Quantifies the relative fractional contribution of G6PDH vs. ME1/IDH1 to the lipogenic NADPH pool. Represents a direct readout of cytosolic lipid-synthesizing NADPH, but does not automatically reflect total whole-cell NADPH production across all compartments. |
| NADPH Redistribution Under Oxidative Stress |
[1,2-13C2]Glucose (oxPPP flux) and [U-13C5]glutamine time courses combined with auxiliary quantification of GSH/GSSG ratios and substrate uptake/secretion. |
Explains pathway-level shifts in NADPH source engagement (e.g. acute oxPPP upregulation). Resolves pathway source dynamics, but cannot be directly equated with an absolute "antioxidant consumption flux" without paired kinetic antioxidant measurements. |
| Cytosolic vs. Mitochondrial NADPH Sources |
Compartment-specific reporter systems, validated subcellular isotopic markers, or genetically targeted enzyme perturbations (e.g. ME1 vs. ME2/3, IDH1 vs. IDH2 knockouts). |
Delineates compartmental reducing power generation when supported by verified sub-cellular constraints. Standard whole-cell MID/EMU balances alone cannot defensibly claim full compartmental distinction without orthogonal spatial validation. |


 Contact Us



