MALDI-MSI Spatial Metabolomics — In Situ Metabolite and Lipid Mapping on Tissue
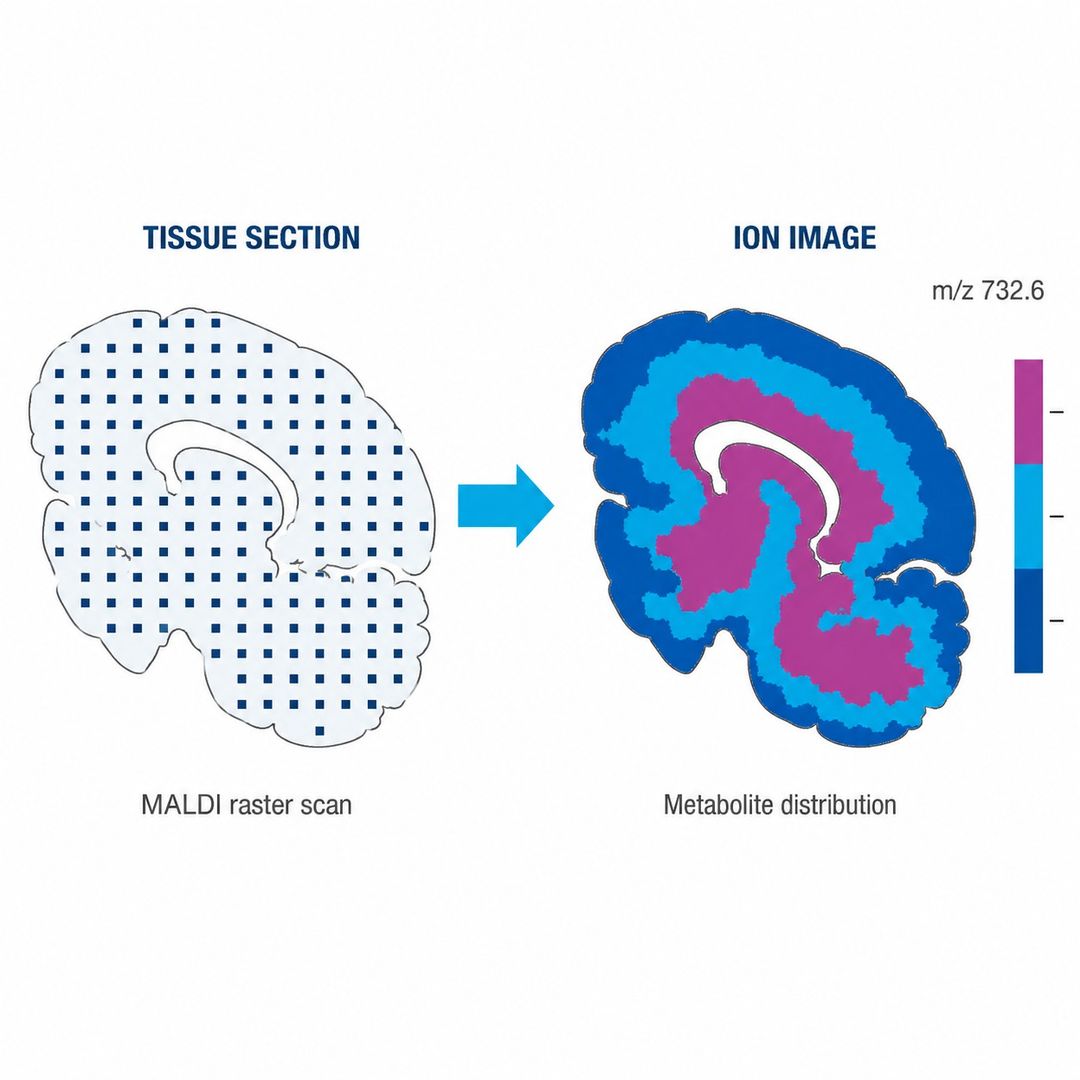
MALDI-MSI spatial metabolomics is a label-free tissue imaging method operating at 10–100 µm resolution, combining on-tissue derivatization, dual-polarity acquisition, and histology co-registration for in situ metabolite and lipid mapping.
Conventional metabolomics homogenizes tissue and averages away spatial information. Where a tumor meets its
stroma, where a drug accumulates versus where it clears, which brain regions rewire their metabolism — these
questions require data that keeps the location attached to the measurement. MALDI mass spectrometry imaging
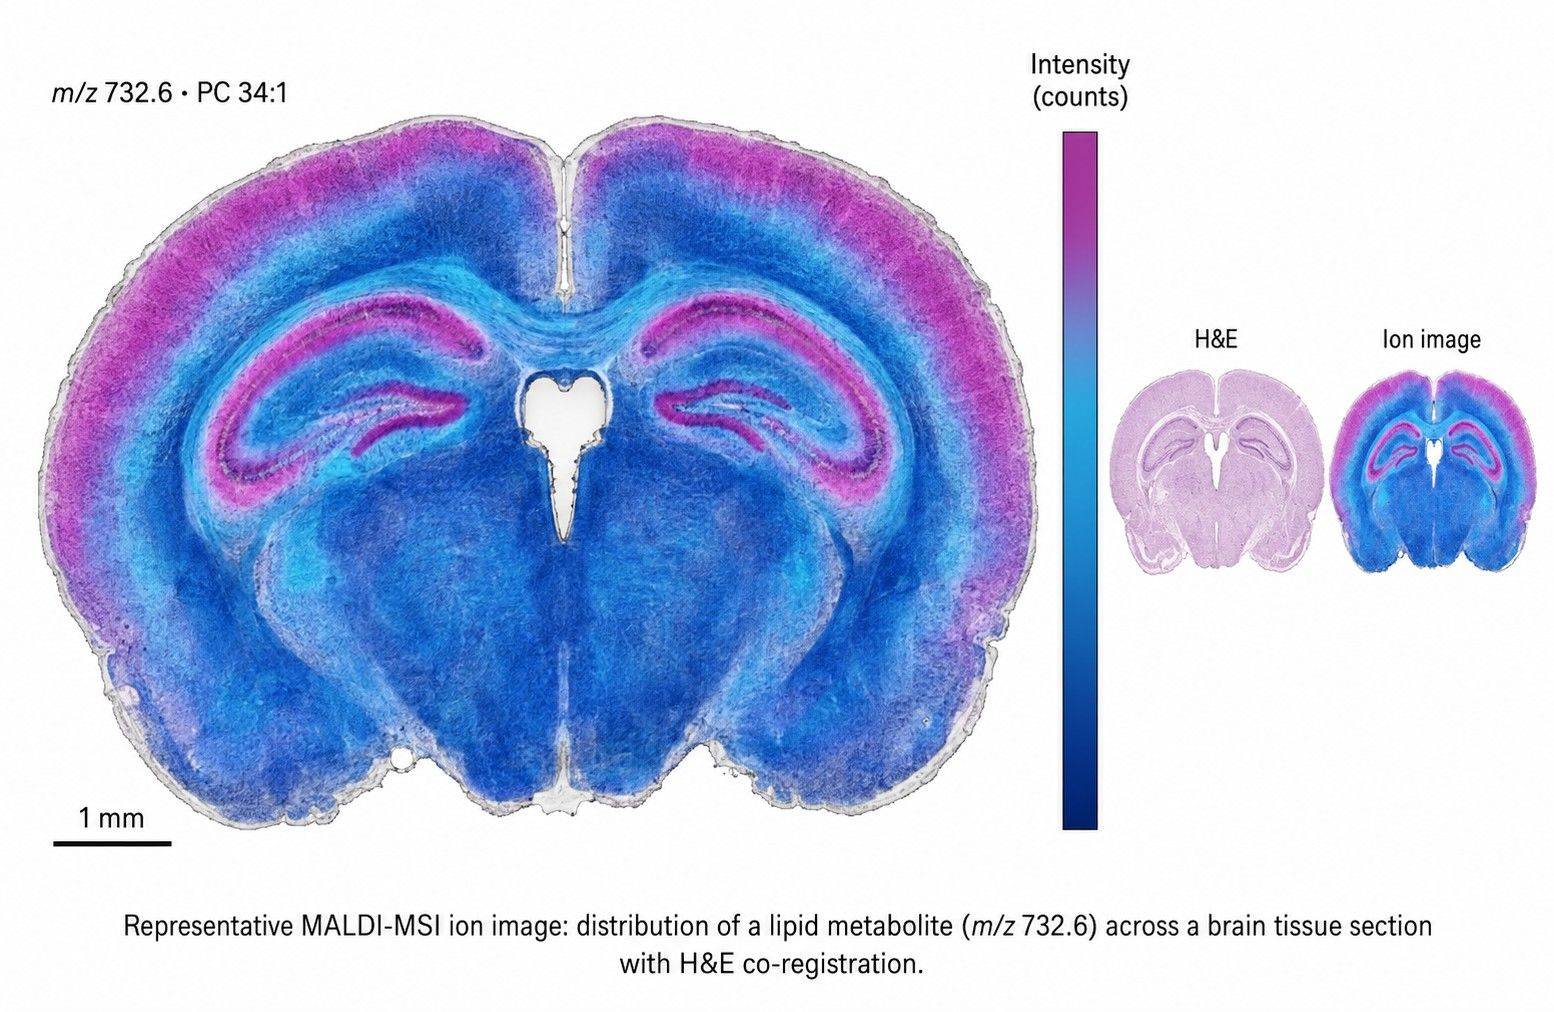
(MALDI-MSI) generates a mass spectrum at every pixel of a tissue section, producing ion images in which each
metabolite or lipid is mapped back to its anatomical position.
MALDI-MSI spatial metabolomics delivers:
- Micrometer spatial resolution: pixel sizes of 10–100 µm selected per study objective,
with histology co-registration for region-of-interest analysis
- Metabolite and lipid coverage in one run: amino acids, TCA and energy metabolites,
neurotransmitters, free fatty acids, phospholipids, sphingolipids, and more across dual polarity
- On-tissue derivatization options: carbonyl, amine, and carboxylate chemistry extends
sensitivity to polar metabolite classes that ionize poorly without derivatization
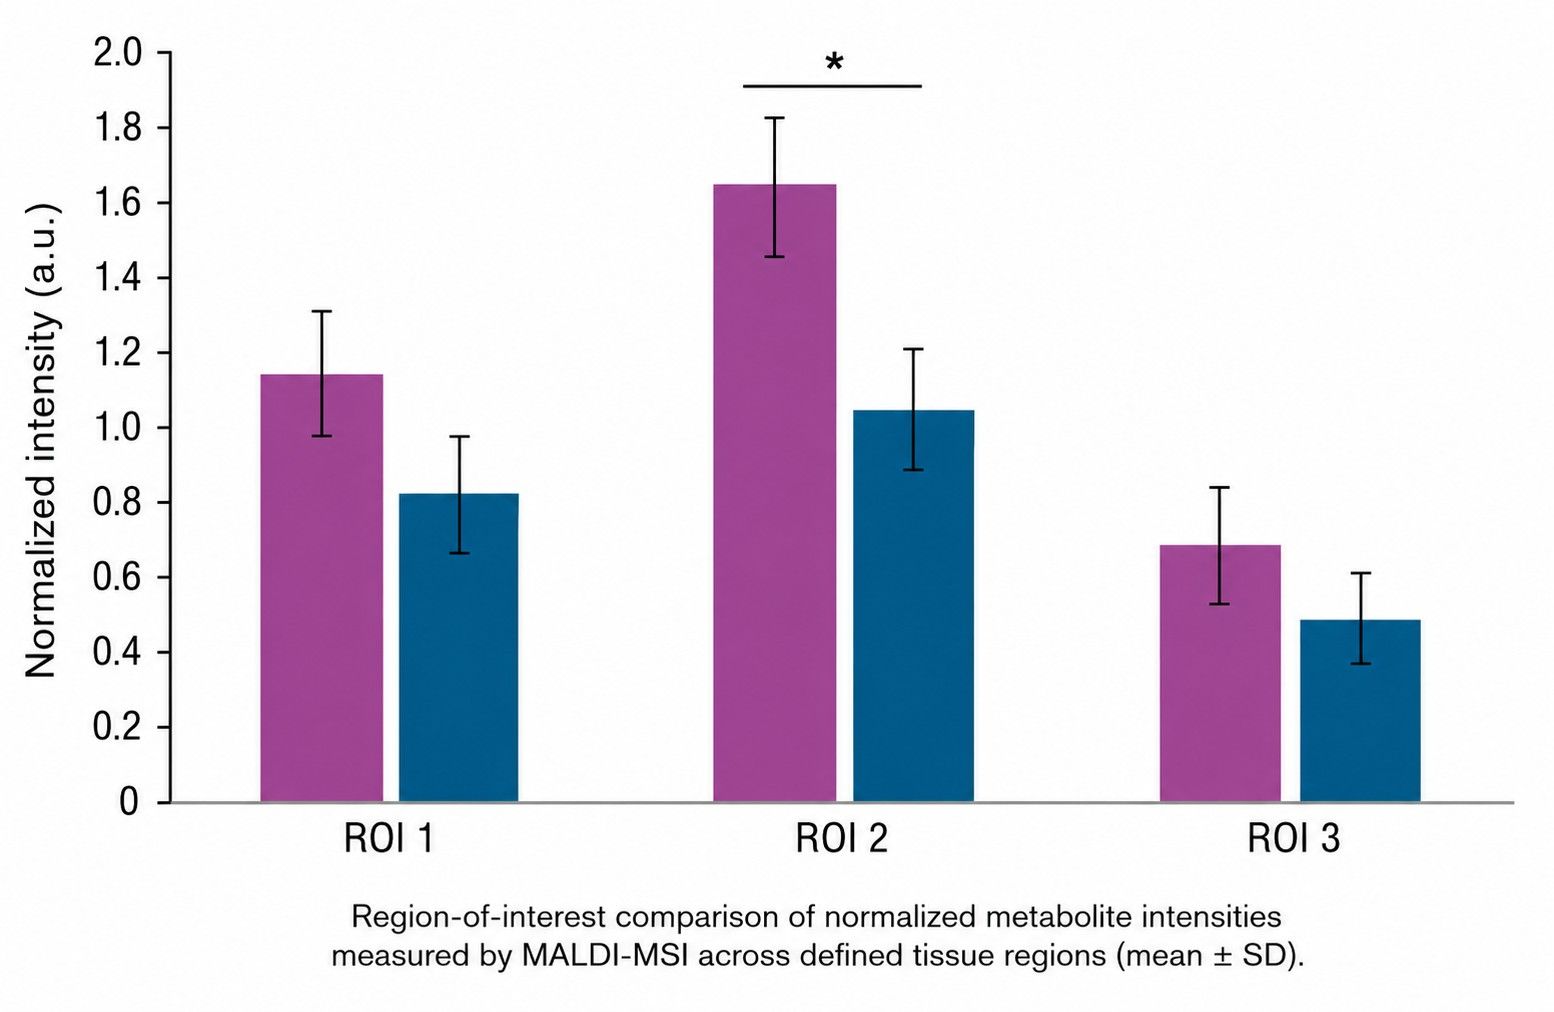
- Spatial statistics: region-of-interest differential abundance, co-localization, and
spatial autocorrelation (e.g., Moran's I) for decision-grade comparisons
What MALDI-MSI Adds Over Conventional Metabolomics
Conventional LC-MS answers "how much is in the whole sample." MALDI-MSI answers "where is it, and how does
that differ between regions?" The two are complementary — conventional methods provide sensitive global
quantification, while imaging reveals the spatial biology that averaging hides:
Conventional Metabolomics vs. MALDI-MSI Spatial Metabolomics
| Dimension |
Conventional Metabolomics (LC-MS) |
MALDI-MSI Spatial Metabolomics |
| Information captured |
Average concentration across homogenized tissue |
Per-pixel intensity with anatomical location |
| Heterogeneity |
Microenvironments, boundaries, and gradients are averaged away |
Tumor core vs. periphery, tissue zones, and interfaces resolved |
| Histology context |
Not preserved — sample is destroyed |
Ion images co-registered to H&E and IHC |
| Throughput vs. depth |
Deep coverage of many metabolites |
Broad spatial map; orthogonal LC-MS recommended for deep confirmation |
For deep quantitative confirmation of imaging hits, our untargeted metabolomics service provides homogenate-based
LC-MS profiling on adjacent sections — the two approaches read the same biology from complementary angles.
MALDI-MSI Platform and Technical Parameters
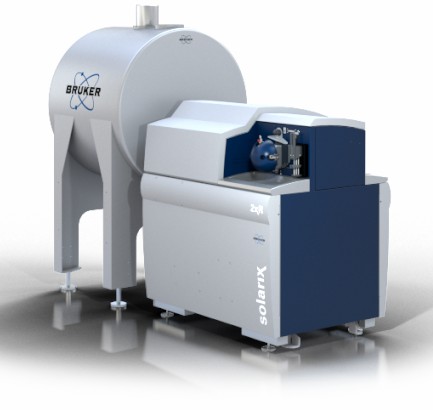
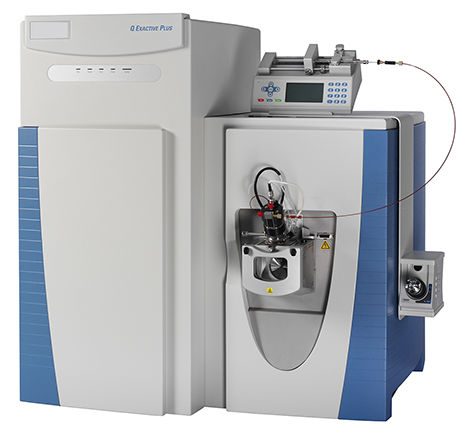
Our MALDI-MSI workflows run on high-resolution mass spectrometry platforms with MALDI ionization sources,
configured per study for the pixel size, mass range, and chemical coverage your question requires.
| Parameter |
Specification |
| Spatial resolution (pixel size) |
10–100 µm, selected per objective and sample type |
| Mass range (m/z) |
~50–1,500 for small molecules and lipids (expandable with method) |
| Mass accuracy |
Down to low-ppm on high-resolution platforms with lock-mass correction |
| Ionization modes |
Positive and negative polarity acquisition |
| MALDI matrices |
CHCA, DHB, 9-AA, DAN, and analyte-specific formulations |
| On-tissue derivatization |
Carbonyls (oxo-metabolites), amines (neurochemicals, amino acids), carboxylates (TCA
intermediates) |
| Section thickness |
5–20 µm for frozen tissue; FFPE thickness per method |
| Normalization |
TIC, RMS, internal calibrants, or histology-guided strategies |
| File formats |
imzML + vendor raw; processed CSV/Parquet; figures PNG/TIFF/SVG |
Spatial Metabolome and Lipidome Coverage
On-tissue derivatization spatial metabolomics extends MALDI-MSI beyond lipids into polar primary
metabolites — the class most customers worry is undetectable by MALDI. Combined with lipid imaging, coverage
spans the full small-molecule landscape in a single section:
| Compound class |
Examples and notes |
| Amino acids and derivatives |
Glutamate, GABA, glycine, taurine, N-acetylaspartate — amine derivatization enhances signal |
| TCA and energy metabolites |
Citrate, succinate, fumarate, ATP/ADP/AMP — carboxylate chemistry improves detection |
| Neurotransmitters and neuromodulators |
Dopamine, serotonin, acetylcholine, histamine — amine-targeted on-tissue chemistry |
| Free fatty acids and eicosanoids |
Palmitic, oleic, arachidonic acid; oxidized lipid species |
| Phospholipids and sphingolipids |
PC, PE, PI, PS, SM, ceramides, sulfatides — strong negative-mode signals |
| Neutral lipids |
Cholesterol, diacylglycerols, triacylglycerols — matrix-optimized detection |
| Drugs and xenobiotics |
Label-free mapping of parent compound and metabolite distribution |
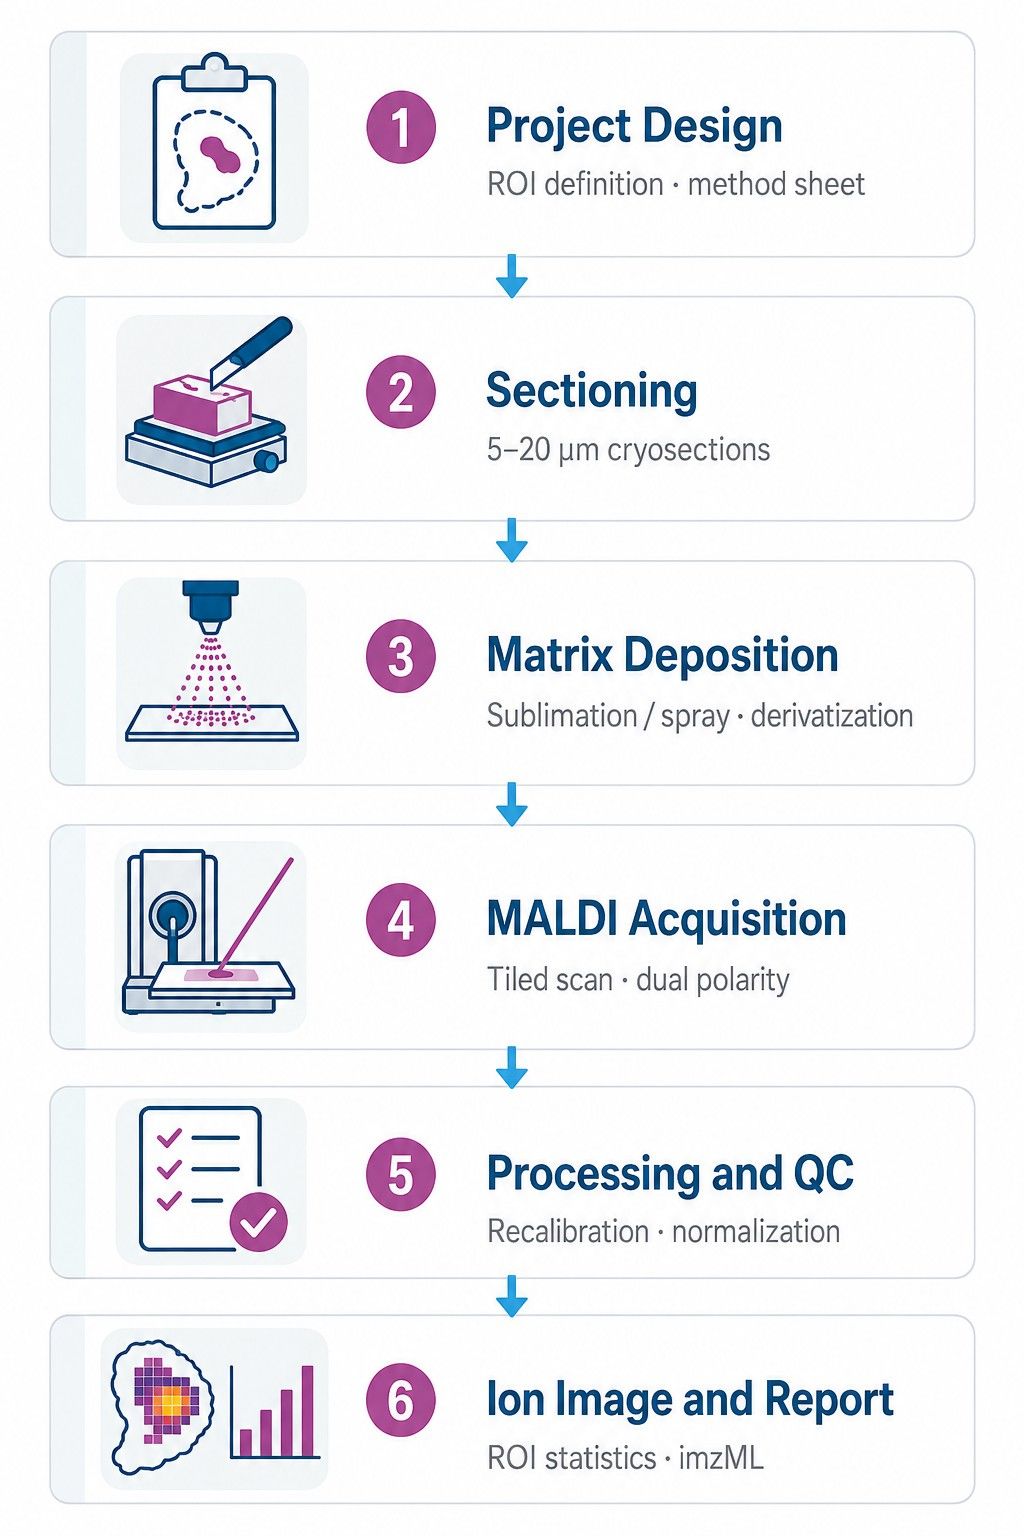
MALDI-MSI Workflow — A Step-by-Step Guide
Sample Requirements for MALDI-MSI (Fresh-Frozen, FFPE, Organoids)
MALDI-MSI is compatible with a wide range of sample types. Because imaging preserves tissue architecture,
sample orientation and section quality directly affect data quality:
| Sample type |
Requirements and notes |
| Fresh-frozen tissues |
Mammalian, plant, xenografts; embedded in OCT or equivalent; 5–20 µm sections |
| FFPE sections |
Lipid-focused imaging and select metabolite panels; optimized deparaffinization |
| Organoids and spheroids |
3D cultures prepared for sectioning; compatible with imaging workflows |
| Microbial biofilms |
Community-level spatial metabolomics of microbial consortia |
| Tissue microarrays (TMAs) |
Multiplexed region-of-interest analysis across many specimens |
| Food and plant matrices |
Method-dependent; compatibility evaluated during project design |
FFPE guidance: Formalin fixation and paraffin embedding can deplete small molecules, but
optimized deparaffinization followed by on-tissue derivatization extends FFPE compatibility beyond
lipid-focused imaging to defined metabolite classes — including amines and carbonyls. If you are working
with FFPE blocks and are unsure whether your analyte of interest survives the workflow, contact us with the
target list before submission; we will confirm feasibility during project design.
Why Choose Our MALDI-MSI Service
- Metabolome-forward coverage
We integrate spatial lipidomics and metabolomics in a single acquisition — amino acids, TCA intermediates, and neurotransmitters via on-tissue derivatization, alongside full lipid imaging.
- Dual-polarity acquisition
Positive and negative modes in a single study maximize coverage across lipid, metabolite, and xenobiotic classes.
- Histology co-registration
Ion images are aligned to H&E and IHC so molecular findings stay anchored to real tissue morphology.
- Orthogonal validation
Imaging hits can be confirmed by LC-MS on adjacent sections or serial extracts, adding deep quantitative confirmation to imaging data.
- Auditable QC
Lock-mass calibration, replicate regions, background and matrix-only controls, and acceptance criteria documented per slide set.
MALDI-MSI Data Deliverables and Spatial Bioinformatics
Our histology-guided spatial metabolomics workflow delivers presentation-ready assets and the raw data to
re-analyze:
- Ion images for prioritized features, co-registered to histology (presentation-ready)
- ROI-level tables with mean, median, variance, effect sizes, and FDR-controlled p-values
- Spatial statistics — co-localization matrices, gradient analysis, neighborhood
enrichment, Moran's I
- Quantitative spatial metabolomics options — semi-absolute quantification of defined
targets using on-tissue stable-isotope internal standards (SIL-IS), with feasibility assessed per study
- Pathway panels summarizing localized pathway activity trends
- Full data package — imzML, vendor raw files, peak lists, metadata JSON, and analysis
notebooks
Applications
- Oncology and tumor metabolism — map metabolic reprogramming across tumor boundaries,
hypoxic cores, and invasive fronts; study drug penetrance and resistance microenvironments
- Neuroscience — regional metabolome rewiring in brain sections; neurotransmitter
localization; neuropathology models
- Drug distribution and pharmacology — label-free drug distribution imaging of parent
compounds and metabolites across target tissues, without radiolabeling or fluorescent tags
- Plant and food science — spatial localization of secondary metabolites and defense
compounds in tissue sections
- Microbiome and biofilm — community-level metabolite mapping in microbial consortia
As part of the broader spatial metabolomics service
portfolio, MALDI-MSI can be combined with DESI-MSI, nano-DESI, and spatial transcriptomics for multi-modal
tissue analysis.
Case Study: Tumor Drug Penetration Measured by Targeted Metabolomics in
Cholangiocarcinoma
Pan-lysyl oxidase inhibition disrupts fibroinflammatory tumor stroma, rendering cholangiocarcinoma susceptible to chemotherapy
Burchard, P. R., Ruffolo, L. I., Ullman, N. A., Dale, B. S., Dave, Y. A., Hilty, B. K., Ye,
J., Georger, M., Jewell, R., Miller, C., et al. | Hepatology Communications, 2024, 8(8), e0502
DOI: 10.1097/hc9.0000000000000502
Background
Cholangiocarcinoma (CCA) is characterized by a highly desmoplastic, fibroinflammatory stroma that
compresses tumor vasculature and limits chemotherapeutic penetration. Pan-lysyl oxidase (pan-LOX) inhibition
was proposed to reverse this mechanical barrier and restore drug access to the tumor.
Challenge: Quantify how effectively chemotherapy reaches the tumor interior when stromal
remodeling is disrupted — a measurement that requires tissue-level drug quantification, not just plasma
levels.
Analytical Approach
In a mouse model of cholangiocarcinoma treated with pan-LOX inhibition plus chemotherapy, intratumoral
5-fluorouracil (5FU) concentration was determined by UPLC-MS analysis performed at Creative Proteomics — a
tissue-level quantitative readout of drug penetrance into the tumor.
Key Findings
| Metric |
Finding |
| Intratumoral 5FU |
Quantified by UPLC-MS in CCA tumors; higher drug levels associated with improved response |
| Tumor growth |
Delayed growth and improved survival with pan-LOX inhibition plus chemotherapy |
| Vascular decompression |
Pan-LOX inhibition reversed mechanical compression of tumor vasculature |
| Chemotherapeutic penetrance |
Improved drug delivery into the tumor interior |
What This Means for Your MALDI-MSI Study
- Tissue-level drug quantification is the question. The 5FU penetrance readout that drove
this study is exactly the measurement class MALDI-MSI visualizes in situ — drug and metabolite
distribution mapped across the tumor, no homogenization required.
- Regional heterogeneity matters. Whole-tissue quantification answered "how much drug
reached the tumor." MALDI-MSI answers "where did it reach" — core vs. periphery, viable vs. stromal zones
— adding the spatial dimension to penetration studies.
- Orthogonal confirmation. Where imaging identifies candidate accumulation regions, LC-MS
on adjacent sections confirms identity and quantity — the same combined workflow we support.
Conclusion
This study demonstrates how tissue-level drug and metabolite quantification drives mechanism-of-action
research in oncology. Our MALDI-MSI spatial metabolomics service extends this capability — visualizing drug
and metabolite distribution across tissue sections at micrometer resolution, so penetration, heterogeneity,
and regional response are seen, not averaged.
Publications
Impaired ketogenesis ties metabolism to T cell dysfunction in COVID-19
Karagiannis, F., Peukert, K., Surace, L., et al.
Journal: Nature, 2022, 609, 801–807
13C-isotopic tracing metabolomics of T cell metabolism in COVID-19, linking impaired ketogenesis to
immune dysfunction. Demonstrates tissue-relevant metabolic readouts in a disease context.
Molecular pathogenesis of Alzheimer's disease onset in a mouse model: effects of cannabidiol treatment
Bishara, M. A., Chum, P. P., Miot, F. E. L., et al.
Journal: Frontiers in Neuroscience, 2025, 19, 1667585
Untargeted metabolomics of brain tissue in an Alzheimer's disease mouse model, resolving molecular
changes at disease onset and after intervention. Demonstrates brain tissue metabolomics for
neurodegeneration research.
The brain metabolome is modified by obesity in a sex-dependent manner
Norman, J. E., Milenkovic, D., Nuthikattu, S., et al.
Journal: International Journal of Molecular Sciences, 2024, 25(6), 3475
Untargeted LC-MS metabolomics of whole brain tissue revealing sex-specific metabolic remodeling in
obesity, with NAD+ homeostasis and fatty acid pathways affected. Demonstrates region-sensitive brain
metabolomics workflows.



 Contact Us



