

Redox Metabolomics: Choosing GSH/GSSG, NAD(H), and ROS Readouts
Submit Your InquiryChoose GSH/GSSG when the question concerns glutathione buffering and thiol oxidation, NAD+/NADH when it concerns catabolic and mitochondrial redox state, NADP+/NADPH when it concerns reductive biosynthesis and antioxidant regeneration, and a species-appropriate ROS assay when it concerns a rapid oxidant signal. No single readout proves “oxidative stress”; the strongest design pairs a mechanistic redox couple with a complementary ROS or oxidative-damage endpoint.
Redox Readout Selection at a Glance
- GSH, GSSG, and their ratio report the size and oxidation state of a major cellular thiol buffer, but they are highly sensitive to artefactual oxidation during collection and processing.
- NAD+ and NADH are closely linked to glycolysis, the TCA cycle, and oxidative phosphorylation; their ratio does not substitute for NADP+/NADPH.
- NADP+ and NADPH better address reductive capacity for antioxidant regeneration and biosynthesis, including support of glutathione recycling.
- ROS probes report a transient oxidant-related signal and must be matched to the reactive species, compartment, and probe chemistry; “total ROS” is rarely a chemically complete measurement.
- Oxidative-damage markers answer whether lipids, proteins, or nucleic acids were modified, whereas redox couples answer how the reducing and oxidizing pools are balanced.
Why One Oxidative Stress Marker Is Usually Not Enough
Oxidative stress is not a single molecule. It describes a disruption in redox regulation in which reactive species, antioxidant systems, metabolic cofactors, and macromolecular damage interact over time. Modern redox biology also recognizes that reactive oxygen species can act as regulated signals rather than only as damaging by-products (Sies and Jones, 2020). A valid study must therefore define what aspect of the redox system it intends to measure.
Three measurement categories are commonly confused. Direct or probe-assisted ROS assays seek evidence of a reactive species or oxidant-dependent reaction. Redox metabolomics measures reduced and oxidized small-molecule pools such as GSH/GSSG, NAD+/NADH, and NADP+/NADPH. Oxidative-damage assays measure downstream products formed when lipids, proteins, or nucleic acids are modified. These categories answer different questions and may peak at different time points.
An acute oxidant pulse can create an early ROS signal before a stable change is visible in a metabolite pool. A cell can also adapt by increasing NADPH supply or glutathione synthesis, producing a near-normal ratio despite substantial pathway activity.
Conversely, a low GSH/GSSG ratio can reflect altered glutathione turnover or sample oxidation rather than a specific ROS source. The result becomes interpretable only when the readout is aligned with the proposed mechanism and collection time.
Decision rule: If the claim concerns oxidant generation, use a species- and compartment-appropriate ROS method. If it concerns antioxidant buffer oxidation, quantify reduced and oxidized glutathione. If it concerns energy-linked redox state, quantify NAD+ and NADH. If it concerns reductive capacity and glutathione regeneration, quantify NADP+ and NADPH. If it concerns accumulated consequence, add an oxidative-damage marker.
When to Measure GSH and GSSG
Reduced glutathione (GSH) supplies thiol-reducing capacity and participates in peroxide detoxification and redox signaling. Glutathione disulfide (GSSG) forms when glutathione is oxidized and can be recycled using reducing equivalents ultimately supported by NADPH. Measuring GSH and GSSG together provides information about both pool size and oxidation state.
The GSH/GSSG ratio is useful when the hypothesis concerns thiol-buffer oxidation, antioxidant response, electrophile exposure, ferroptosis-related redox pressure, or glutathione recycling. However, the ratio should not be reported without the individual concentrations. The same ratio can arise from a large glutathione pool or a depleted pool, and those states have different biological implications. Concentrations and ratio should therefore be interpreted together.
Pre-analytical control is critical. GSH can oxidize after collection, artificially lowering GSH, increasing GSSG, and compressing the ratio. LC-MS/MS studies use rapid thiol stabilization and controlled processing to reduce this artefact, and differences in sample handling contribute to wide between-study variation (Enomoto et al., 2020). The sample plan should be locked before the main cohort and should include process controls that test whether oxidation occurred during handling.
Matrix also changes interpretation. Whole blood, plasma, tissue, cultured cells, and isolated organelles contain different pool sizes and cellular contributions. A workflow validated in a cell-rich matrix cannot be transferred to a low-concentration cell-free matrix without reassessing sensitivity, stability, and matrix effects. For mechanistic cell studies, pair glutathione measurements with cell number or protein normalization and an aligned sampling time.
Choose GSH/GSSG if the question is whether the glutathione buffer became more oxidized or depleted. Add NADP+/NADPH if the mechanism involves the reducing power that regenerates glutathione, and add a ROS or damage endpoint if the conclusion requires evidence of oxidant generation or downstream injury.
When to Measure NAD+ and NADH
NAD+ and NADH connect redox state to central carbon and energy metabolism. NAD+ accepts reducing equivalents in glycolysis and the TCA cycle, while NADH supplies electrons to oxidative phosphorylation and other reactions. The NAD+/NADH balance can therefore support questions involving respiratory activity, hypoxia response, mitochondrial perturbation, glycolytic adaptation, or substrate oxidation.
The ratio is not a general antioxidant score. A change may reflect altered carbon flux, electron transport, lactate dehydrogenase balance, compartmental shuttles, or total NAD pool size. Whole-cell extraction also combines cytosolic and mitochondrial pools unless the study uses a compartment-specific strategy. Interpret NAD+/NADH with pathway metabolites, energy-state indicators, oxygen-consumption context, or isotope tracing when the mechanistic claim requires flux.
NADH is labile, and NAD+ and NADH can interconvert during collection and extraction. Targeted LC-MS methods have been developed to quantify redox cofactors with rapid and controlled handling, but standardization remains challenging because several redox metabolites are chemically unstable (Petrova et al., 2021). A pilot should confirm recovery, linearity, and stability in the target matrix before large-scale analysis.
Report NAD+ and NADH individually as well as the selected ratio orientation. “NAD(H)” is a useful shorthand for the redox pair, but it is not a single analyte. State whether the report uses NAD+/NADH or NADH/NAD+ and keep that orientation consistent across figures and interpretation.
Choose NAD+/NADH if the study asks how catabolic or mitochondrial redox state changed. Add central carbon metabolites if the mechanism concerns glycolysis or TCA pathway reprogramming, and add NADP+/NADPH if the study also claims altered antioxidant or biosynthetic reducing capacity.
When to Measure NADP+ and NADPH
NADPH provides reducing equivalents for glutathione and thioredoxin systems and supports reductive biosynthesis. It is generated through several pathways, including the oxidative pentose phosphate pathway and other cytosolic or mitochondrial reactions. NADP+/NADPH therefore addresses a different biological function from NAD+/NADH even though the molecular pairs are closely related.
Use NADP+/NADPH when the hypothesis involves antioxidant regeneration, reductive biosynthesis, pentose phosphate pathway activity, one-carbon metabolism, or a shift between oxidative and reductive stress. A high reduced-pool ratio is not automatically beneficial: excess reducing equivalents can contribute to reductive stress and may alter mitochondrial electron flow and signaling (Xiao and Loscalzo, 2020).
As with the NAD pair, whole-sample concentration does not resolve subcellular compartments. The ratio can also remain stable while both oxidized and reduced pools expand or contract. Report absolute or normalized concentrations together with the ratio and, when possible, include pathway context such as glutathione, cysteine/cystine, pentose phosphate intermediates, or energy metabolites.
Creative Proteomics provides NAD+, NADH, NADP+, and NADPH analysis for targeted redox-cofactor studies. If the project requires a broader panel, the redox cofactor analysis service can connect nicotinamide cofactors with glutathione and flavin-related readouts.
When a ROS Readout Is the Right Choice
ROS is a collective term that includes chemically distinct species with different lifetimes, reaction partners, and cellular locations. A generic fluorescence increase should not be described as direct quantification of every reactive oxygen species. Probe oxidation can depend on competing reactions, probe distribution, light exposure, redox cycling, and cellular uptake. Reviews of fluorescent ROS methods emphasize that probe chemistry and product identity are essential for interpretation (Kalyanaraman et al., 2012).
Use a ROS readout when the question concerns an acute oxidant signal, the timing of reactive-species generation, or the cellular compartment in which a validated probe responds. Include appropriate positive and negative controls and confirm that the perturbation does not independently change probe loading, fluorescence, viability, or optical properties. Where specificity is critical, use an orthogonal method or measure a chemically defined probe product.
ROS signals are often transient, so sampling time is part of the hypothesis. A single late endpoint can miss an early oxidant burst. Conversely, an early ROS signal may not predict a sustained change in GSH/GSSG or oxidative damage. A time-course pilot can identify the informative window before the main experiment.
Creative Proteomics offers reactive oxygen species analysis for projects in which a ROS endpoint is mechanistically justified. For stronger causal interpretation, pair it with a redox metabolite panel or a downstream oxidative-stress marker rather than treating the ROS signal as a complete description of cellular redox state.
GSH/GSSG vs NAD(H) vs ROS: Side-by-Side Decision Table
| Readout | Primary question | Main strength | Main limitation | Best complementary measure |
|---|---|---|---|---|
| GSH and GSSG | Is the glutathione buffer depleted or oxidized? | Directly measures a major thiol redox pair | Highly vulnerable to handling oxidation | NADP+/NADPH, cysteine/cystine, ROS or damage marker |
| NAD+ and NADH | Has energy-linked or catabolic redox state changed? | Connects to glycolysis, TCA cycle, and respiration | Whole-cell values mix compartments and do not prove flux | Central carbon metabolites, oxygen-consumption context, tracing |
| NADP+ and NADPH | Has reductive biosynthetic or antioxidant capacity changed? | Links to glutathione recycling and anabolic reduction | Ratio can hide pool-size changes | GSH/GSSG, PPP or one-carbon metabolites |
| ROS probe/product | Is there an acute oxidant-related signal? | Captures timing and potentially compartment | Probe specificity and artefacts vary | Redox couples and oxidative-damage marker |
| Oxidative-damage marker | Did oxidation modify a macromolecular target? | Measures a more persistent consequence | May not identify the source or current redox state | ROS timing and redox metabolite panel |
No row is universally superior. If the research question is “Did the glutathione system become oxidized?”, choose GSH and GSSG. If it is “Did mitochondrial or glycolytic redox balance shift?”, choose NAD+ and NADH with pathway context. If it is “Was antioxidant reducing power depleted?”, choose NADP+ and NADPH with glutathione.
If it is “Was a reactive species generated now?”, choose an appropriate ROS method. If it is “Did oxidation leave measurable damage?”, choose a validated damage marker.
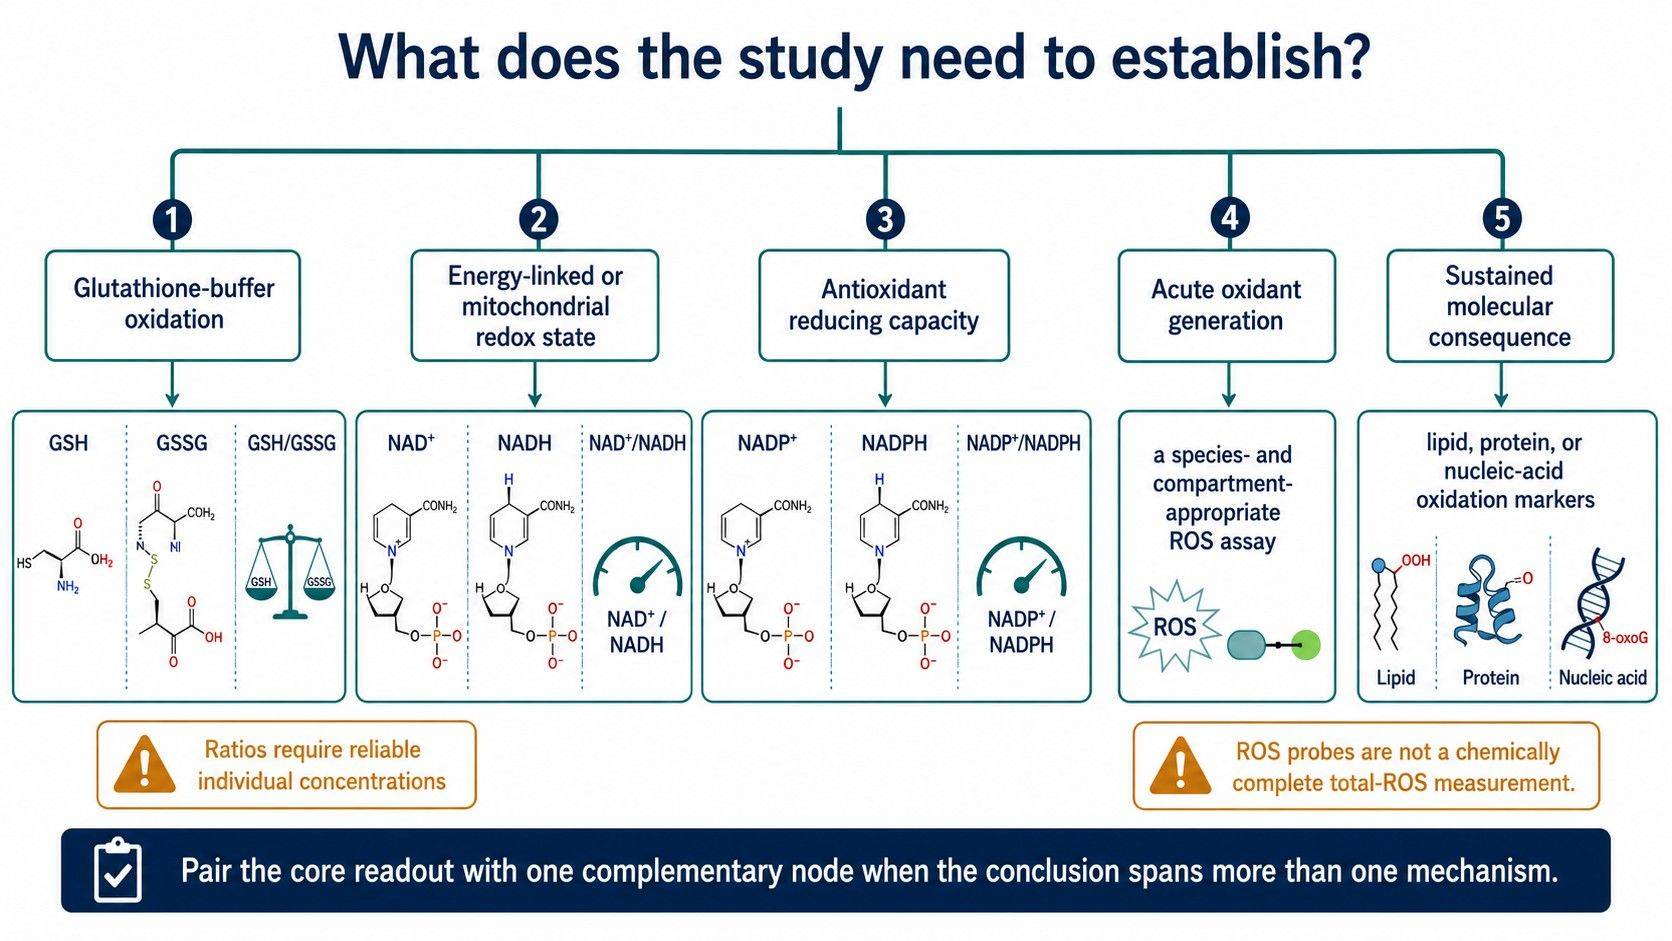 Redox readout selection should follow the mechanistic question: buffer state, metabolic cofactor balance, transient oxidant generation, or downstream oxidative consequence.
Designing a Redox Metabolomics Panel That Supports a Mechanistic Claim
Begin with the proposed causal chain. For example: perturbation → ROS generation → antioxidant-buffer oxidation → cofactor adaptation → oxidative damage. The study does not need to measure every node, but it should measure the node named in the conclusion and at least one complementary node that distinguishes alternatives.
For an acute perturbation, an early ROS time point paired with GSH/GSSG or NADP+/NADPH can show whether oxidant generation coincides with buffer consumption. For a mitochondrial hypothesis, NAD+/NADH plus central carbon or oxidative-phosphorylation metabolites is more informative than GSH/GSSG alone. For chronic adaptation, redox cofactors and damage markers may be more useful than one late ROS measurement.
| Mechanistic claim | Core readout | Recommended companion |
|---|---|---|
| Glutathione buffer oxidation | GSH, GSSG, GSH/GSSG | NADP+/NADPH and cysteine/cystine |
| Mitochondrial redox shift | NAD+, NADH, ratio | TCA, lactate/pyruvate, oxidative-phosphorylation context |
| Loss of antioxidant reducing power | NADP+, NADPH, ratio | GSH/GSSG and PPP-related metabolites |
| Acute ROS generation | Species-appropriate ROS assay | Early redox-couple measurement and viability control |
| Sustained oxidative consequence | Defined damage marker | Redox metabolite panel and earlier ROS time point |
The analytical panel should use matrix-appropriate calibration, internal standards where available, process blanks, pooled QC, and randomized batch design. Track the oxidized and reduced species separately. A ratio can magnify error when one denominator is near its quantification limit, so the report should state quantification status and avoid ratios built from unreliable values.
Sample Handling and QC Risks in Redox Metabolomics
Redox metabolites can change after sampling. Continued enzyme activity, oxygen exposure, temperature, pH, and delays can alter GSH/GSSG and nicotinamide cofactors. The sample plan should minimize and standardize the interval between collection and stabilization without turning the resource page into a bench protocol. A pilot can compare recovery and oxidation artefacts under the intended logistics.
Include reduced and oxidized calibrators, isotope-labelled internal standards where available, process blanks, and pooled matrix QC. Add a handling QC that challenges artifactual oxidation or cofactor degradation. For large cohorts, distribute experimental groups across preparation batches and use bridge QCs to distinguish biological change from batch-specific redox drift.
Avoid comparing ratios generated by different matrices or incompatible methods. Do not interpret a plasma GSH/GSSG ratio as equivalent to a cell-extract ratio, and do not combine a fluorescence-kit NAD readout with an LC-MS redox-cofactor value without method-bridging evidence. Sample compartment and analytical definition are part of the result.
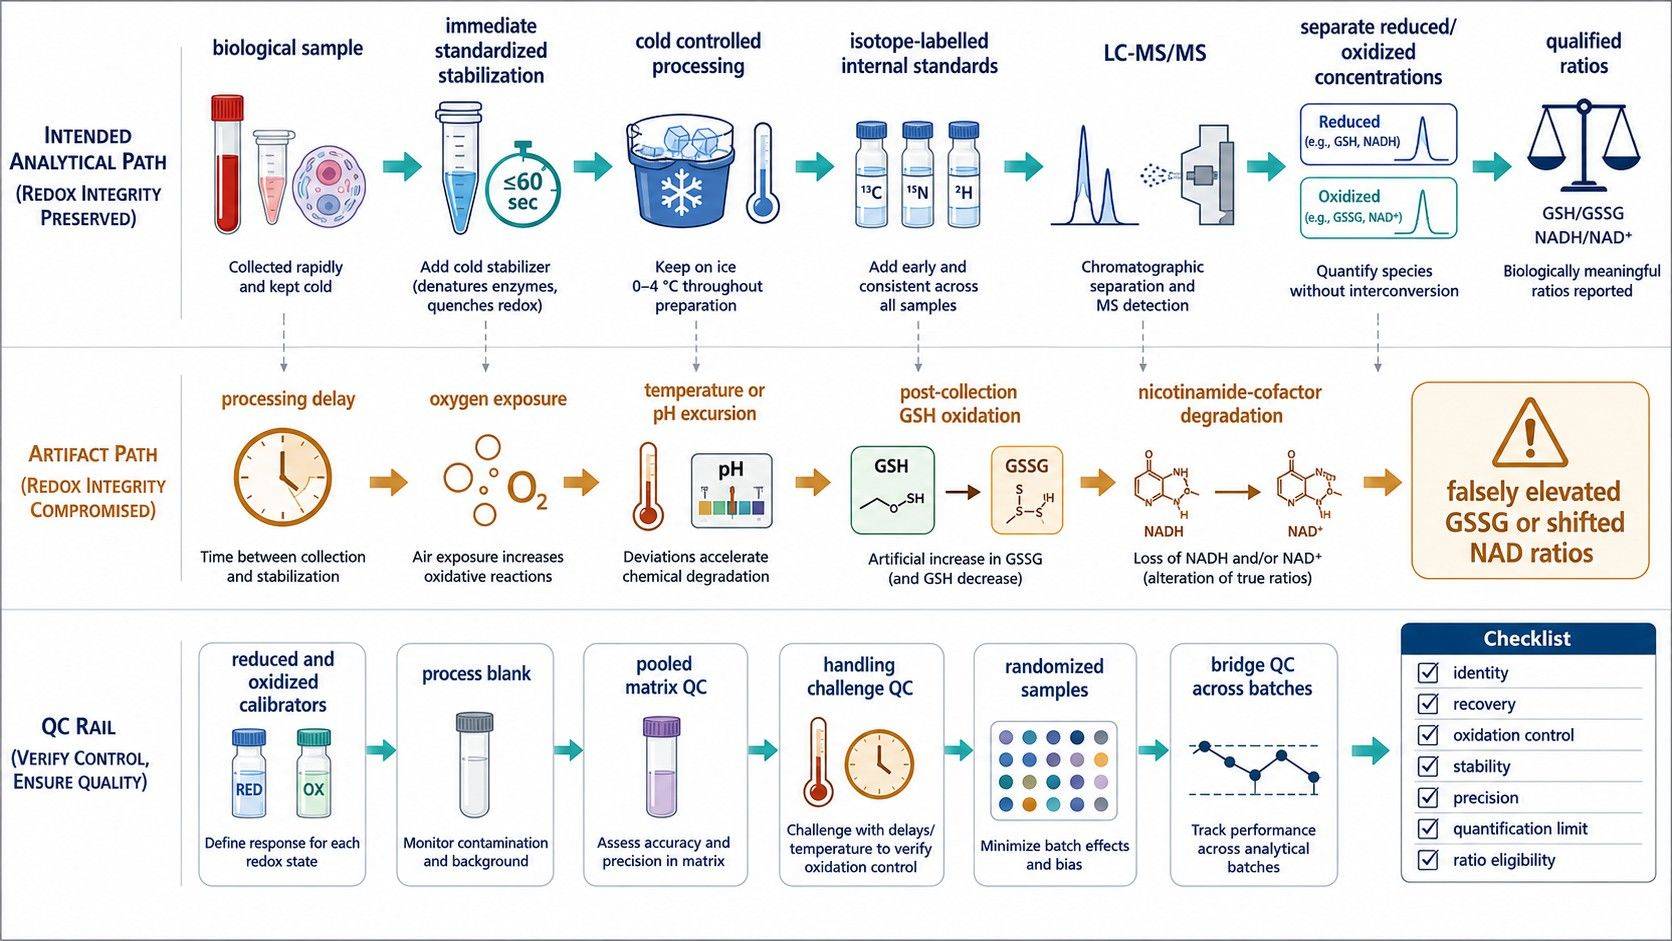 Immediate, standardized stabilization and redox-specific controls help distinguish biological redox change from post-collection oxidation or cofactor degradation.
How Creative Proteomics Supports Redox Study Design
Creative Proteomics can help convert an “oxidative stress” question into a defined redox measurement plan. Available options include GSH/GSSG analysis, targeted NAD(H) and NADP(H) quantification, ROS analysis, and oxidative stress marker analysis for downstream consequences.
For feasibility review, provide the biological model, sample matrix, perturbation, expected response timing, proposed mechanism, number of samples, and whether the priority is oxidant generation, redox-buffer state, energy metabolism, antioxidant capacity, or oxidative damage. These details determine which readouts should be core, complementary, or excluded.
Frequently Asked Questions
Is GSH/GSSG the best single marker of oxidative stress?
It is a useful marker of glutathione-buffer oxidation, but it does not identify a specific ROS source or capture every redox system. Report GSH and GSSG concentrations with the ratio and add a complementary readout when the claim extends beyond glutathione.
Should I measure NAD+/NADH or NADP+/NADPH?
Choose NAD+/NADH for energy-linked and catabolic redox questions, and NADP+/NADPH for antioxidant regeneration and reductive biosynthesis. Measure both pairs when the hypothesis connects mitochondrial energy state to cellular reducing capacity.
Can a ROS assay replace redox metabolomics?
No. A ROS assay addresses an oxidant-related signal, while redox metabolomics measures reduced and oxidized metabolite pools. They are complementary and may respond at different times.
Why can GSSG be falsely elevated during sample handling?
GSH can oxidize after collection if stabilization and processing are not controlled. This artefact lowers measured GSH, raises GSSG, and makes the sample appear more oxidized than it was biologically.
Do I need a time course for redox measurements?
A time course is strongly useful when ROS generation is expected to be transient or when antioxidant adaptation follows the initial perturbation. A pilot with early and later points can identify when each readout is most informative.
What information should I provide for a redox metabolomics project?
Provide the model, matrix, perturbation, sampling time, sample number, expected mechanism, and desired conclusion. Also state whether the project needs individual concentrations, ratios, a ROS endpoint, or downstream oxidative-damage markers.
References
- Petrova, B., Warren, A., Vital, N. Y., et al. (2021). Redox metabolism measurement in mammalian cells and tissues by LC-MS. Metabolites, 11(5), 313. https://doi.org/10.3390/metabo11050313
- Liu, H., Xu, F., Gao, Y., Pang, Y., Xie, C., & Jiang, C. (2020). An integrated LC-MS/MS strategy for quantifying the oxidative-redox metabolome in multiple biological samples. Analytical Chemistry, 92(13), 8810–8818. https://doi.org/10.1021/acs.analchem.0c00242
- Sies, H., & Jones, D. P. (2020). Reactive oxygen species (ROS) as pleiotropic physiological signalling agents. Nature Reviews Molecular Cell Biology, 21, 363–383. https://doi.org/10.1038/s41580-020-0230-3
- Kalyanaraman, B., Darley-Usmar, V., Davies, K. J. A., et al. (2012). Measuring reactive oxygen and nitrogen species with fluorescent probes: Challenges and limitations. Free Radical Biology and Medicine, 52(1), 1–6. https://doi.org/10.1016/j.freeradbiomed.2011.09.030
- Enomoto, A. C., Schneider, E., McKinnon, T., & Goldfine, H. (2020). Validation of a simplified procedure for convenient and rapid quantification of reduced and oxidized glutathione in human plasma by liquid chromatography tandem mass spectrometry analysis. Biomedical Chromatography, 34(9), e4854. https://doi.org/10.1002/bmc.4854
- Xiao, W., & Loscalzo, J. (2020). Metabolic responses to reductive stress. Antioxidants & Redox Signaling, 32(18), 1330–1347. https://doi.org/10.1089/ars.2019.7803
- Griendling, K. K., Touyz, R. M., Zweier, J. L., et al. (2016). Measurement of reactive oxygen species, reactive nitrogen species, and redox-dependent signaling in the cardiovascular system. Circulation Research, 119, e39–e75. https://doi.org/10.1161/RES.0000000000000110

 Contact Us


