

Tannin and Proanthocyanidin Analysis: Total Content, Individual Compounds, or Degree of Polymerization?
Submit Your InquiryChoose total tannin content for standardized screening, individual-compound analysis for molecular specificity, and mean degree of polymerization (mDP) when proanthocyanidin chain structure matters. Many projects benefit from two complementary measurements because no single result describes tannin abundance, identity, and polymer architecture at the same time.
This distinction affects more than method selection. It determines which biological or product-development claims the data can support, which reference standards are required, how samples should be extracted, and whether results can be compared with published values. A useful project brief therefore starts with the decision the measurement must support—not with a request for a generic "tannin test."
Creative Proteomics provides targeted tannins analysis for food, feed, botanical, and plant-tissue research. Defining the intended endpoint before method development helps align the analyte panel, calibration strategy, extraction scope, and final report with the question behind the inquiry.
Tannin Analysis Strategy at a Glance
The three measurement levels answer different questions:
- Total tannin content estimates the response of a sample under a specified colorimetric, precipitation, or depolymerization assay. It is most useful for screening many samples, ranking treatments, or monitoring batches when one validated method and one reporting standard are used consistently.
- Individual-compound analysis measures named molecules or selected oligomers. It is the appropriate choice when identity, absolute concentration, treatment-specific changes, marker compounds, or hydrolysable-versus-condensed tannin composition matters.
- Proanthocyanidin mDP estimates the average number of flavan-3-ol units per polymer after controlled cleavage and analysis of terminal and extension units. It is useful when chain architecture, astringency-related research, extract characterization, or processing-induced depolymerization is central to the study.
These endpoints are complementary rather than interchangeable. If the objective is rapid relative comparison under one assay, choose total content. If the objective names specific compounds, choose targeted chromatographic quantification. If the hypothesis concerns polymer chain length or subunit composition, choose an mDP workflow and consider pairing it with total or individual analysis.
Why Total Tannin Content Is Method-Dependent
Chemical Diversity Changes Analytical Response
Tannins are a chemically diverse group rather than one analyte. Hydrolysable tannins include gallotannins and ellagitannins built around polyol cores and phenolic-acid-derived units. Condensed tannins, also called proanthocyanidins, contain flavan-3-ol units linked into oligomers and polymers. Their linkage patterns, hydroxylation, galloylation, stereochemistry, and polymer length influence extraction and detector response.
Consequently, "milligrams of tannin per gram" is incomplete unless the report also identifies the assay, calibration standard, extraction conditions, and reporting basis. Wisdom et al. showed that different tannin standards changed calculated concentrations and that protein-precipitation capacity varied among tannin sources (Wisdom et al., 1987). The numerical result is therefore method-defined, not a universal inventory of every tannin molecule in the sample.
Sample Matrix Changes What Is Measured
The measurement problem is particularly important across different matrices. A method optimized for a clear beverage may not transfer directly to fibrous feed, seed coats, bark, powdered botanical material, or a formulation containing proteins and polysaccharides. Matrix components can suppress ionization, bind polymers, contribute background color, or retain non-extractable proanthocyanidins.
For studies in which tannins are one part of a broader phenolic response, broader polyphenol profiling can place selected tannins alongside flavonoids, phenolic acids, and related metabolites. That approach answers a different question from a tannin-specific assay and should be selected when pathway-level or formulation-wide context is required.
When Total Tannin Content Is the Right Endpoint
Total-content methods are useful when the primary decision is comparative: Which cultivar has the stronger assay response? Did processing lower the apparent tannin level? Which extraction condition produces the highest yield? Are production batches consistent under a fixed procedure?
Common assay families include protein-precipitation methods, vanillin or DMAC reactions for flavan-3-ol-related material, and acid-butanol conversion of condensed tannins to colored anthocyanidin products. Each assay responds to a subset of structures and may weight those structures differently. A total value should therefore be interpreted as "equivalents measured by this method," not as the sum of individually identified molecules.
Strengths of Total-Content Assays
- They support efficient screening when sample numbers are high and the same matrix, extraction, standard, and calculation are applied throughout.
- They can provide a practical rank order for process optimization, cultivar comparison, feed screening, or stability studies.
- They reduce the need to obtain standards for every possible oligomer or polymer.
- They can act as a first-stage measurement before a smaller subset of samples is selected for detailed LC-MS analysis.
Limits That Must Be Stated in the Report
Total assays generally do not establish molecular identity. Co-extracted compounds can contribute to color or precipitation, while tannins with different structures may generate different response factors. Results calibrated as catechin equivalents, tannic acid equivalents, quebracho equivalents, or another standard should not be treated as directly interchangeable.
Extraction scope is another limitation. Zurita et al. demonstrated that appreciable polymeric proanthocyanidins can remain in the residue after conventional aqueous-organic extraction (Zurita et al., 2012). If only the soluble extract is analyzed, the report should identify the result as extractable tannin or extractable proanthocyanidin content rather than implying a complete mass balance.
Total content is appropriate if the study needs a standardized screening index. It is not sufficient if the conclusion depends on a named ellagitannin, gallotannin, catechin stereoisomer, oligomer, linkage type, or polymer-length distribution.
When to Quantify Individual Tannin Compounds
Which Questions Require Compound-Specific Results?
Individual-compound analysis is required when the research question is molecular. Examples include comparing catechin and epicatechin, tracking a selected ellagitannin during processing, confirming a marker compound in a botanical extract, distinguishing changes in monomers from changes in oligomers, or relating a defined analyte panel to another omics dataset.
How Detector Choice Affects Identification
Liquid chromatography with UV, fluorescence, tandem mass spectrometry, or high-resolution mass spectrometry can separate and detect individual targets. The choice of detector depends on the expected structures, concentrations, matrix, and need for confirmation. Tandem MS adds precursor/product-ion selectivity, while high-resolution MS supports accurate-mass annotation and structural investigation. A 2025 review describes the role of UHPLC coupled with high-resolution or triple-quadrupole MS in tannin characterization and quantification across structurally diverse compounds (Sharma et al., 2025).
How Standards and Isomers Affect Quantification
Chromatographic resolution and standard availability remain critical. Isomers can share nominal mass and similar fragments, and not every tannin or oligomer has a commercially available authentic standard. Where a compound lacks a matched standard, the result may need to be reported as a relative response, a semi-quantitative value, or equivalents of a structurally related calibrant. That qualification should be explicit in the deliverables.
Normal-phase HPLC with fluorescence and MS detection has been used to resolve procyanidins from monomers through decamers, with higher polymers represented as an unresolved fraction (Gu et al., 2002). Adamson et al. similarly quantified cocoa procyanidins through decamers across multiple laboratories (Adamson et al., 1999). These studies illustrate both the analytical value of oligomer-level profiles and the practical boundary between resolved species and complex polymeric material.
For a defined set of targets, a plant targeted metabolomics strategy can integrate analyte selection, matrix-matched evaluation, internal standards where available, and quantitative or semi-quantitative reporting. If the claim names specific molecules, individual analysis should be the primary endpoint; a total assay can be added as contextual information but cannot replace compound identity.
When to Measure Proanthocyanidin Degree of Polymerization (mDP)
What mDP Can Reveal
The mean degree of polymerization describes average proanthocyanidin chain length. It is commonly estimated by cleaving interflavan bonds in the presence of a nucleophile such as phloroglucinol or a thiol. Terminal units are released as flavan-3-ols, whereas extension units form identifiable adducts. Their molar relationship is used to estimate mDP and, depending on the method, subunit composition or galloylation.
This endpoint is useful when the hypothesis concerns polymer architecture rather than only abundance. Processing, maturation, extraction, oxidation, or fractionation can alter chain composition even when a total-content assay changes only modestly. In grape-seed research, thiolysis followed by HPLC has been validated for total proanthocyanidins and mDP, illustrating how controlled depolymerization can convert a heterogeneous polymer pool into measurable terminal and extension-unit signals (Shi et al., 2022).
Why mDP Is Not a Complete Size Distribution
However, mDP is an average, not a complete distribution. Two samples can share the same mDP while containing different mixtures of short oligomers and long polymers. Reaction completeness, side reactions, inaccessible material, adduct standards, and response-factor assumptions can bias the estimate. An optimized UHPLC-MS/MS phloroglucinolysis study noted that the limited availability of pure phloroglucinol adduct standards complicates accurate quantification (González-Centeno et al., 2021).
An mDP result should therefore be accompanied by the cleavage chemistry, calculation formula, calibration approach, extraction fraction, and unit-composition data when available. If the decision depends on average chain architecture, choose mDP. If it depends on the abundance of each oligomer size, add an oligomer-distribution method; mDP alone cannot show that distribution.
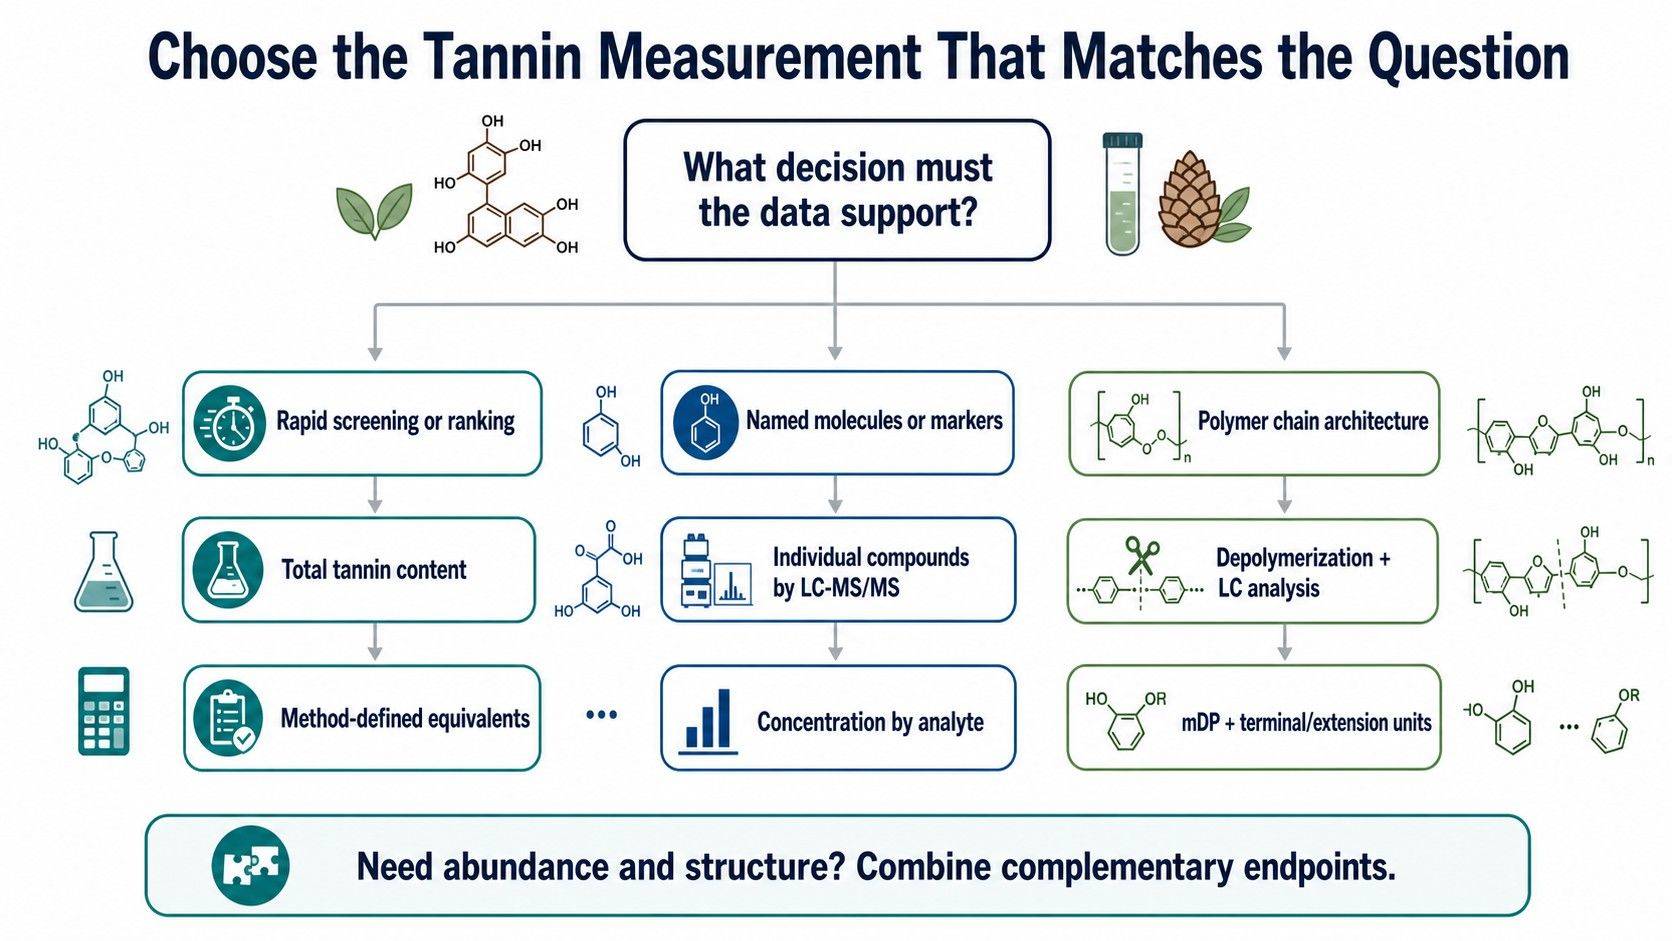 Decision framework for choosing total tannin content, individual-compound quantification, or proanthocyanidin mDP analysis.
Total Tannins vs Individual Compounds vs mDP: Side-by-Side Comparison
| Decision criterion | Total tannin content | Individual compounds | Proanthocyanidin mDP |
|---|---|---|---|
| Primary question | How strong is the sample response under a defined assay? | Which named tannins or oligomers are present, and at what concentration? | What is the average proanthocyanidin chain length and subunit composition? |
| Typical output | Equivalents per mass or volume | Concentration or relative abundance by analyte | Mean DP, terminal/extension units, optional galloylation or composition |
| Best use | Screening, ranking, batch comparison, process optimization | Marker quantification, treatment comparison, compositional profiling | Polymer-structure research, processing effects, extract characterization |
| Main strength | Efficient comparison under standardized conditions | Molecular specificity | Structural information not captured by total concentration |
| Main limitation | Method-dependent and non-specific | Standards and isomer resolution may limit absolute quantification | Average value; does not provide a full chain-length distribution |
| Critical controls | Same extraction, standard, assay, and matrix handling | Calibration, retention time, ion ratios, recovery, matrix effect | Reaction completeness, adduct response, terminal/extension-unit recovery |
| Suitable standalone endpoint? | Yes, for comparative screening | Yes, when targets are known and covered | Yes, only when average polymer architecture is the central question |
The table should be read from the intended claim backward. A statement about overall assay response requires a total method. A statement about molecular composition requires chromatographic targets. A statement about average chain architecture requires depolymerization and mDP. If a study needs to connect abundance with structure, use a combined design rather than forcing one endpoint to support both conclusions.
When to Combine Total Tannin, Individual Compound, and mDP Analysis
Use Tiered Screening for Large Sample Sets
A tiered design can reduce analytical ambiguity and concentrate detailed work where it adds value. One practical sequence is to screen all samples with a standardized total-content method, select biologically or commercially relevant groups, and then quantify individual compounds or mDP in representative samples. This design preserves broad comparison while adding molecular explanation.
Use Parallel Endpoints When Composition Matters
Another option is to run total content and an individual panel on every sample. If total response changes but measured targets do not, the difference may reflect unmeasured oligomers, polymers, hydrolysable tannins, interfering compounds, or extraction behavior. If individual targets change while total content remains stable, compositional remodeling may have occurred without a large change in aggregate assay response.
Combining mDP with total proanthocyanidin content is especially useful for distinguishing concentration changes from chain-architecture changes. Adding resolved oligomer profiling can reveal whether a shift in mDP reflects enrichment of smaller species, loss of high polymers, or a broader redistribution. Sintara et al. used relative response factors to improve the estimation of cranberry proanthocyanidin oligomers and polymers, demonstrating why detector response across polymer sizes requires deliberate treatment (Sintara et al., 2020).
A combined strategy is justified when each result supports a separate decision. If the additional endpoint does not change interpretation, sample selection, or the claim, it adds complexity without corresponding value.
How Sample Matrix and Extraction Affect Tannin Results
Method selection begins with the physical sample and expected tannin class. Fresh plant tissue, dried powder, seed, peel, bark, beverage, feed, purified fraction, and formulated product differ in water content, particle size, binding components, and analyte concentration. These properties affect extraction efficiency and the extent to which the analytical aliquot represents the original sample.
The study plan should document at least the following:
- Sample identity and preparation state. Record species, tissue, processing condition, moisture basis, particle-size treatment, and storage history relevant to interpretation.
- Expected tannin class. Indicate whether hydrolysable tannins, condensed tannins, flavan-3-ol monomers, selected oligomers, or an unknown mixture is expected.
- Reporting basis. Decide whether results should be expressed per wet mass, dry mass, extract mass, serving volume, or another clearly defined denominator.
- Extractable versus non-extractable scope. State whether the project covers only soluble material or also requires evaluation of residue-bound polymeric proanthocyanidins.
- Matrix comparability. Avoid comparing values across dissimilar matrices unless extraction recovery and matrix response have been evaluated.
When the biological question extends beyond a predefined tannin panel, plant metabolomics analysis can be considered for broader metabolic context. That choice is useful for discovery-oriented questions, whereas a tannin-specific workflow is more direct when the targets and decision thresholds are already known.
Calibration, Quality Control, and Reporting for Tannin Analysis
The result is only useful when its analytical definition is visible. A project request should specify the required level of quantification and the comparisons that matter. Absolute quantification generally requires appropriate calibration and analyte-specific or closely matched standards; relative or semi-quantitative analysis can be scientifically valid when standards are unavailable, provided the reporting language reflects that limitation.
QC for Total Tannin Assays
For total assays, quality control should include a defined reference standard, consistent reaction conditions, suitable blanks, replicate assessment, and dilution checks where sample response may exceed the working range. Results should include the equivalent used and the sample-mass or volume basis.
QC for LC-MS and mDP Analysis
For individual LC-MS analysis, relevant controls may include calibration performance, blanks, retention-time agreement, qualifier transitions or accurate-mass evidence, spike recovery, internal-standard behavior, and evaluation of matrix effects. For mDP, the method should additionally assess depolymerization performance and how terminal and extension-unit responses enter the calculation.
Report Method Context for Cross-Study Comparison
Cross-study comparability requires caution. Published "total tannin" or "total proanthocyanidin" values may use different standards, extraction solvents, reaction chemistries, wavelengths, or denominators. A strong report preserves those method details instead of presenting a number without context. The targeted metabolomics analysis process provides additional context on quantitative and semi-quantitative workflows.
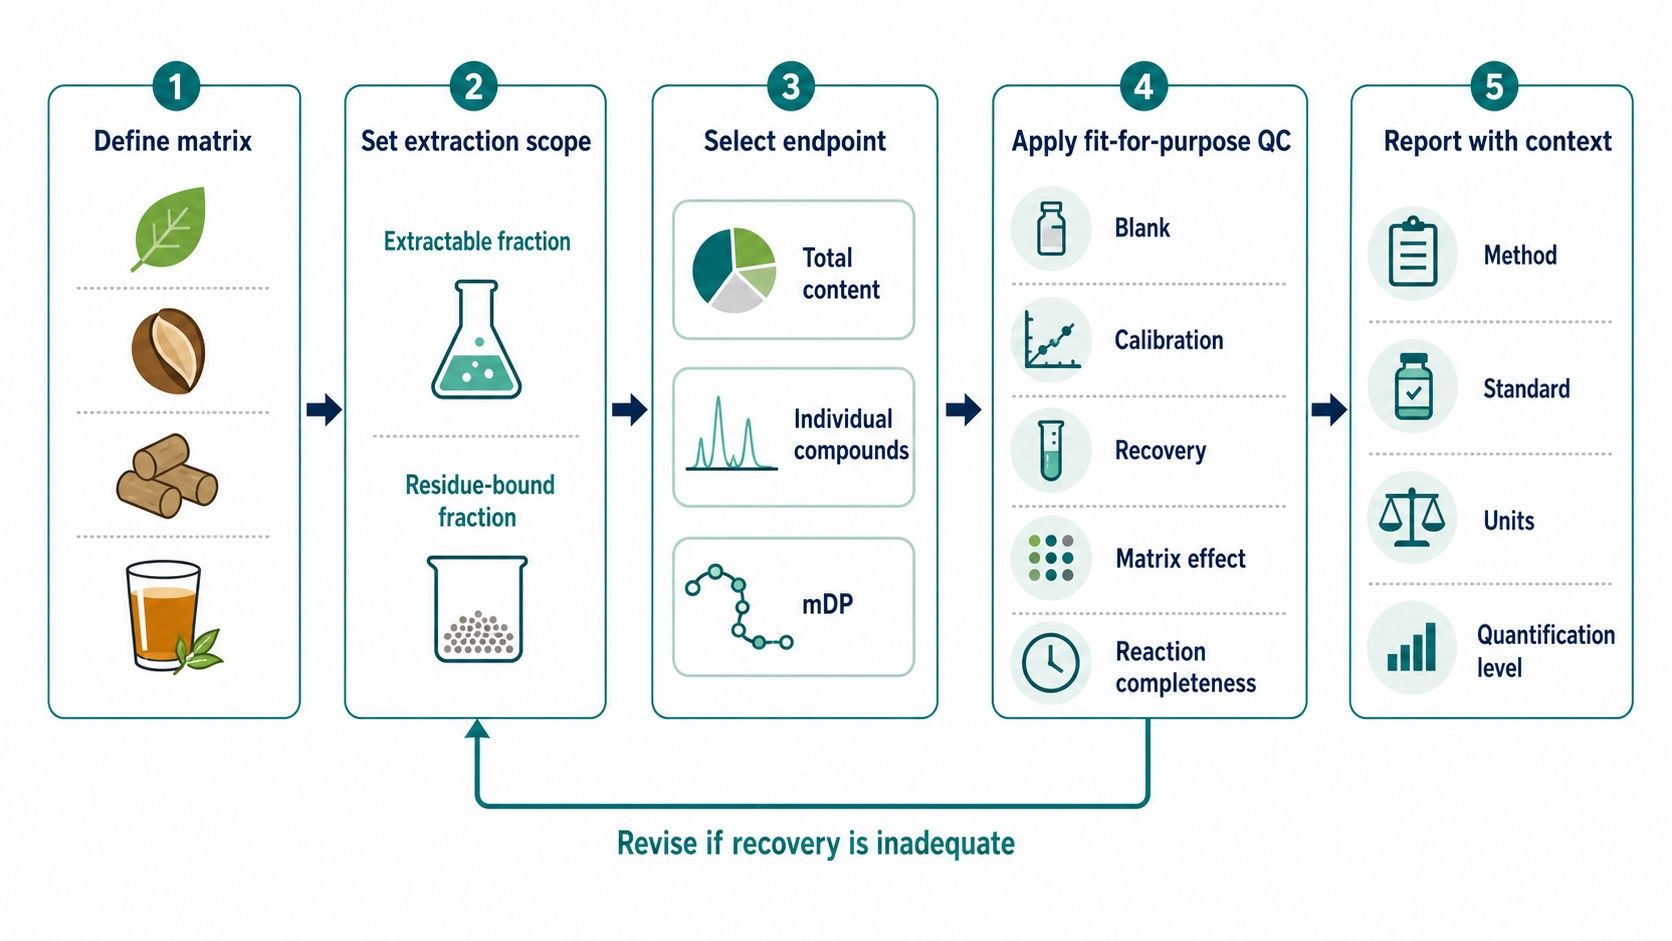 Quality-control workflow connecting matrix definition and extraction scope to calibration and reportable tannin endpoints.
How Creative Proteomics Supports Tannin Study Design
Creative Proteomics can help translate a broad request for tannin testing into a defined analytical question. Feasibility review considers the sample matrix, expected tannin class, concentration range, number of comparison groups, reference-standard availability, and whether the required output is total content, selected compounds, proanthocyanidin structural information, or a combination.
Before requesting a quote, prepare a sample list, matrix description, experimental groups, expected analytes if known, desired reporting units, and the claim the data must support. These details allow the analytical scope and quality controls to be matched to the decision rather than added after data generation. Contact us to discuss a tannin and proanthocyanidin analysis plan for your food, feed, botanical, or plant research samples.
Frequently Asked Questions
How do I decide between total tannins and individual tannin analysis?
Use total tannin content when you need standardized screening or ranking under one method. Use individual analysis when your conclusion depends on named compounds, molecular composition, or compound-specific changes. If both the overall response and the molecular explanation matter, combine the two endpoints.
Can total tannin results from different methods be compared directly?
Usually not. Different assays, extraction conditions, standards, and reporting bases can produce different values from the same material. Direct comparison is most defensible when the method, calibrant, matrix preparation, and units are aligned.
Is mDP the same as the complete proanthocyanidin size distribution?
No. mDP is an average calculated from terminal and extension units after controlled cleavage. Samples with different oligomer and polymer distributions can produce similar averages, so a distribution method is needed when individual chain-length fractions matter.
Can LC-MS/MS quantify every tannin in a sample absolutely?
Not always. Absolute quantification depends on chromatographic resolution and suitable standards, and many complex tannins or oligomers lack matched commercial calibrants. These compounds may require semi-quantitative reporting, relative response factors, or structural annotation rather than fully traceable absolute concentrations.
Should non-extractable proanthocyanidins be included?
Include them when the project aims to estimate the broader polymeric pool in matrices where residue binding is expected, such as fibrous foods or feeds. If the objective concerns only a soluble extract or finished liquid, an extractable fraction may be sufficient, but the scope should be stated explicitly.
What information is needed for a tannin analysis quotation?
Provide the matrix, sample count, treatment groups, storage condition, expected tannin class, target compounds if known, desired endpoint, and reporting basis. Also explain whether the goal is screening, absolute quantification, structural comparison, or correlation with another dataset; this information drives method and QC selection.
References
- Wisdom, C. S., Gonzalez-Coloma, A., & Rundel, P. W. (1987). Ecological tannin assays: Evaluation of proanthocyanidins, protein binding assays and protein precipitating potential. Oecologia, 72, 395–401. https://doi.org/10.1007/BF00377570
- Adamson, G. E., et al. (1999). HPLC method for the quantification of procyanidins in cocoa and chocolate samples and correlation to total antioxidant capacity. Journal of Agricultural and Food Chemistry, 47(10), 4184–4188. https://doi.org/10.1021/jf990317m
- Gu, L., Kelm, M. A., Hammerstone, J. F., Beecher, G., Holden, J., Haytowitz, D., & Prior, R. L. (2002). Screening of foods containing proanthocyanidins and their structural characterization using LC-MS/MS and thiolytic degradation. Journal of Agricultural and Food Chemistry, 50(17), 4852–4860. https://doi.org/10.1021/jf020214v
- Zurita, J., Díaz-Rubio, M. E., & Saura-Calixto, F. (2012). Improved procedure to determine non-extractable polymeric proanthocyanidins in plant foods. International Journal of Food Sciences and Nutrition, 63(8), 936–939. https://doi.org/10.3109/09637486.2012.681634
- Sintara, M., Wang, Y., Li, L., Liu, H., Cunningham, D. G., Prior, R. L., & Wu, X. (2020). Quantification of cranberry proanthocyanidins by normal-phase high-performance liquid chromatography using relative response factors. Phytochemical Analysis, 31(6), 874–883. https://doi.org/10.1002/pca.2952
- González-Centeno, M. R., et al. (2021). Improving the phloroglucinolysis protocol and characterization of Sagrantino wines proanthocyanidins. Food Research International, 145, 110397. PubMed PMID: 33669538
- Shi, J., et al. (2022). Development and validation of a thiolysis-high-performance liquid chromatography method for the determination of total proanthocyanidins and mean degree of polymerization in grape seeds. Journal of Separation Science, 45(13), 2177–2185. https://doi.org/10.1002/jssc.202200003
- Sharma, A., et al. (2025). Mass spectrometry in tannin research: Recent advances in structural characterization and quantification. Mass Spectrometry Reviews. https://doi.org/10.1002/mas.70013

 Contact Us


