

Integrating Microbial Volatilomics and Transcriptomics to Link VOCs with Biosynthetic Pathways
Submit Your InquiryIntegrate microbial volatilomics and transcriptomics by collecting headspace VOCs and RNA from matched cultures at the same physiological states, then map well-annotated VOC changes to coherent gene modules and validate prioritized links experimentally. Correlation alone does not establish a biosynthetic pathway.
The integration is valuable because each layer answers a different part of the mechanism. Volatilomics measures compounds that enter the headspace under defined culture and sampling conditions. Transcriptomics measures RNA abundance in the sampled cells or community. When both datasets are synchronized, they can prioritize pathways that are consistent with VOC production, precursor use, transport, stress response, or interspecies signaling.
Projects requiring headspace sampling and GC-MS characterization can begin with a defined volatilomics analysis strategy. The analytical plan should be established together with the biological design because growth phase, medium, vessel, headspace volume, sampling temperature, and biomass can all change the measured microbial VOC profile.
Microbial VOC–Transcriptomics Study Design at a Glance
A defensible study follows six linked decisions:
- Define whether the transcriptome belongs to the VOC producer, a VOC-exposed receiver, or a mixed community.
- Select culture states that represent the biological question, not only convenient clock times.
- Collect VOC and RNA data from matched biological units or synchronized sister cultures.
- Use time-matched sterile-medium, vessel, septum, fiber, and process controls for the volatile workflow.
- Map only sufficiently supported VOC identities to plausible reactions, precursors, enzymes, or gene modules.
- Treat integrated associations as candidates until perturbation, targeted quantification, enzyme evidence, or isotope tracing tests the proposed pathway.
If the goal is to discover which genes may produce a VOC, profile the producer transcriptome. If the goal is to understand how another organism responds to a microbial VOC, profile the receiver transcriptome. If the system is a co-culture or community, use species-resolved RNA analysis and design controls that separate production from response.
What Microbial Volatilomics and Transcriptomics Can Show
Volatilomics Measures an Emitted Phenotype
Microbial volatilomics captures volatile and semi-volatile compounds that partition from a culture into the headspace. Typical classes include alcohols, aldehydes, ketones, esters, organic acids, hydrocarbons, terpenes, aromatic compounds, and sulfur- or nitrogen-containing volatiles. The mVOC 4.0 database contains approximately 3,500 reported microbial volatiles, illustrating both the chemical breadth and the annotation challenge (Kemmler et al., 2025).
Headspace abundance is not identical to intracellular production rate. A measured signal reflects biosynthesis, consumption, chemical conversion, dissolution in the medium, adsorption to surfaces, and gas–liquid partitioning. HS-SPME adds another selective partitioning step because different fibers and extraction conditions enrich compound classes differently.
Volatilomics can therefore show that a reproducible emitted phenotype changes between conditions. It cannot, by itself, identify which gene produced the compound or prove that the organism synthesized every detected peak.
Transcriptomics Measures a Regulatory State
RNA-seq identifies genes or transcripts whose abundance differs across strains, treatments, time points, or growth states. In a producer-focused study, relevant signals may include enzymes in precursor pathways, candidate terminal enzymes, transporters, transcriptional regulators, and genes within a biosynthetic module.
Transcript abundance is not enzyme activity or metabolic flux. Protein abundance, cofactor supply, substrate availability, post-translational regulation, compartmentalization, and product feedback can separate RNA changes from VOC output. A gene can also respond to a VOC without participating in its synthesis.
Yung et al. exposed Escherichia coli to VOCs and observed transcriptional changes involving stress, transport, and Fe/S-cluster-related functions (Yung et al., 2016). This is useful evidence of a receiver response, but it should not be interpreted as evidence that those genes synthesize the VOCs used for exposure.
Integration Generates Testable Pathway Hypotheses
The joint dataset is strongest when a VOC change, its plausible precursor chemistry, and a coordinated gene module agree across conditions or time. For example, sulfur-containing VOCs can be evaluated alongside sulfur-amino-acid metabolism, γ-glutamyl transfer, C–S lyase candidates, redox state, and transport.
In Lentinula edodes mycelium, volatile sulfur compounds varied by cultivation stage, while transcriptomics and enzyme measurements prioritized γ-glutamyl transpeptidase and C–S lyase candidates (Li et al., 2024). The study illustrates a stronger pathway argument because volatile, transcript, enzyme-activity, and temporal evidence were considered together.
If VOC and transcript changes align only at one endpoint, describe a candidate association. If multiple pathway members move coherently and the timing is plausible, prioritize the pathway. If genetic or biochemical perturbation changes the VOC as predicted, the pathway claim becomes substantially stronger.
Why Matched Sampling Is Essential for VOC–Gene Integration
Match Physiological State Before Matching Clock Time
Microbial VOC profiles change with growth phase. Zscheppank et al. followed E. coli and Pseudomonas aeruginosa headspace during growth and detected growth-dependent volatile production, including compounds prominent during stationary phase (Zscheppank et al., 2014). RNA profiles also change rapidly as cultures transition between exponential growth, nutrient limitation, and stationary phase.
Two samples collected after the same incubation time may not be biologically matched if a mutation, treatment, oxygen condition, or co-culture changes growth rate. Conversely, samples matched only by optical density may differ in pH, residual substrate, oxygen transfer, or morphology.
Use the microbial metabolomics growth-phase and sample-fraction framework to define whether the study needs time-matched, physiology-matched, or longitudinal sampling. Record biomass, viable count where relevant, pH, temperature, oxygen regime, substrate concentration, and culture volume at each collection.
Use Synchronized Sister Cultures When Sampling Can Perturb RNA
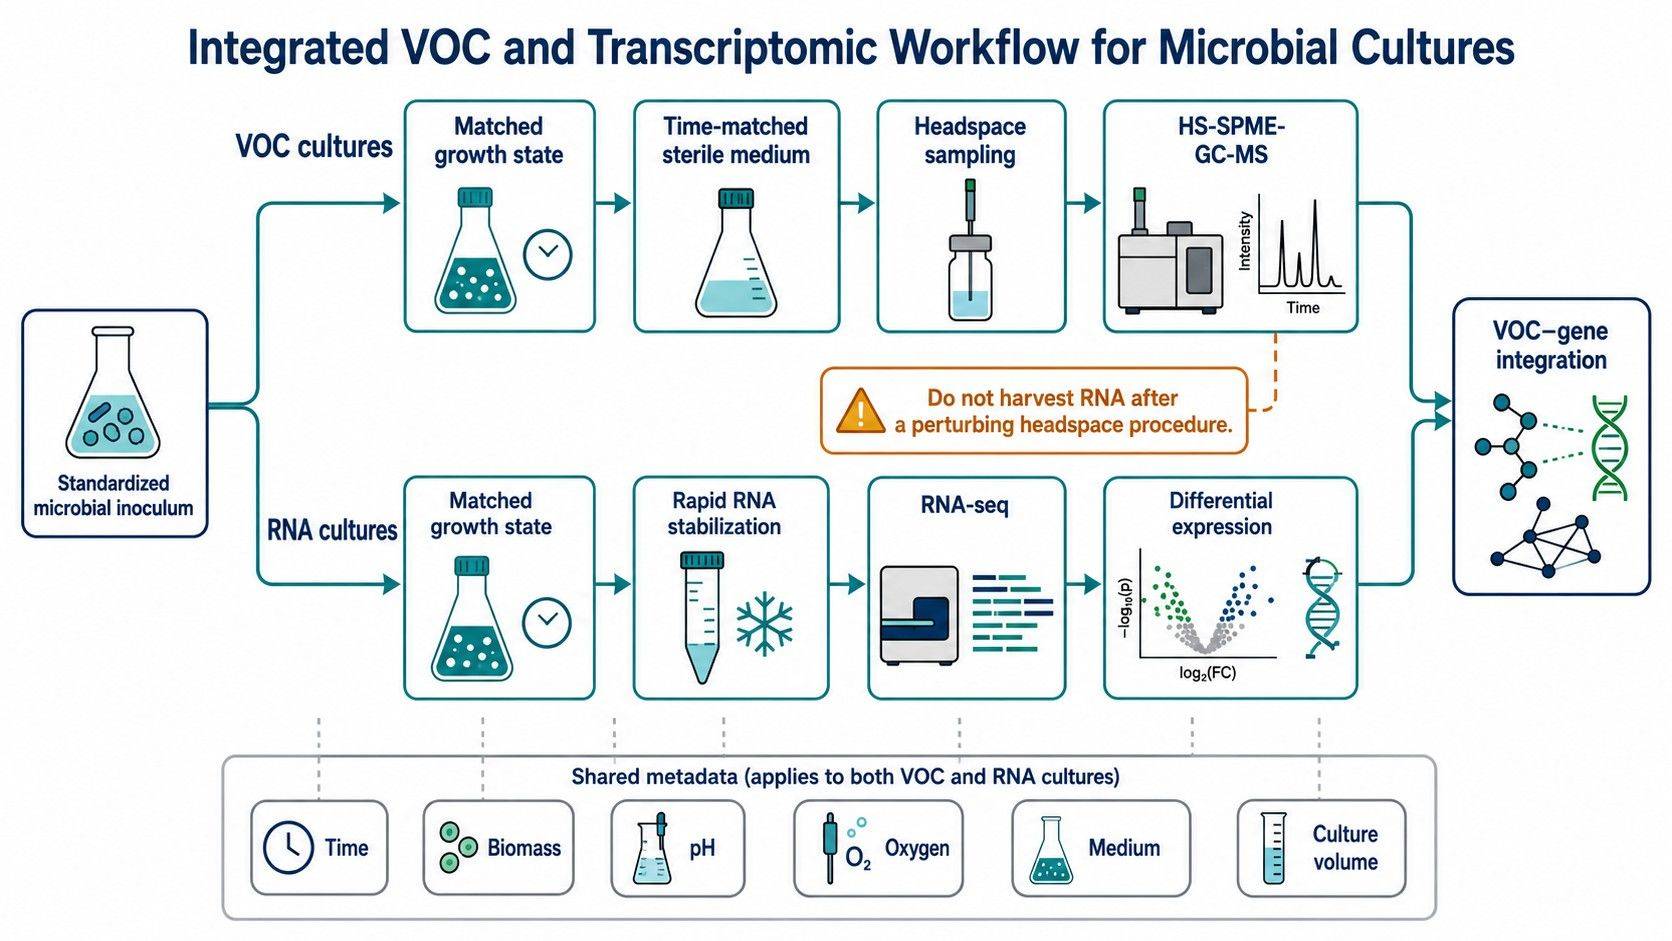
Headspace equilibration, heating, agitation, repeated vial puncture, or prolonged SPME exposure may change culture conditions. If RNA is harvested after an analytical headspace procedure, the transcriptome may partly reflect the sampling intervention rather than the original biological state.
A practical design uses synchronized sister cultures: one set is allocated to VOC sampling and another to rapid RNA stabilization at the matched time point. Both sets should share inoculum, vessel geometry, fill volume, headspace, medium, agitation, temperature, and treatment history. Randomize biological replicates across preparation and analytical order.
Non-destructive headspace sampling from the same culture can be considered when the procedure has been shown not to disturb the system. If repeated sampling is used, include a control exposed to the same puncture, agitation, temperature, and sampling schedule without fiber extraction or with an appropriate procedural control.
Design Time Points Around Expression–Emission Lag
Transcriptional activation can precede enzyme accumulation and VOC emission. Headspace abundance may then persist after transcript levels decline because the product accumulates or partitions slowly. A single synchronized endpoint can miss this lag and create a misleading negative correlation.
Use at least three biologically justified time points when the objective is pathway discovery: an early regulatory point, an active production point, and a later accumulation or transition point. The exact schedule depends on organism, growth rate, VOC class, and process objective.
Mendes et al. integrated transcript and aroma-metabolite data at two fermentation stages across Saccharomyces cerevisiae strains, showing how stage-specific sampling helps separate early regulation from later aroma outcomes (Mendes et al., 2017). For dynamic projects, model lagged relationships rather than correlating all measurements as if they were simultaneous.
 Matched sister cultures align microbial headspace VOC sampling with RNA stabilization while preserving growth-state and process controls.
How to Generate Interpretable Microbial VOC Data
Separate Biological VOCs from Medium and Material Background
Sterile medium is chemically active. Incubation can release, degrade, oxidize, or transform compounds without microbial activity. Vessel materials, caps, septa, liners, fibers, solvents, and laboratory air can also contribute peaks.
Each time point should include an uninoculated medium blank that experiences the same vessel, headspace ratio, incubation, temperature, agitation, and sampling procedure. Include instrument and process blanks appropriate to the workflow. For co-cultures, retain each monoculture under the same conditions so that emergent VOCs can be separated from the sum of single-organism profiles.
Rees et al. found that the volatile profile of Klebsiella pneumoniae was strongly medium-dependent: only a minority of associated compounds were common across all tested rich media (Rees et al., 2017). This result shows why a VOC–gene association should not be generalized beyond the culture environment used to generate it.
Support VOC Annotation Before Pathway Mapping
An electron-ionization library match is a candidate identity, not automatic confirmation. Pathway mapping becomes unreliable when multiple compounds share similar spectra, chromatographic peaks co-elute, or the proposed identity is chemically inconsistent with retention behavior.
A robust untargeted workflow combines spectral matching with retention-index evidence and clear annotation-confidence reporting. Authentic standards are most valuable for VOCs that will anchor a biosynthetic claim or become targeted validation markers. Unknown or weakly annotated features can remain in multivariate analysis, but they should not be assigned to a named pathway prematurely.
The microbial metabolomics service can provide complementary non-volatile pathway context when VOC interpretation requires intracellular or extracellular precursors. This is useful when the emitted product may originate from amino-acid, fatty-acid, central-carbon, or sulfur metabolism that is better represented by an additional targeted or untargeted metabolite panel.
Normalize the Volatile Signal to the Biological Question
Raw peak area can be dominated by biomass, culture volume, headspace volume, and extraction history. Record an internal standard response and an appropriate biological denominator. Depending on the question, that denominator may be viable cells, cell count, dry biomass, optical-density range, total culture volume, or substrate consumed.
Do not assume that normalization removes every growth effect. A high-biomass culture can change pH, oxygen, and substrate availability, which can redirect metabolism as well as increase total emission. Report both the normalized VOC measure and the growth or process variables used to interpret it.
How to Prepare Transcriptomics for Biosynthetic Pathway Linking
Identify the Producer, Receiver, or Active Community
The first annotation in the transcriptome is biological ownership. In a pure culture, reads can be assigned to the producer genome. In a producer–receiver experiment, collect RNA separately when possible. If physical separation is used while allowing volatile exchange, confirm that the configuration does not alter headspace transfer.
In mixed fermentation or environmental communities, metatranscriptomics is often more informative than total community DNA because it indicates which organisms are transcriptionally active. Pan et al. integrated metatranscriptomics with HS-SPME-GC-MS and other metabolomic layers across fermentation time points to identify active microbial groups associated with volatile flavor formation (Pan et al., 2023).
Species-level ownership may remain ambiguous when reads map to conserved genes or reference genomes are incomplete. Report the taxonomic and functional resolution that the data actually support. A genus–VOC correlation is not the same as assigning a specific enzyme in a specific strain.
Map Genes to Reactions, Not Only Broad KEGG Terms
Broad pathway enrichment is useful for orientation but can produce weak mechanistic narratives. "Amino acid metabolism" or "secondary metabolism" may contain many reactions unrelated to the measured VOC. Move from pathway enrichment to reaction-level candidates wherever annotation permits.
For each prioritized VOC, document its candidate precursor, reaction type, required cofactors, potential enzyme families, transport step, and competing routes. Examine whether multiple genes in the local pathway change coherently and whether their direction is compatible with the VOC pattern.
Not every microbial VOC is encoded by a compact biosynthetic gene cluster. Terpenes and specialized metabolites may map to recognizable synthases or clusters, whereas alcohols, aldehydes, acids, ketones, and esters can arise from distributed primary metabolic reactions. Choose pathway mapping rather than BGC mining alone when the chemistry points to central metabolism.
Predefine Transcriptomic Quality and Contrast
The RNA contrast must match the VOC contrast. Use the same strain, treatment, medium, growth state, and time-point definitions. Include sufficient biological replication and preserve sample identifiers that connect each RNA sample to its VOC-matched culture.
Quality review should cover RNA integrity or an appropriate quality measure, sequencing depth, mapping rate, sample relationships, outliers, and batch structure. Differential-expression thresholds should be defined with multiple-testing control. Avoid selecting candidate genes only because they have the largest fold change; pathway position, annotation confidence, timing, and VOC chemistry also matter.
Step-by-Step VOC–Transcriptomics Integration Workflow
Step 1: Build Two Quality-Controlled Data Matrices
Prepare a VOC matrix containing sample IDs, peak areas or concentrations, retention indices, annotation level, blanks, internal standards, and biological normalization variables. Prepare a transcript matrix with matching biological IDs, gene annotations, normalized expression estimates, differential-expression statistics, and QC flags.
Do not integrate failed samples simply to preserve balance. First determine whether a failed VOC sample has a valid matched RNA sample or whether the biological pair should be excluded from cross-omics analysis while retained for single-layer reporting.
Step 2: Filter to Biologically Supported VOC Features
Remove or flag features dominated by blanks, inconsistent detection, carryover, or unstable analytical response. Keep annotation confidence separate from statistical significance. A highly significant unknown feature can be valuable for classification but cannot yet support a named biosynthetic pathway.
For targeted VOCs, use calibrated concentrations where standards and method performance allow. For untargeted data, preserve the distinction between relative abundance and absolute concentration throughout integration and reporting.
Step 3: Create a VOC-to-Reaction Candidate Map
Map each priority VOC to one or more plausible reactions using curated biochemical knowledge, organism annotation, literature, and chemical class. Retain alternatives rather than forcing a one-to-one assignment. For example, an aldehyde may arise from amino-acid catabolism, fatty-acid oxidation, or non-enzymatic conversion depending on the compound and matrix.
Use genome annotation and, where appropriate, biosynthetic-cluster tools to identify genes capable of those reactions. The output should be a candidate map with evidence fields, not a final pathway diagram that hides uncertainty.
Step 4: Test Temporal and Condition-Level Concordance
Evaluate whether VOCs and candidate genes respond to the same experimental contrasts and whether a biologically plausible lag improves the relationship. Cluster genes into co-expression modules and ask whether modules are enriched for the reactions, cofactors, transporters, or regulators relevant to the VOC class.
Wang et al. combined SPME-GC-MS, LC-MS, and transcriptomics across fungal growth stages and identified candidate terpenoid-related genes associated with stage-dependent metabolite patterns (Wang et al., 2025). Such module-level evidence is generally more persuasive than one gene–one peak correlation selected after inspecting the data.
Step 5: Rank Candidates by an Evidence Score
A practical ranking table can include:
- VOC annotation confidence and blank-corrected reproducibility.
- Magnitude and consistency of the VOC change.
- Gene annotation and reaction specificity.
- Differential-expression evidence and module membership.
- Temporal order between transcript change and VOC emission.
- Presence of required precursor, cofactor, or neighboring pathway evidence.
- Support from strain comparison, literature, knockout data, or enzyme studies.
The integrative metabolome and transcriptome analysis framework can support coordinated pathway mapping and candidate prioritization. For projects combining additional layers such as proteomics, microbiome sequencing, or isotope tracing, a broader multi-omics study design may be appropriate.
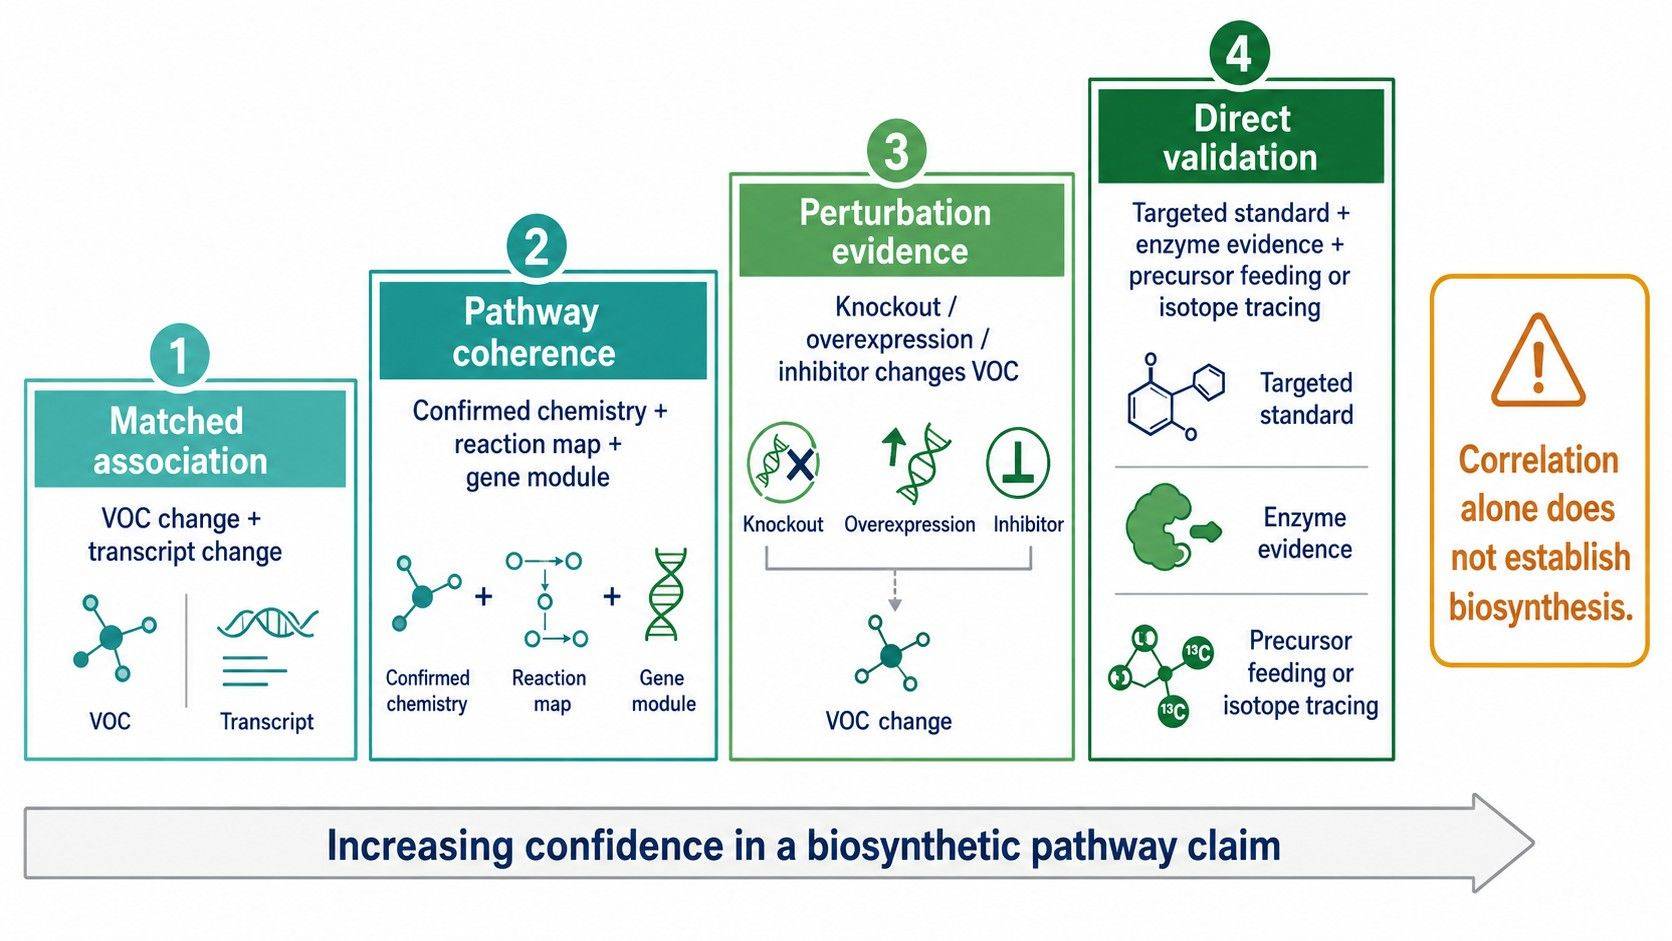
 A VOC–gene correlation becomes a pathway claim only after chemical confirmation, coherent pathway evidence, and functional validation.
From VOC–Gene Correlation to Biosynthetic Pathway Evidence
Level 1: Matched Association
The VOC and transcript change in the same conditions or time series after QC and biological normalization. This level supports a candidate association. It does not establish direction, direct catalysis, or pathway ownership.
Level 2: Pathway Coherence
The VOC identity is supported, its chemistry maps to a plausible reaction, and several genes or pathway components change coherently. Precursor or cofactor evidence strengthens the interpretation. This level supports pathway prioritization but still allows indirect regulation.
Level 3: Perturbation Evidence
Gene deletion, knockdown, overexpression, promoter manipulation, inhibitor treatment, or a naturally deficient strain changes the VOC in the predicted direction. Include growth and stress controls so that a global physiological defect is not mistaken for a specific biosynthetic effect.
Volatile profiling of Aspergillus parasiticus mutants showed that disruption of the global regulator VeA altered branched-chain amino-acid catabolism and ethanol-related volatile output, illustrating how genetic perturbation can connect regulation with emitted metabolism (Roze et al., 2010).
Level 4: Direct Biochemical or Flux Validation
The strongest support may include targeted VOC quantification with an authentic standard, RT-qPCR confirmation, protein or enzyme-activity evidence, precursor feeding, isotope tracing, or biochemical characterization of the candidate enzyme. The appropriate combination depends on whether the claim concerns regulation, pathway contribution, or direct catalysis.
If the project needs a shortlist of candidate pathways, Levels 1–2 may be sufficient. If it needs to claim that a gene controls VOC production, add perturbation. If it needs to claim a direct biosynthetic reaction, add biochemical or isotope-based validation.
Common Integration Errors That Produce Misleading VOC Pathways
- Profiling the wrong transcriptome. Receiver-cell RNA explains VOC response, not producer biosynthesis.
- Using unmatched growth states. A growth-rate difference can produce both a VOC shift and a transcript shift without a specific mechanistic link.
- Ignoring sterile-medium and material blanks. Background peaks can be correlated with genes because both vary with batch or sampling order.
- Mapping low-confidence VOC identities. A wrong compound name creates a plausible-looking but incorrect pathway.
- Treating broad pathway enrichment as reaction evidence. A significant KEGG category may contain no enzyme capable of producing the VOC.
- Using all pairwise correlations without correction. High-dimensional matrices create many associations by chance, especially with few biological replicates.
- Ignoring time lag. Gene induction may precede VOC accumulation, so same-time correlations can miss the relevant relationship.
- Calling concentration change "flux." Headspace abundance and RNA levels do not measure carbon flow unless the design includes time-resolved mass balance or isotope tracing.
How Creative Proteomics Supports Microbial VOC Pathway Studies
Creative Proteomics can help define whether the project requires untargeted VOC discovery, targeted confirmation, producer transcriptomics, metatranscriptomics, non-volatile precursor profiling, or a staged combination. Feasibility review considers organism, culture format, medium, headspace geometry, expected VOC classes, growth-phase design, RNA collection, reference genome availability, and the validation claim.
For a quotation, provide the organism or community, experimental groups, culture conditions, number of time points, biomass trajectory, VOCs or pathways of interest, available genome resources, and whether the intended result is association, pathway prioritization, or functional validation. These details allow the analytical and integration plan to be built around the evidence required for the final claim.
Frequently Asked Questions
Can RNA-seq identify the gene that produces a microbial VOC?
RNA-seq can prioritize candidate genes whose expression is consistent with VOC production, but it rarely identifies a producer gene by itself. A convincing assignment also needs supported VOC identity, reaction-level plausibility, synchronized sampling, and preferably genetic, biochemical, or isotope-based validation.
Should VOCs and RNA be collected from the same culture vial?
Use the same culture only when headspace sampling has been shown not to perturb the transcriptome or culture state. Otherwise, use synchronized sister cultures with identical inoculum, vessel geometry, medium, headspace, and treatment history, assigning one set to VOC analysis and one to rapid RNA stabilization.
How many time points are needed to link VOCs with gene expression?
At least three biologically justified time points are useful when pathway discovery depends on temporal order: an early regulatory stage, an active production stage, and a later accumulation or transition stage. A single endpoint can identify associations but cannot reliably resolve expression–emission lag.
Which blanks are essential for microbial volatilomics?
Include time-matched uninoculated medium incubated in the same vessel and analytical blanks that capture septum, fiber, solvent, and instrument background. Co-culture studies should also include each monoculture so emergent VOCs can be distinguished from additive single-organism profiles.
Can a VOC–gene correlation be reported as a biosynthetic pathway?
No. Correlation supports a candidate association. A pathway claim requires supported chemical identity, coherent reaction and gene evidence, plausible timing, and validation proportional to the claim, such as perturbation, enzyme measurement, precursor feeding, or isotope tracing.
When is metatranscriptomics needed instead of isolate RNA-seq?
Use metatranscriptomics when VOC production occurs in a mixed fermentation, microbiome, biofilm, or environmental community and the active organism is not known in advance. Isolate RNA-seq is preferable when a defined producer strain can be studied independently and the goal is gene-level pathway assignment.
References
- Roze, L. V., Chanda, A., Laivenieks, M., Beaudry, R. M., Artymovich, K. A., Koptina, A. V., Awad, D. W., Valeeva, D., Jones, A. D., & Linz, J. E. (2010). Volatile profiling reveals intracellular metabolic changes in Aspergillus parasiticus: VeA regulates branched chain amino acid and ethanol metabolism. BMC Biochemistry, 11, 33. PubMed Central: PMC2939540
- Zscheppank, C., Wiegand, H. L., Lenzen, C., Wingender, J., & Telgheder, U. (2014). Investigation of volatile metabolites during growth of Escherichia coli and Pseudomonas aeruginosa by needle trap-GC-MS. Analytical and Bioanalytical Chemistry, 406(26), 6617–6628. https://doi.org/10.1007/s00216-014-8111-2
- Yung, P. Y., et al. (2016). Global transcriptomic responses of Escherichia coli K-12 to volatile organic compounds. Scientific Reports, 6, 19899. https://doi.org/10.1038/srep19899
- Mendes, I., et al. (2017). Integrating transcriptomics and metabolomics for the analysis of the aroma profiles of Saccharomyces cerevisiae strains from diverse origins. BMC Genomics, 18, 455. https://doi.org/10.1186/s12864-017-3816-1
- Rees, C. A., Nordick, K. V., Franchina, F. A., Lewis, A. E., Hirsch, E. B., & Hill, J. E. (2017). Volatile metabolic diversity of Klebsiella pneumoniae in nutrient-replete conditions. Metabolomics, 13(2), 18. https://doi.org/10.1007/s11306-016-1161-z
- Pan, Y., et al. (2023). Exploring the role of active functional microbiota in flavor generation by integrated metatranscriptomics and metabolomics during Niulanshan baijiu fermentation. Foods, 12(22), 4140. https://doi.org/10.3390/foods12224140
- Li, Z., et al. (2024). Transcriptome reveals the key genes related to the metabolism of volatile sulfur-containing compounds in Lentinula edodes mycelium. Foods, 13(14), 2179. https://doi.org/10.3390/foods13142179
- Kemmler, E., et al. (2025). mVOC 4.0: A database of microbial volatiles. Nucleic Acids Research, 53(D1). https://doi.org/10.1093/nar/gkae961
- Wang, L., et al. (2025). Integrative transcriptome and metabolome analysis reveals candidate genes related to terpenoid synthesis in Amylostereum areolatum. Journal of Fungi, 11(5), 383. https://doi.org/10.3390/jof11050383

 Contact Us


